. 2022 Jan 4;10(1):2.
doi: 10.1186/s40478-021-01300-9.

Developmental deficits and staging of dynamics of age associated Alzheimer's disease neurodegeneration and neuronal loss in subjects with Down syndrome

Affiliations

Developmental deficits and staging of dynamics of age associated Alzheimer's disease neurodegeneration and neuronal loss in subjects with Down syndrome

Jerzy Wegiel et al. Acta Neuropathol Commun. .

Abstract

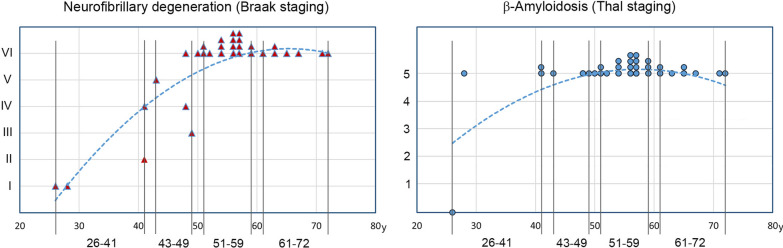
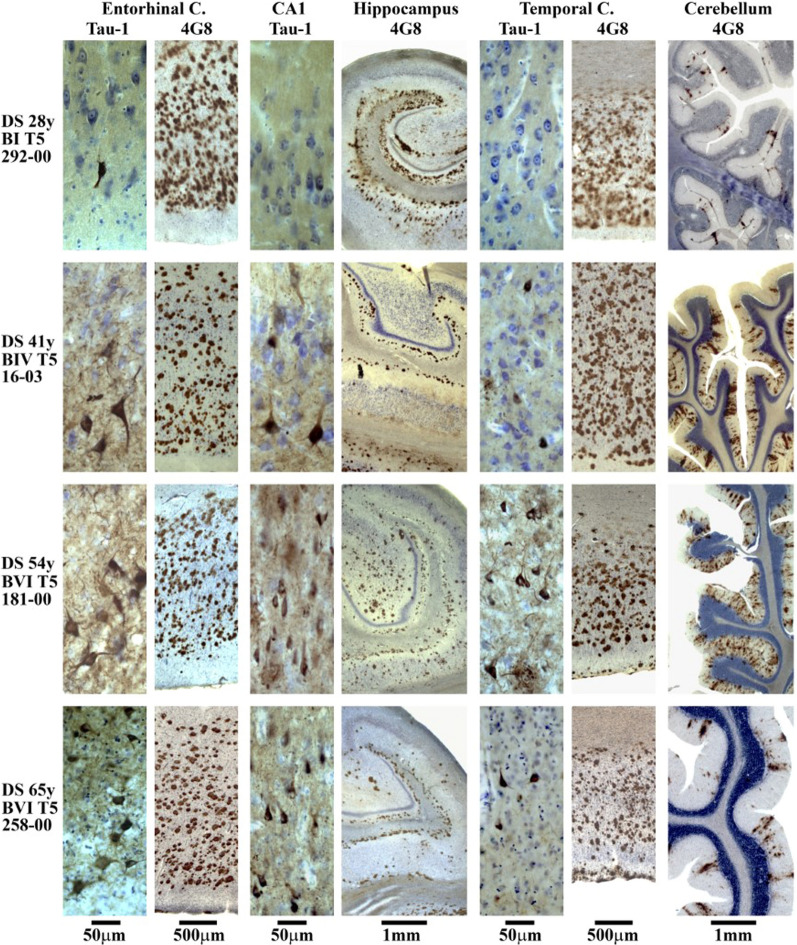
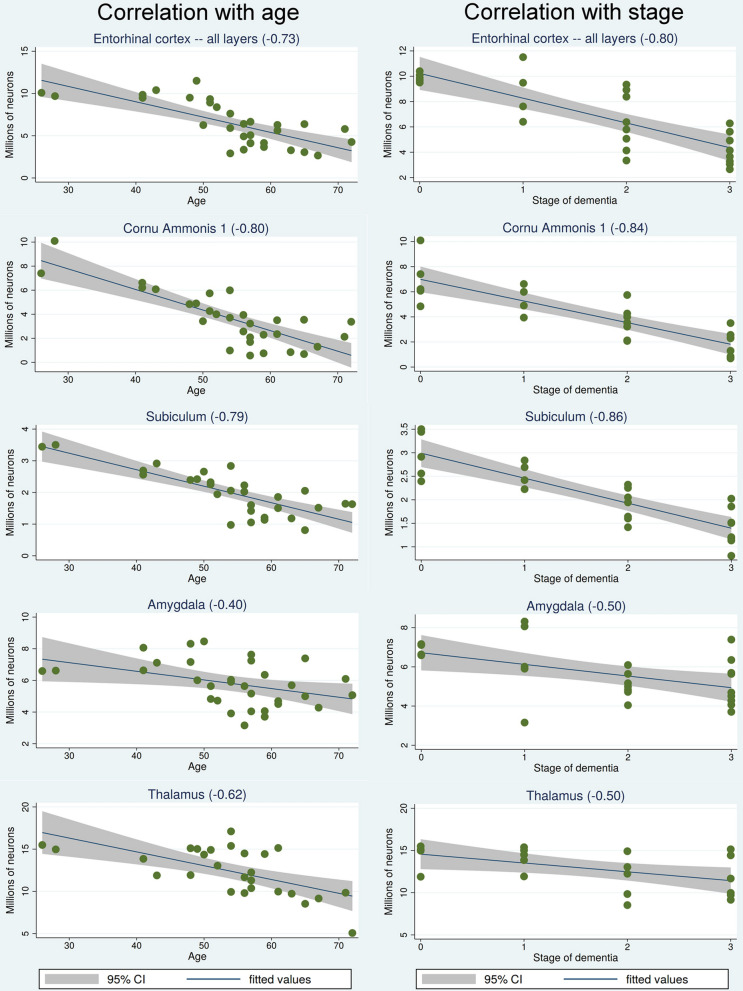
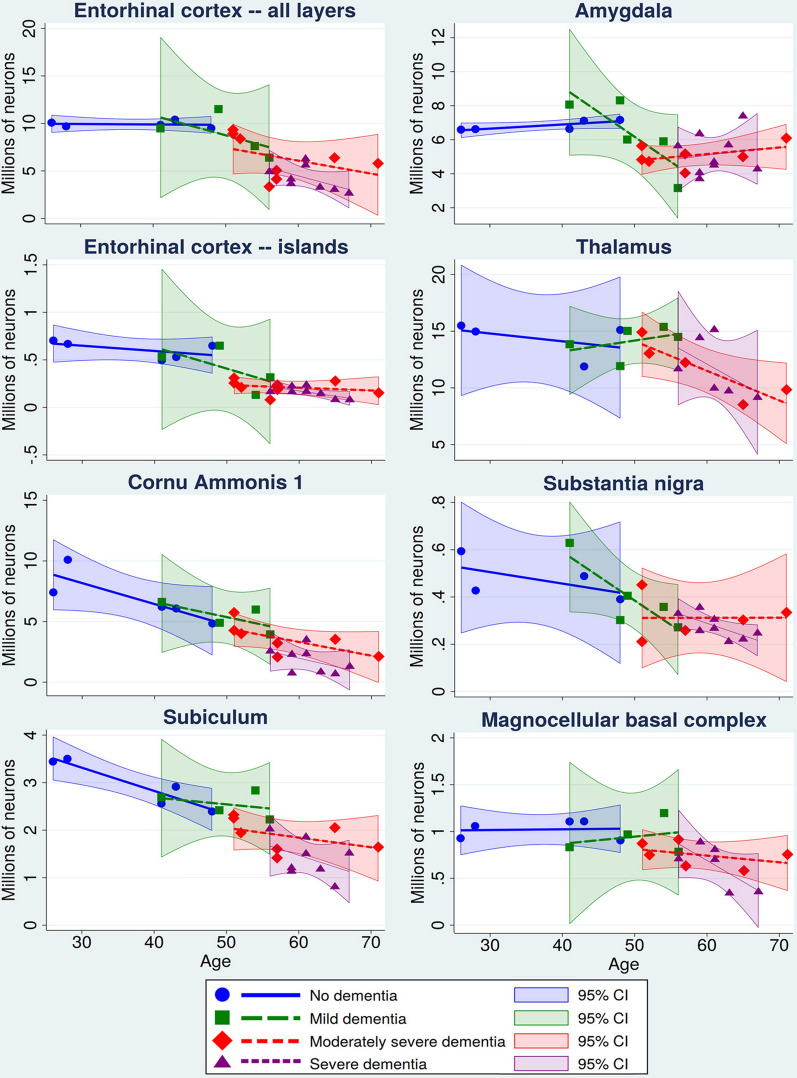
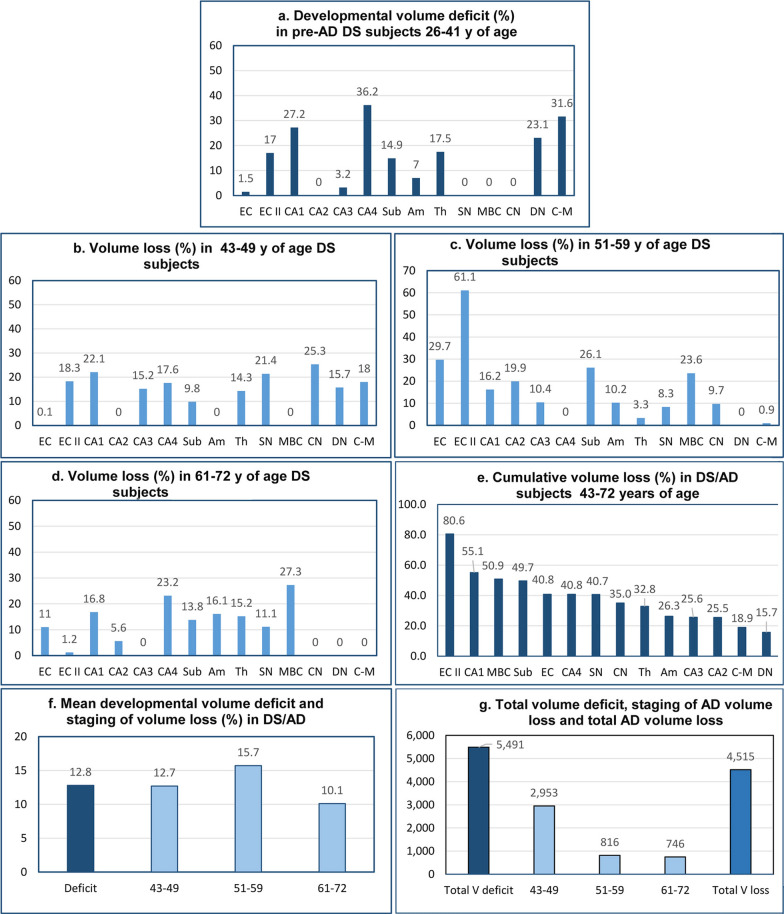
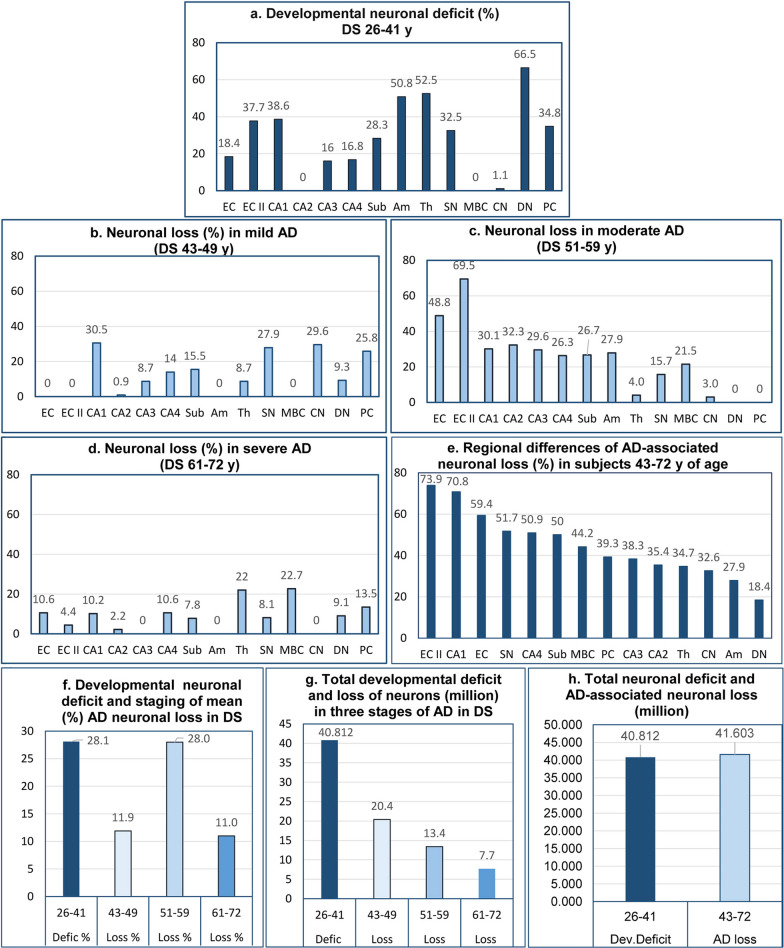
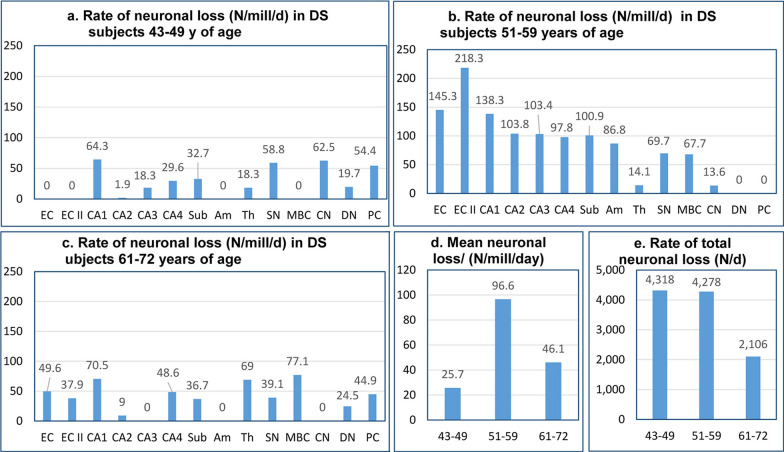
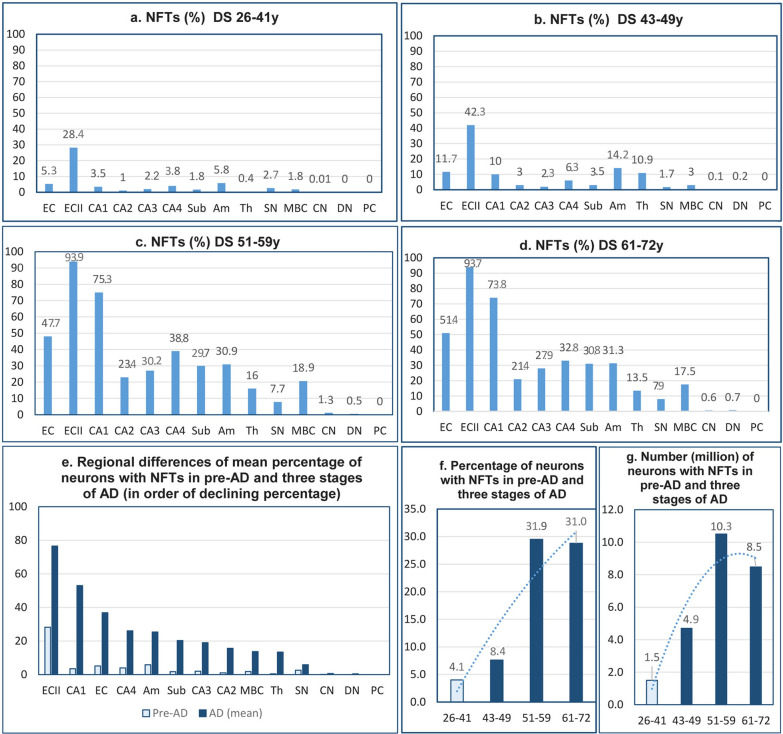
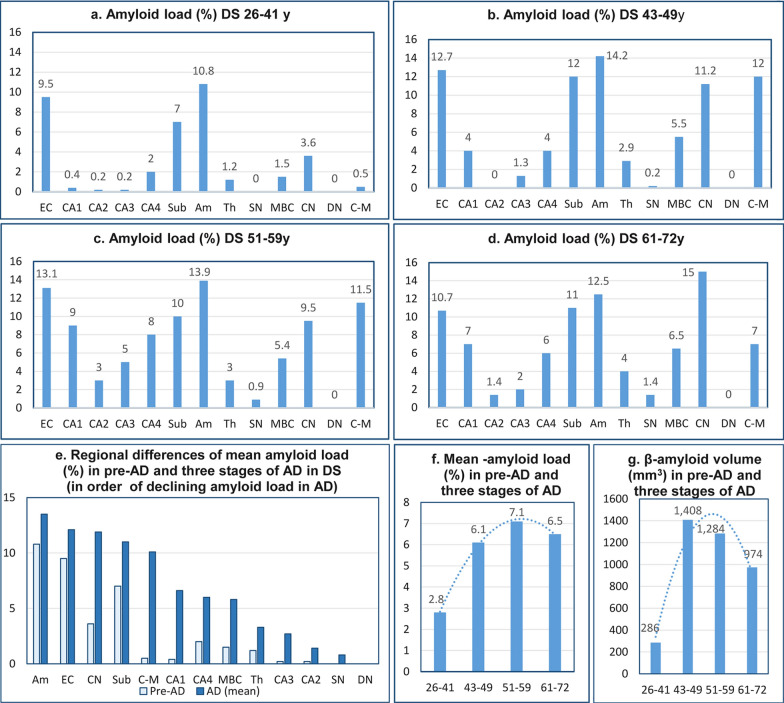
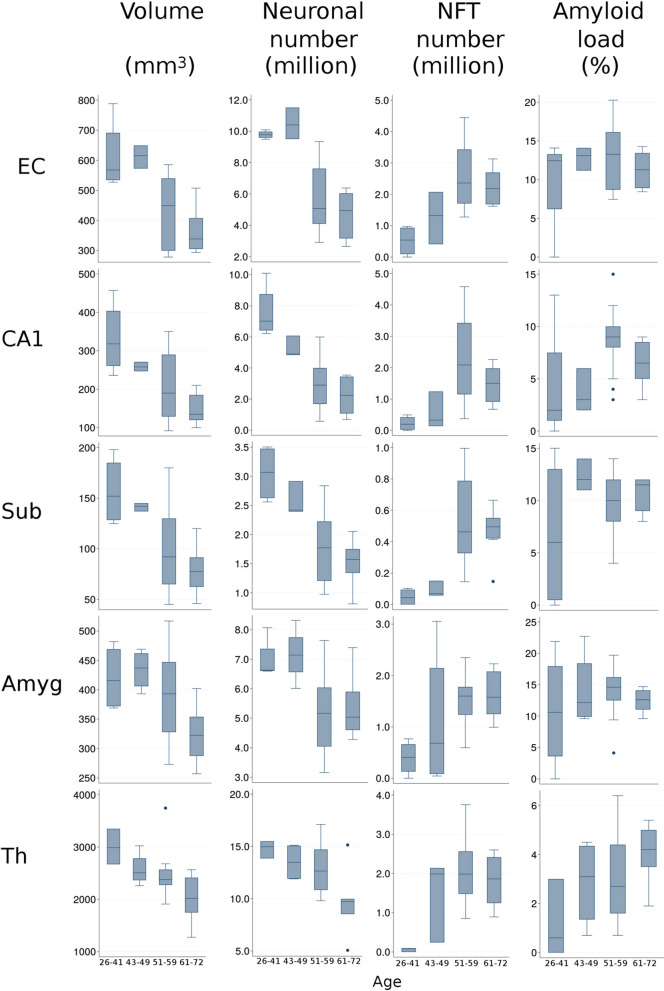
The increased life expectancy of individuals with Down syndrome (DS) is associated with increased prevalence of trisomy 21-linked early-onset Alzheimer's disease (EOAD) and dementia. The aims of this study of 14 brain regions including the entorhinal cortex, hippocampus, basal ganglia, and cerebellum in 33 adults with DS 26-72 years of age were to identify the magnitude of brain region-specific developmental neuronal deficits contributing to intellectual deficits, to apply this baseline to identification of the topography and magnitude of neurodegeneration and neuronal and volume losses caused by EOAD, and to establish age-based staging of the pattern of genetically driven neuropathology in DS. Both DS subject age and stage of dementia, themselves very strongly correlated, were strong predictors of an AD-associated decrease of the number of neurons, considered a major contributor to dementia. The DS cohort was subclassified by age as pre-AD stage, with 26-41-year-old subjects with a full spectrum of developmental deficit but with very limited incipient AD pathology, and 43-49, 51-59, and 61-72-year-old groups with predominant prevalence of mild, moderately severe, and severe dementia respectively. This multiregional study revealed a 28.1% developmental neuronal deficit in DS subjects 26-41 years of age and 11.9% AD-associated neuronal loss in DS subjects 43-49 years of age; a 28.0% maximum neuronal loss at 51-59 years of age; and a 11.0% minimum neuronal loss at 61-72 years of age. A total developmental neuronal deficit of 40.8 million neurons and AD-associated neuronal loss of 41.6 million neurons reflect a comparable magnitude of developmental neuronal deficit contributing to intellectual deficits, and AD-associated neuronal loss contributing to dementia. This highly predictable pattern of pathology indicates that successful treatment of DS subjects in the fourth decade of life may prevent AD pathology and functional decline.

Keywords: Alzheimer’s disease; Clinicopathological staging; Developmental neuronal deficits; Down syndrome; Lewy bodies; Neurofibrillary degeneration; Neuronal loss; Stereology; TDP-43 neurodegeneration; β-amyloidosis.


Conflict of interest statement

The authors declare that they have no competing interests.

Figures

Fig. 1
Fig. 1
Braak staging of neurofibrillary degeneration and Thal staging of β-amyloidosis. Examination of serial equidistant coronal sections stained with mAb Tau-1 detecting NFTs revealed that topographic expansion of neurofibrillary degeneration in subjects with DS results in progression from Braak stage I in 25- and 26-year-old subjects to stage VI in all subjects 51 years of age and older. The pattern of amyloid plaque distribution corresponds to Thal phase 5 in all subjects 28 years of age and older. Observed pattern reflects completion of topographic expansion at the beginning of fourth decade
Fig. 2
Fig. 2
Immunostaining with mAb 4G8 detecting β amyloid in plaques and mAb Tau-1 detecting abnormally phosphorylated tau protein in NFTs illustrates staging of β amyloidosis and neurofibrillary degeneration in four individuals with Down syndrome including 28 years old subject with no signs of dementia, Braak stage I with a few NFTs in the entorhinal cortex but significant β amyloidosis in the entorhinal cortex, hippocampus, temporal, and cerebellar cortex corresponding to final Thal phase 5. Progression of neurofibrillary degeneration observed in 41-year-old DS subject with no signs of dementia (Braak stage IV and Thal phase 5), and in 54-year-old DS subject with mild dementia (Braak stage VI and Thal phase 5), reflects topographic expansion and more severe neurofibrillary degeneration and β amyloidosis in the entorhinal cortex, hippocampus, and temporal cortex. Severe β amyloidosis affects molecular layer of the cerebellar cortex in 41- and 54-year-old subjects. In 65-year-old DS subject diagnosed with moderate severe dementia the number of neurons, including neurons with NFTs, and amyloid load in the temporal and cerebellar cortex decrease but pathology still meets criteria for diagnosis of Braak stage VI and Thal phase 5
Fig. 3
Fig. 3
Correlations between age and stage of dementia and declining number of neurons. The panel of regression analysis-based graphs reveals that both stage of dementia and age are equally strong predictors of the decreasing number of neurons in the entorhinal cortex, CA1, subiculum, amygdala, and thalamus in the DS/AD cohort. Staging of dementia: 0—no signs; 1—mild, 2- moderately severe; 3—severe
Fig. 4
Fig. 4
Interactions of age and stage of dementia. Interactions are illustrated by a combination of scatterplots of age-associated decline in neuronal number and segmentation of the period from 26 to 72 years of age with staging of dementia in the DS cohort, including subjects with no signs of dementia and with mild, moderately severe, and severe dementia. Each of the four stages is defined by a regression-fitted line and a 95% confidence interval. Interactions are demonstrated in the entorhinal cortex (all layers), entorhinal cortex islands of stellate neurons, CA1, subiculum, amygdala, thalamus, substantia nigra and magnocellular basal complex
Fig. 5
Fig. 5
Developmental volume deficits and staging of AD-associated volume loss. Developmental volume deficits in 26- to 41-year-old DS subjects show striking regional differences, with no detectable deficits in four of 14 structures, but with deficits ranging from 1.5% in the entorhinal cortex to 36.2% in CA4 (a). AD-associated volume losses are also region-specific and are more uniform in the fourth decade than in the fifth and sixth decades (b-d). Cumulative volume loss reveals a gradient of susceptibility to regional atrophy, with ECII, CA1, and MBC the most affected (e). The mean developmental volume deficit in 14 examined structures (12.8%) is similar to mean volume losses in each of three stages of AD (f). The total developmental volume deficit (5,491 mm3) exceeds insignificantly the total volume loss (4,515 mm3) produced by three decades of AD pathology (g)
Fig. 6
Fig. 6
Developmental neuronal deficits and staging of AD-associated neuronal loss. Graphs characterize region-specific developmental neuronal deficits (a) as well as region-specific neuronal loss in the fourth, fifth, and sixth decades of life of DS subjects (b, c, d, respectively). Cumulative neuronal loss reveals the gradient of different susceptibilities to neurodegeneration and neuronal death reflected in neuronal losses, ranging from 18.4% in the dentate nucleus to 73.9% in the second layer of the entorhinal cortex (e). Developmental deficit of neurons in examined structures is estimated as 28.1%, whereas percentage of lost neurons increases from 11.9% in fourth decade to top level (28.0%) in fifth decade and decreases to bottom level (11.0%) in sixth decade of life of DS subjects (f). The measure of dynamic of AD-associated neuronal loss is the top level of neuronal loss (20.4 million) in the early stage (fourth decade) and the decline of neuronal loss to 13.4 million in the fifth decade and further decline to the lowest level (7.7 million) in the sixth decade (g). Surprisingly, the estimated total developmental deficit of neurons (40.8 million) contributing to developmental intellectual deficits is almost identical with the total neuronal loss (41.6 million) contributing to AD-associated dementia in DS subjects (h)
Fig. 7
Fig. 7
Rate of neuronal loss. The speed of neuronal loss is defined by the estimated rate of neuronal loss per day and the number of lost neurons per million neurons/day. Graphs a-c illustrate regional differences in the rate of neuronal loss in the fourth, fifth, and sixth decades of life, respectively, of DS subjects. b and d reveal the top level of the rate of neuronal loss in the fifth decade. The cumulative rate of neuronal loss (number of lost neurons per day in all examined regions) is similar in the fourth and fifth decades (4,318/day and 4,278/day, respectively) but decreases by half in the sixth decade (2,106/day) (e)
Fig. 8
Fig. 8
Neurofibrillary degeneration. Graphs a-e illustrate regional differences in the percentage of neurons with NFTs and the progression of neurofibrillary degeneration from the incipient stage in pre-AD (26- to 41-year-old DS subjects) to three stages of AD in the fourth, fifth, and sixth decades. Fig. e shows the ratio between the percentage of neurons with NFTs in pre-AD and in AD and the gradient of susceptibility of neurons, with the highest in the entorhinal cortex, cornu Ammonis, subiculum, and amygdala; lower in the MBC, thalamus, and substantia nigra; and marginal in the caudate and dentate nuclei. The general pattern is illustrated in fig. f and g, showing a plateau of the percentage of neurons with NFTs in the fifth and sixth decades. Decrease of the number of neurons with NFTs from 10.3 million in the fifth decade to 8.5 million in the sixth decade is evidence of the death and removal of neurons with NFTs
Fig. 9
Fig. 9
Amyloid load (%). Fig. a shows the onset of amyloidosis in pre-AD with marked amyloid load in the entorhinal cortex, amygdala, and subiculum, and much less in the CN, CA4, MBC, and thalamus. Amyloid load increases in a region-specific range and stabilizes to comparable levels in the fourth, fifth, and sixth decades (b-d, respectively). Graph e illustrates grading of regional susceptibility to β-amyloidosis and shows that the pattern in pre-AD predicts severity of regional amyloidosis in next decades. Fig. f and g show a global pattern of onset and progression of amyloidosis in pre-AD and in the fourth and fifth decades but a decrease of amyloid load (%) and amyloid volume (mm3) in the sixth decade of life of DS subjects
Fig. 10
Fig. 10
Overview of the staging of AD-associated changes of examined structures volume (mm3), number of neurons and NFTs (million), and amyloid load (%) in the entorhinal cortex (EC), cornu Ammonis sector 1 (CA1), subiculum (Sub), amygdala (Amyg), and thalamus (Th) in DS subjects 26–41, 43–49, 51–59, and 61–72 years of age. Graphs illustrate structure-specific staging of brain structures volume and neuronal number decline paralleled with the growth of the number of neurons with NFTs and increase of amyloid load associated with functional decline, including onset and progression of dementia in the fifth/sixth decades of life of subjects with trisomy 21. The upper and lower boundaries of the box represent interquartile range (IQR). The mean value is marked with the horizontal line within the box. The “whiskers” mark the maximal and minimal values unless any data point lies more than 1.5 times the IQR above the 75th percentile or below the 25th percentile. Outliers are marked with dots

References

    1. Amador-Ortiz C, Lin WL, Ahmed Z, Personett D, Davies P, Duara R, et al. TDP-43 immunoreactivity in hippocampal sclerosis and Alzheimer’s disease. Ann Neurol. 2007;61:435–445. doi: 10.1002/ana.21154. - DOI - PMC - PubMed
    1. Amaral DG, Insausti R. Hippocampal formation. In: Paxinos G, editor. The human nervous system. San Diego, CA: Academic Press Inc; 1990. pp. 711–755.
    1. Annus T, Wilson LR, Acosta-Cabronero J, Cardenas-Blanco A, Hong YT, Fryer TD, et al. The Down syndrome brain in the presence and absence of fibrillar β-amyloidosis. Neurobiol Aging. 2017;53:11–19. doi: 10.1016/j.neurobiolaging.2017.01.009. - DOI - PMC - PubMed
    1. Arai T, Mackenzie IR, Hasegawa M, Nonaka T, Niizato K, Tsuchiya K, et al. Phosphorylated TDP-43 in Alzheimer’s disease and dementia with Lewy bodies. Acta Neuropathol. 2009;117:125–136. doi: 10.1007/s00401-008-0480-1. - DOI - PubMed
    1. Ballard C, Mobley W, Hardy J, Williams G, Corbett A. Dementia in Down’s syndrome. Lancet Neurol. 2016;15:622–636. doi: 10.1016/S1474-4422(16)00063-6. - DOI - PubMed

Publication types