. 2022 Jan 4;42(1):1.
doi: 10.1186/s41232-021-00188-1.

Facilitation of colonic T cell immune responses is associated with an exacerbation of dextran sodium sulfate-induced colitis in mice lacking microsomal prostaglandin E synthase-1

Affiliations

Facilitation of colonic T cell immune responses is associated with an exacerbation of dextran sodium sulfate-induced colitis in mice lacking microsomal prostaglandin E synthase-1

Fumiaki Kojima et al. Inflamm Regen. .

Abstract

Background: Microsomal prostaglandin E synthase-1 (mPGES-1) is a key enzyme that acts downstream of cyclooxygenase and plays a major role in inflammation by converting prostaglandin (PG) H2 to PGE2. The present study investigated the effect of genetic deletion of mPGES-1 on the development of immunologic responses to experimental colitis induced by dextran sodium sulfate (DSS), a well-established model of inflammatory bowel disease (IBD).

Methods: Colitis was induced in mice lacking mPGES-1 (mPGES-1-/- mice) and wild-type (WT) mice by administering DSS for 7 days. Colitis was assessed by body weight loss, diarrhea, fecal bleeding, and histological features. The colonic expression of mPGES-1 was determined by real-time PCR, western blotting, and immunohistochemistry. The impact of mPGES-1 deficiency on T cell immunity was determined by flow cytometry and T cell depletion in vivo.

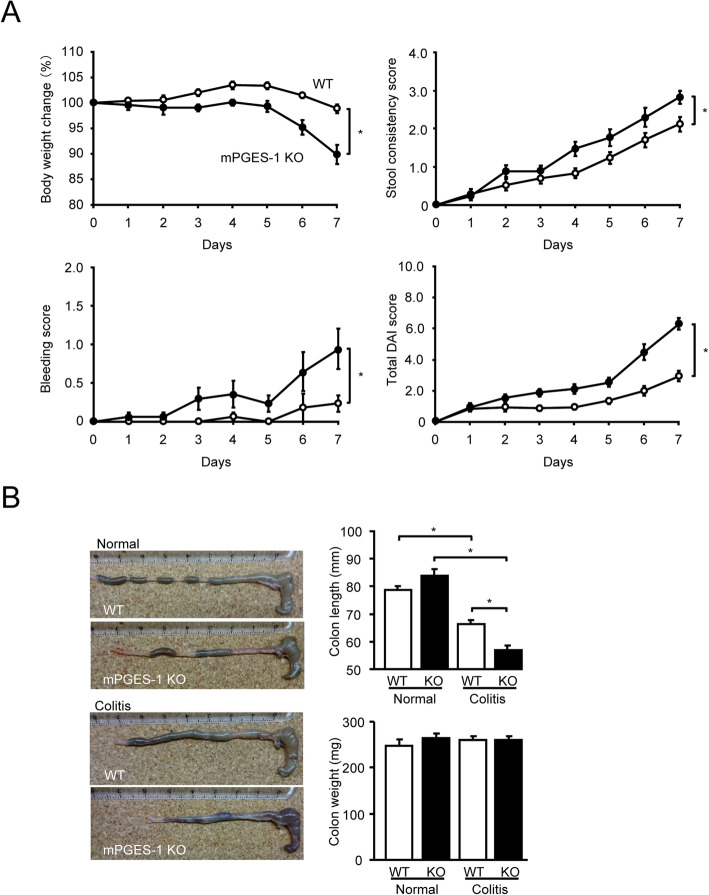
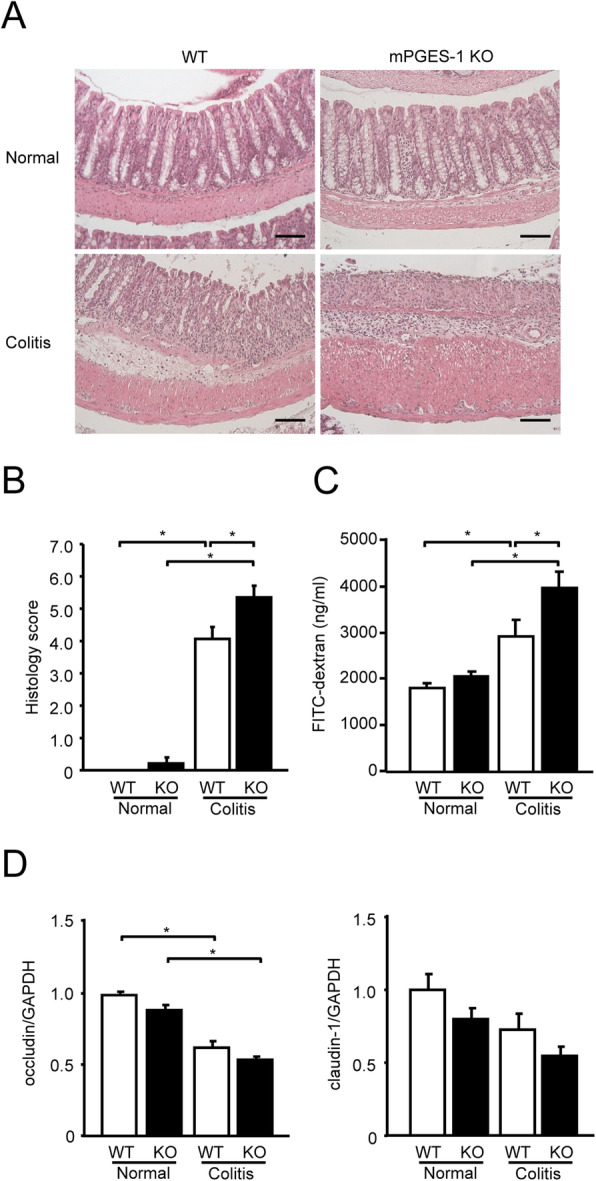
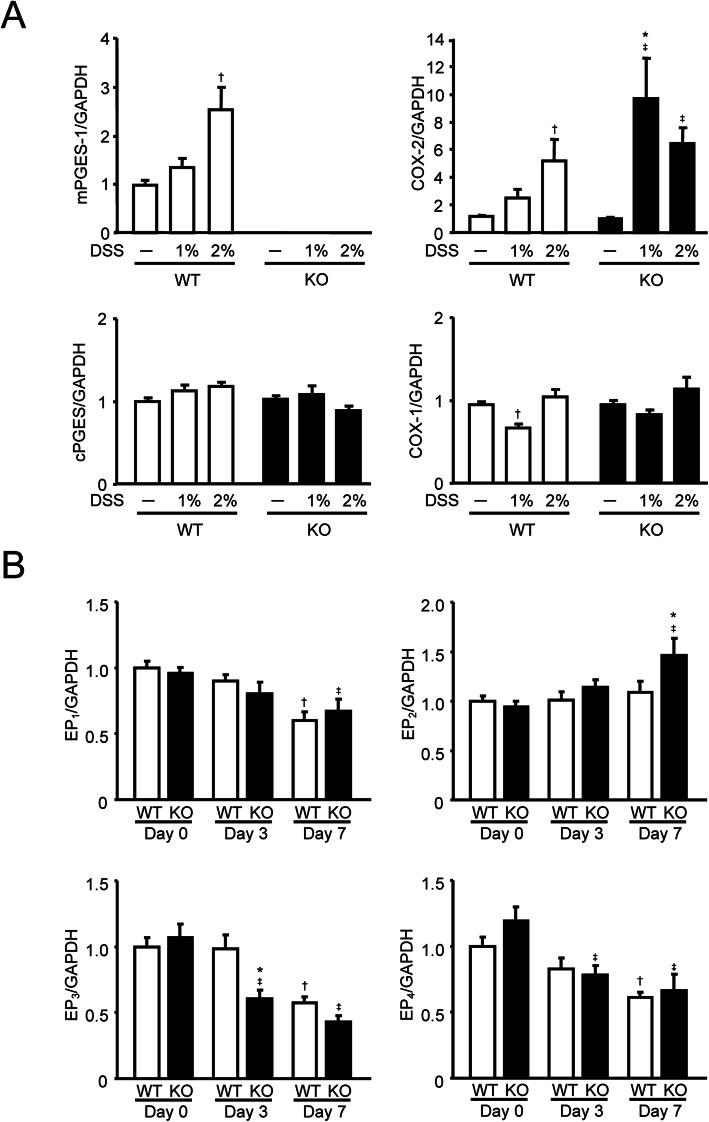
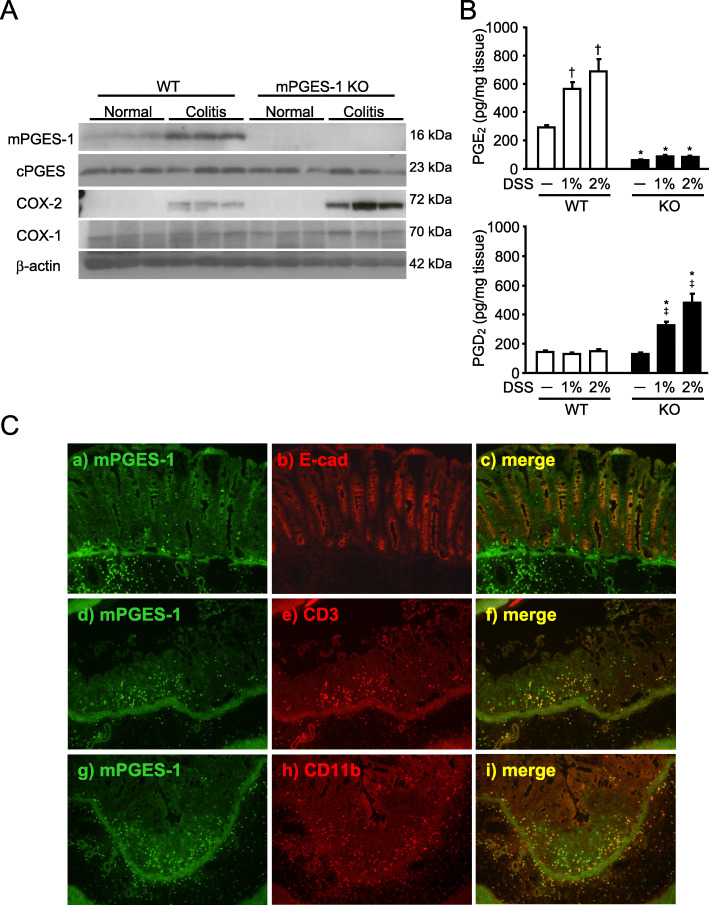
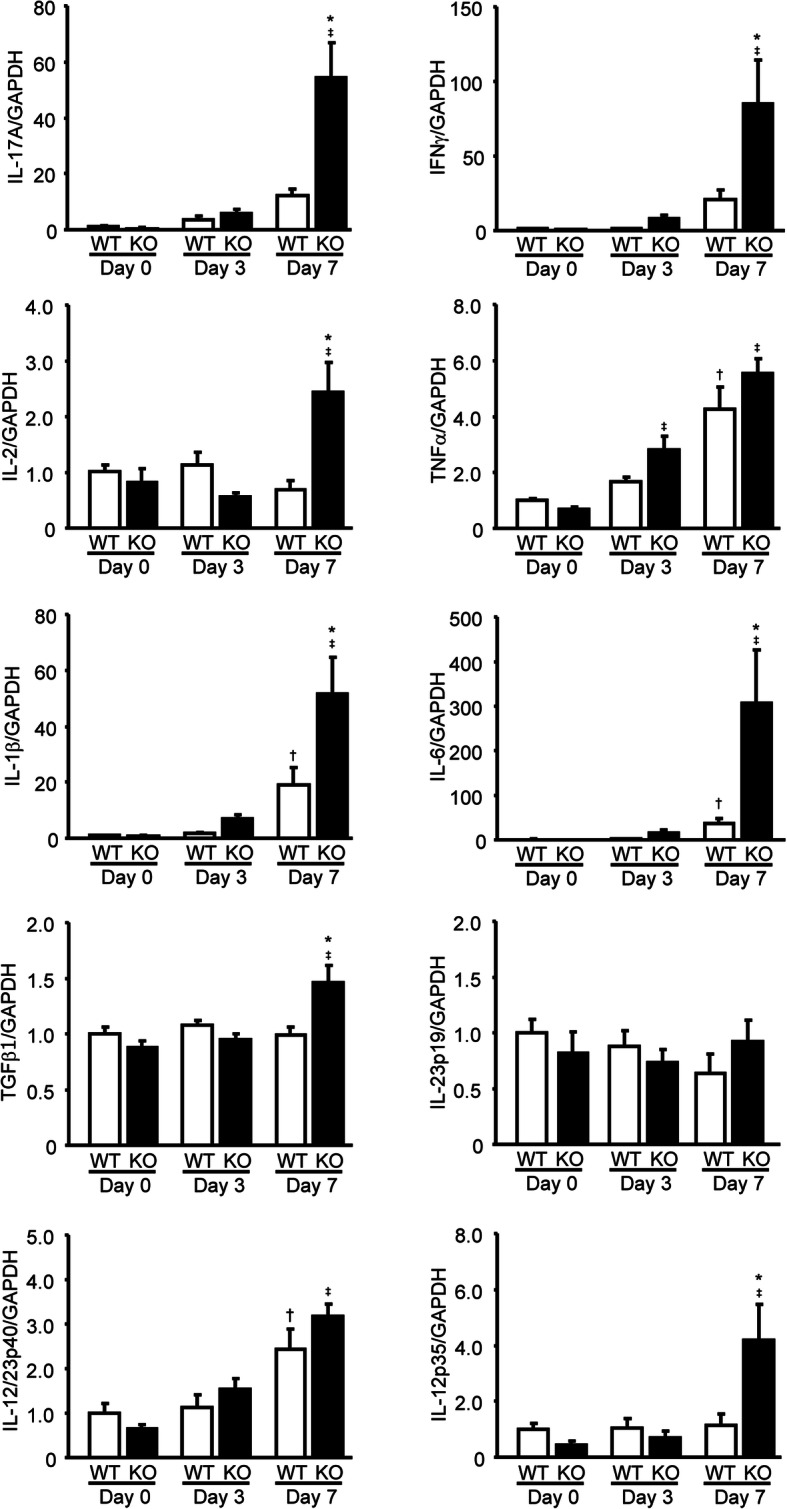
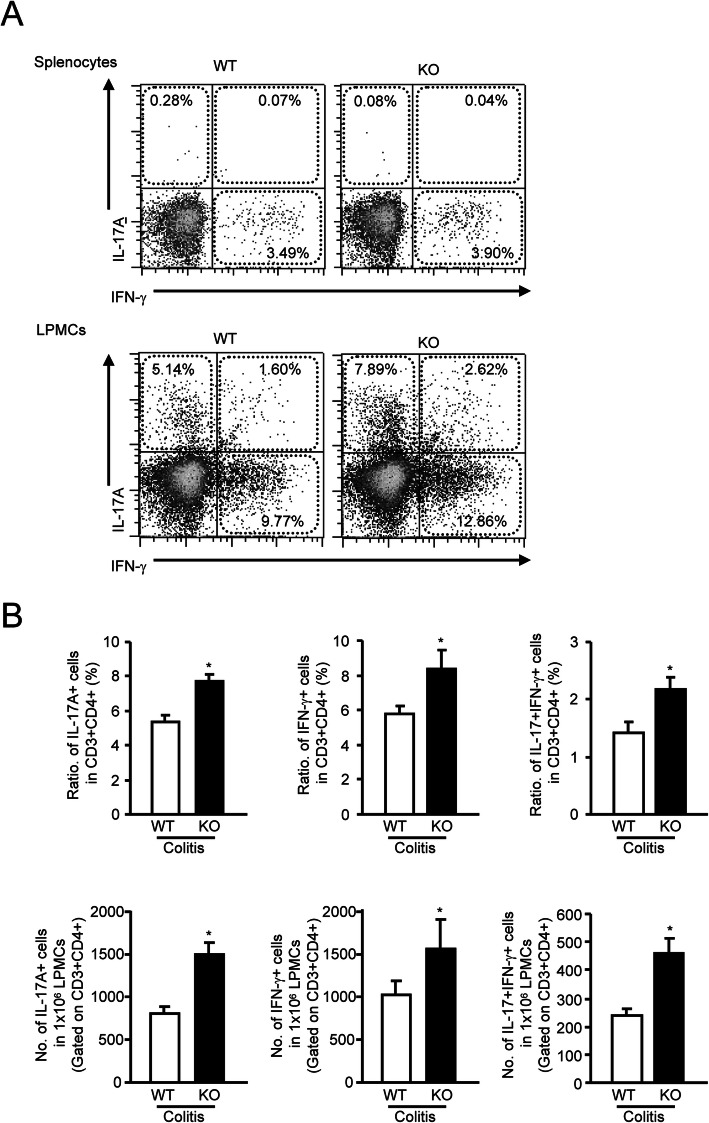
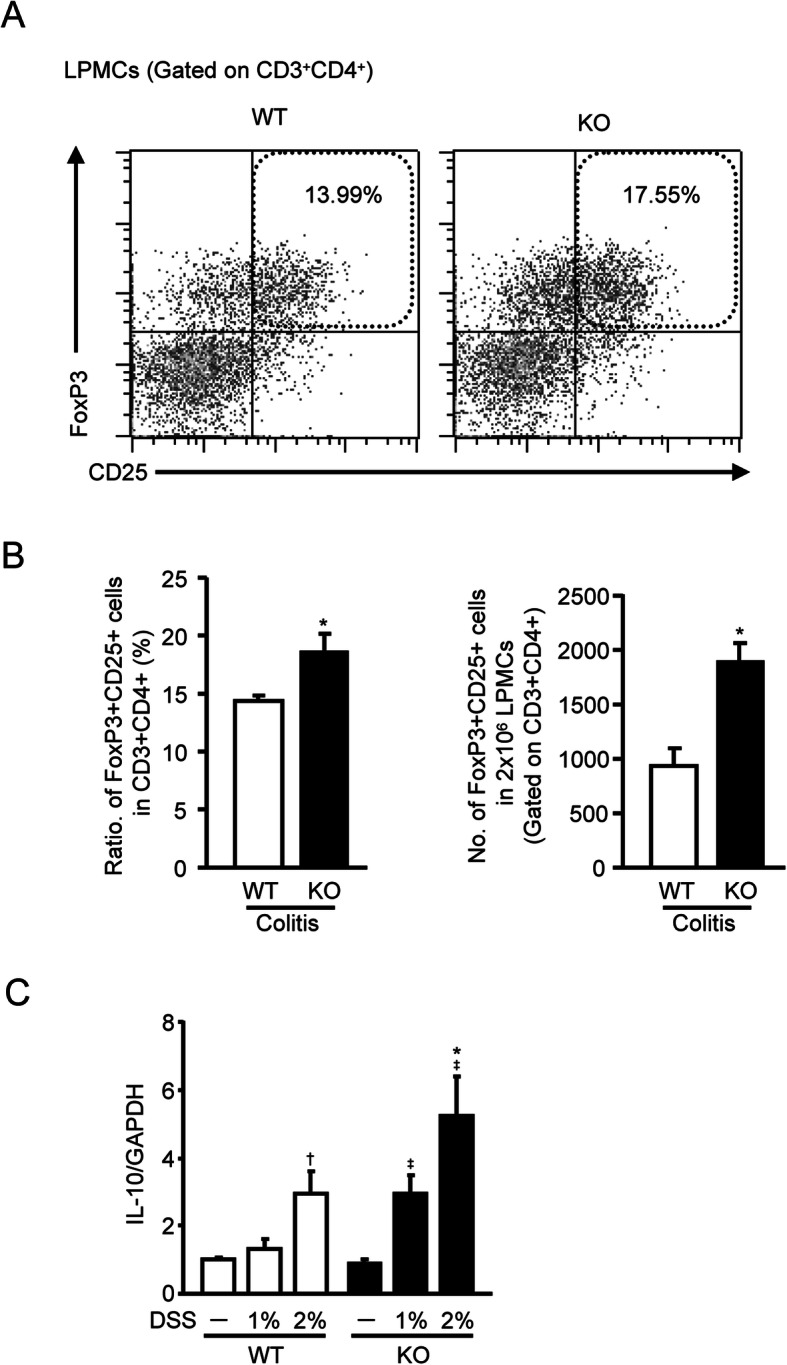
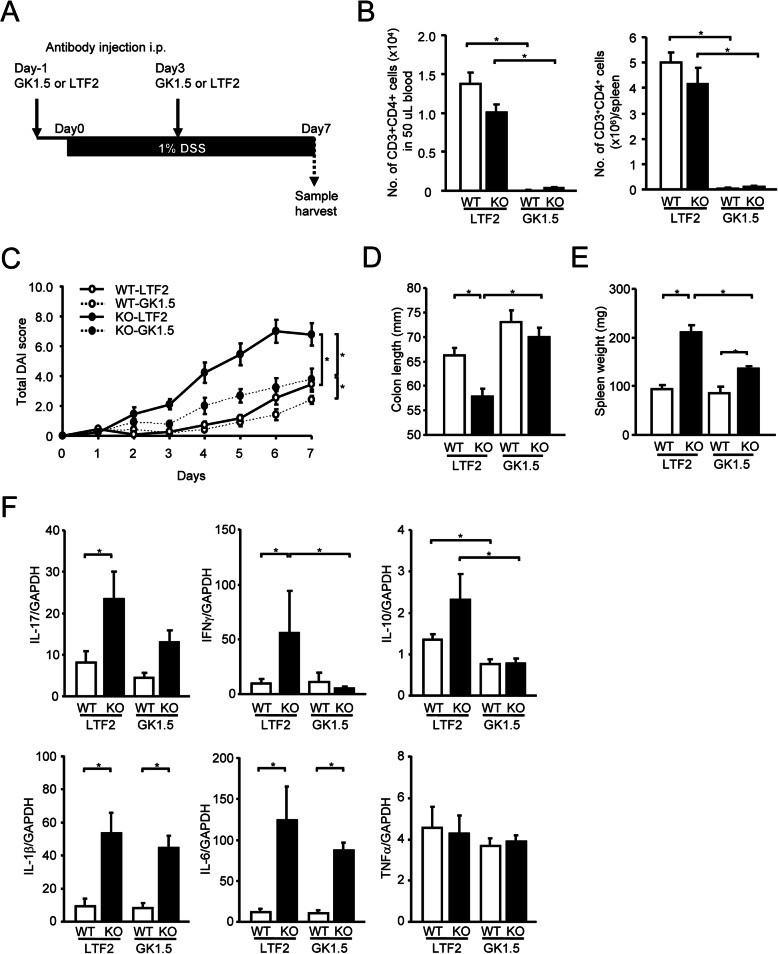
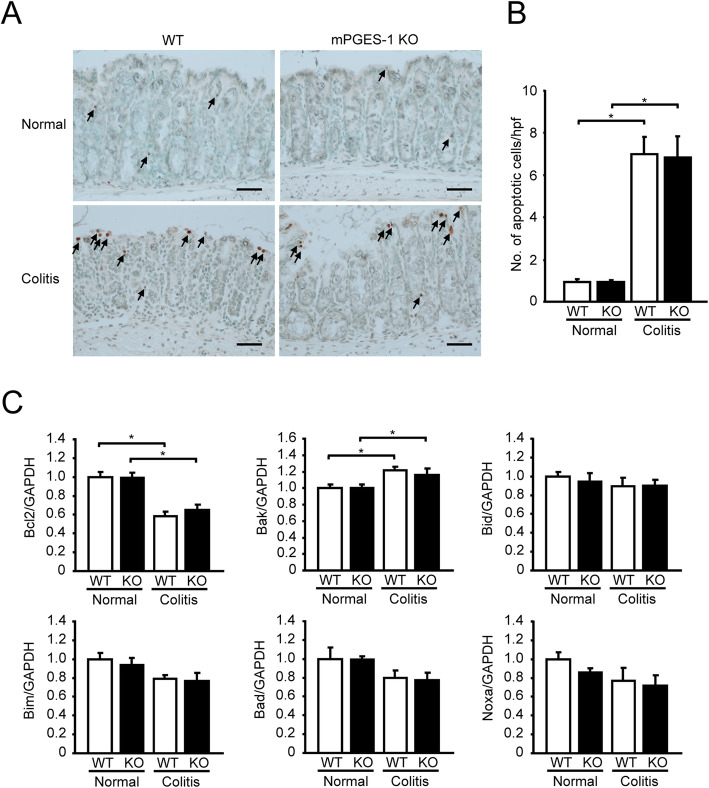
Results: After administration of DSS, mPGES-1-/- mice exhibited more severe weight loss, diarrhea, and fecal bleeding than WT mice. Histological analysis further showed significant exacerbation of colonic inflammation in mPGES-1-/- mice. In WT mice, the colonic expression of mPGES-1 was highly induced on both mRNA and protein levels and colonic PGE2 increased significantly after DSS administration. Additionally, mPGES-1 protein was localized in the colonic mucosal epithelium and infiltrated inflammatory cells in underlying connective tissues and the lamina propria. The abnormalities consistent with colitis in mPGES-1-/- mice were associated with higher expression of colonic T-helper (Th)17 and Th1 cytokines, including interleukin 17A and interferon-γ. Furthermore, lack of mPGES-1 increased the numbers of Th17 and Th1 cells in the lamina propria mononuclear cells within the colon, even though the number of suppressive regulatory T cells also increased. CD4+ T cell depletion effectively reduced symptoms of colitis as well as colonic expression of Th17 and Th1 cytokines in mPGES-1-/- mice, suggesting the requirement of CD4+ T cells in the exacerbation of DSS-induced colitis under mPGES-1 deficiency.

Conclusions: These results demonstrate that mPGES-1 is the main enzyme responsible for colonic PGE2 production and deficiency of mPGES-1 facilitates the development of colitis by affecting the development of colonic T cell-mediated immunity. mPGES-1 might therefore impact both the intestinal inflammation and T cell-mediated immunity associated with IBD.

Keywords: Colitis; Cyclooxygenase; Cytokine; Immunity; Inflammatory bowel disease; Prostaglandin E synthase; Prostaglandin E2; Th17 and Th1 response.


Conflict of interest statement

The authors declare that they have no competing interest regarding the publication of this paper.

Figures

Fig. 1
Fig. 1
Clinical course of DSS-induced colitis in mice with a mPGES-1 genetic deletion. A Time course of change in body weight, stool consistency, bleeding score, and total disease activity index (DAI) score of WT and mPGES-1−/− mice after indicated days of exposure to 1% DSS (n = 17). B On day 7 after the start of exposure to 1% DSS, the length and weight of the colon were measured as an indirect marker of inflammation (n = 3 to 17). Pictures of the colon are representative examples in WT and mPGES-1−/− mice. *P < 0.05; 2-way ANOVA followed by Tukey multiple comparison test
Fig. 2
Fig. 2
Histological analysis of DSS-induced colitis in mPGES-1−/− mice. A Colons of mPGES-1 WT and mPGES-1−/− mice were collected on day 7 after the start of exposure to 1% DSS, and sections were stained with H&E. Results are representative examples adapted with the Swiss roll technique in WT and mPGES-1−/− mice (n = 5 to 17). Scale bar, 100 μm. B Histological scores in WT and mPGES-1−/− mice (n = 5 to 17). Colon sections were examined by a blinded researcher, who calculated the epithelial damage score and inflammatory infiltration score and summed the 2 scores (maximum score: 8). C Intestinal permeability was assessed with FITC-dextran on day 7 after the start of exposure to 1% DSS (n = 9 to 17). *P < 0.05; 2-way ANOVA followed by Tukey multiple comparison test. D Expression of mRNA for the tight junction molecules occludin and claudin-1 in colon from mice treated or not treated with 1% DSS for 7 days were analyzed by real-time RT-PCR. Levels of mRNA expression are shown as the fold induction relative to the expression in WT mice without DSS administration (assigned the value “1”). *P < 0.05; 2-way ANOVA followed by Tukey multiple comparison test (n = 7 to 10)
Fig. 3
Fig. 3
Analysis of splenomegaly and anemia in mPGES-1−/− mice. A Spleen was isolated, imaged and weighed on day 7 after the start of exposure to 1% DSS. B Also on day 7, morphological analysis of the spleen was performed by H&E staining. Representative images are shown. Scale bar, 500 μm. C Erythrocyte count, hemoglobin (HGB) concentration, and hematocrit (HCT) in the peripheral blood were measured on day 7 after the start exposure to 1% DSS. *P < 0.05; 2-way ANOVA followed by Tukey multiple comparison test (n = 3 to 17)
Fig. 4
Fig. 4
Expressions of mRNA for PGE2 biosynthetic enzymes and EP receptor subtypes in colon after exposure to DSS. A Expression of mRNA for PGES and COX isozymes in colon from mice treated or not treated with the indicated dose of DSS for 7 days were analyzed by real-time RT-PCR (n = 7 to 12). Levels of mRNA expression are shown as the fold induction relative to the expression in WT mice without DSS administration (assigned the value “1”). *P < 0.05 vs WT mice within each day, P < 0.05 vs non-DSS-treated WT mice, and P < 0.05 vs non-DSS-treated KO mice; 2-way ANOVA followed by Tukey multiple comparison test. B Expression of EP receptor mRNA in colon from mice treated with 1% DSS for indicated days was analyzed by real-time RT-PCR (n = 7 to 10). Levels of mRNA expression are shown as the fold induction relative to day 0 expression in WT (assigned the value “1”). *P < 0.05 vs WT mice within each day, P < 0.05 vs WT at day 0, and P < 0.05 vs KO mice at day 0; 2-way ANOVA followed by Tukey multiple comparison test
Fig. 5
Fig. 5
mPGES-1 protein expression and prostanoid production in the colon with colitis by DSS. A Expression of protein for PGES and COX isozymes in colon on day 7 after the start of exposure to 1% DSS were analyzed by western blot analysis (n = 3). B The levels of PGE2 and PGD2 in the colon from mice treated or not treated with the indicated dose of DSS for 7 days were measured by ELISA. *P < 0.05 vs WT mice within each day, P < 0.05 vs non-DSS-treated WT mice, and P < 0.05 vs non-DSS-treated KO mice; 2-way ANOVA followed by Turkey multiple comparison test (n = 3 to 5). C Representative double immunofluorescence staining image of Swiss-roll colon sections of WT mice on day 7 after the start of exposure to 1% DSS. Double staining for mPGES-1 (green) and E-cadherin, CD3 or CD11b (red) showed mPGES-1 immunoreactivity mostly colocalized with an epithelial cell marker, E-cadherin, a T cell marker CD3 and a monocytes/macrophage marker CD11b in the colon
Fig. 6
Fig. 6
Colonic expression profile of Th17/Th1-related cytokines in mPGES-1−/− mice with DSS-induced colitis. Expressions of mRNA for IL-17A, IFNγ, IL-2, TNFα, IL-1β, IL-6, TGFβ1, IL-23p19, IL-12/23p40, and IL-12p35 in colon from mice treated with 1% DSS for indicated days were analyzed by real-time RT-PCR (n = 7 to 10). Levels of mRNA expression are shown as the fold induction relative to day 0 expression in WT mice (assigned the value “1”). *P < 0.05 vs WT mice within each day, P < 0.05 vs non-DSS-treated WT mice, and P < 0.05 vs non-DSS-treated KO mice; 2-way ANOVA followed by Tukey multiple comparison test
Fig. 7
Fig. 7
Generation of IL-17A- and IFNγ-producing T cells in colonic LPMCs and splenocytes of mPGES-1−/− mice with DSS-induced colitis. A Representative FCM plot of IL-17A-producing Th17 cells and IFNγ-producing Th1 cells in CD3+CD4+ T cells of splenocytes and colonic LPMCs isolated from WT and mPGES-1−/− mice with colitis. Colonic LPMCs were pooled from 4 mice in each experiment on day 7 after the start of exposure to 1% DSS and analyzed by FCM, as described in the Methods (n = 5). B The ratio and the number of IL-17A+ and IFNγ+ cells in CD3+CD4+ T cells of colonic LPMCs on day 7 after the start of exposure to 1% DSS (n = 5). *P < 0.05 vs WT; t test
Fig. 8
Fig. 8
Effect of mPGES-1 gene deletion on the generation of Tregs in DSS-induced colitis. A Representative FCM plot of FoxP3+CD25+ Tregs in CD3+CD4+ T cells of colonic LPMCs, isolated from WT and mPGES-1−/− mice with colitis. Colonic LPMCs were pooled from 4 mice in each experiment on day 7 after the start of exposure to 1% DSS and subjected to FCM analysis, as described in the Methods (n = 5). B The ratio and the number of FoxP3+CD25+ cells in CD3+CD4+ T cells of colonic LPMCs on day 7 after the start of exposure to 1% DSS (n = 5). C Expression of mRNA for IL-10 in the colon from mice treated or not treated with the indicated dose of DSS for 7 days was analyzed by real-time RT-PCR. Levels of mRNA expression are shown as the fold induction relative to the expression in WT without DSS administration (assigned the value “1”). *P < 0.05 vs WT within each day, P < 0.05 vs non-DSS-treated WT mice, and P < 0.05 vs non-DSS-treated KO mice; 2-way ANOVA followed by Tukey multiple comparison test (n = 7 to 12)
Fig. 9
Fig. 9
Effect of CD4 positive T cell depletion on the exacerbated DSS-induced colitis in mPGES-1−/− mice. A Schematic representation of the experimental plan. B The efficacy of in vivo CD4+ T cell depletion was confirmed by flow cytometry analysis of T cell population in the peripheral blood and spleen (n = 9 to 11). C Time course of change in total disease activity index (DAI) score of WT and mPGES-1−/− mice after indicated days of exposure to 1% DSS (n = 9 to 11). On day 7 after the start of exposure to 1% DSS, the length of the colon (D) and weight of the spleen (E) were measured as indirect markers of inflammation (n = 9 to 11). F Expressions of mRNA for IL-17A, IFNγ, IL-10, IL-1β, IL-6, and TNFα in colon from mice treated with 1% DSS for 7 days were analyzed by real-time RT-PCR (n = 9 to 11). Levels of mRNA expression are shown as the fold induction relative to the expression in WT mice without DSS administration (assigned the value “1”). *P < 0.05; 2-way ANOVA followed by Tukey multiple comparison test
Fig. 10
Fig. 10
Analysis of apoptosis in mPGES-1−/− colons. A Representative images of Swiss-roll colon sections on day 7 after the start of exposure to 1% DSS. Arrows indicate apoptotic cells. Scale bar, 50 μm. B Quantification of apoptotic cells in colon (n = 5). C mRNA expressions of an anti-apoptotic factor Bcl2 and apoptotic markers, Bak, Bid, Bim, Bad, and Noxa, in colon from mice treated with 1% DSS for 7 days were analyzed by real-time RT-PCR (n = 7 to 10). Levels of mRNA expression are shown as the fold induction relative to the expression in WT mice without DSS administration (assigned the value “1”). *P < 0.05; 2-way ANOVA followed by Tukey multiple comparison test

Similar articles

Cited by

References

    1. Ananthakrishnan AN. Epidemiology and risk factors for IBD. Nat Rev Gastroenterol Hepatol. 2015;12(4):205–217. doi: 10.1038/nrgastro.2015.34. - DOI - PubMed
    1. Guan Q. A comprehensive review and update on the pathogenesis of inflammatory bowel disease. J Immunol Res. 2019;2019:1–16. doi: 10.1155/2019/7247238. - DOI - PMC - PubMed
    1. Friedrich M, Pohin M, Powrie F. Cytokine networks in the pathophysiology of inflammatory bowel disease. Immunity. 2019;50(4):992–1006. doi: 10.1016/j.immuni.2019.03.017. - DOI - PubMed
    1. Lee SH, Kwon JE, Cho ML. Immunological pathogenesis of inflammatory bowel disease. Intest Res. 2018;16(1):26–42. doi: 10.5217/ir.2018.16.1.26. - DOI - PMC - PubMed
    1. Kojima F, Kapoor M, Kawai S, Crofford LJ. New insights into eicosanoid biosynthetic pathways: implications for arthritis. Expert Rev Clin Immunol. 2006;2(2):277–291. doi: 10.1586/1744666X.2.2.277. - DOI - PubMed