. 2022 Apr 14;28(8):1651-1661.
doi: 10.1158/1078-0432.CCR-21-2855.

Metabolomic Biomarkers in Blood Samples Identify Cancers in a Mixed Population of Patients with Nonspecific Symptoms

Affiliations

Metabolomic Biomarkers in Blood Samples Identify Cancers in a Mixed Population of Patients with Nonspecific Symptoms

James R Larkin et al. Clin Cancer Res. .

Abstract

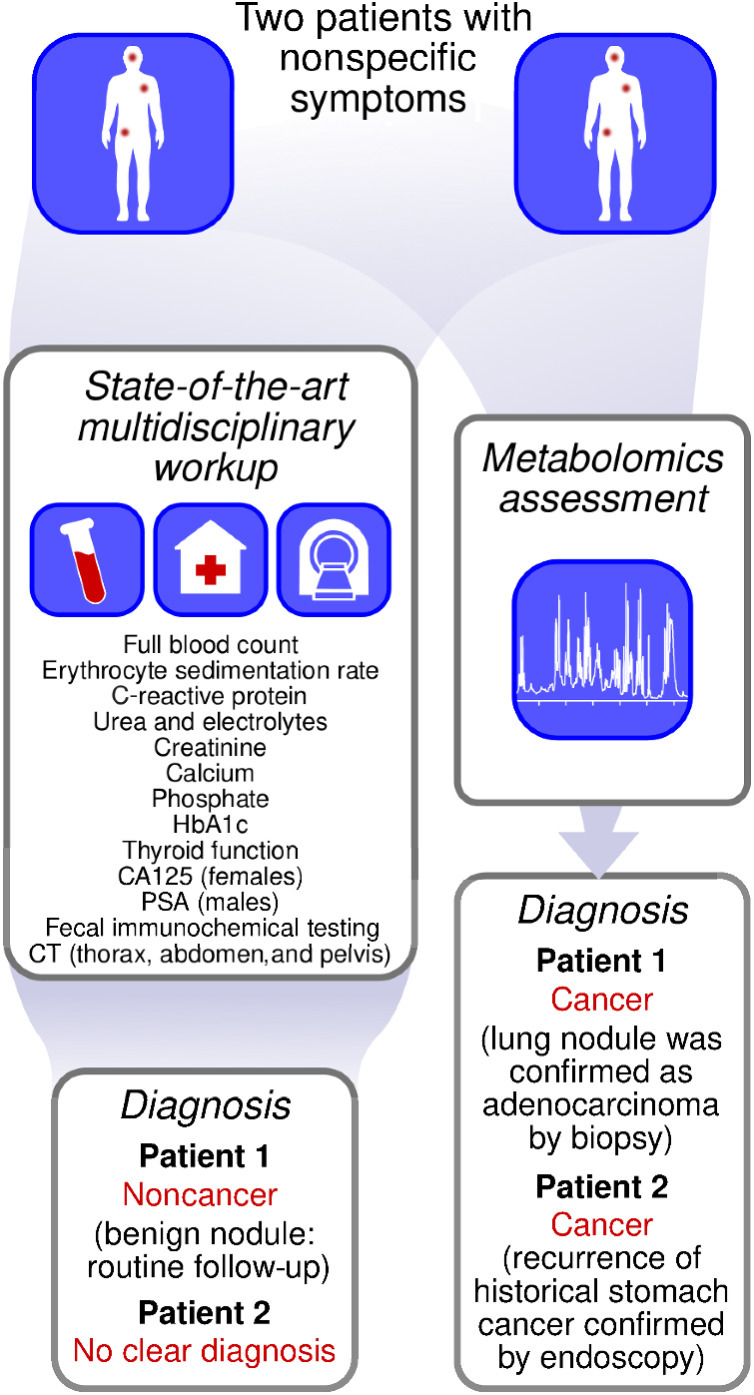
Purpose: Early diagnosis of cancer is critical for improving patient outcomes, but cancers may be hard to diagnose if patients present with nonspecific signs and symptoms. We have previously shown that nuclear magnetic resonance (NMR) metabolomics analysis can detect cancer in animal models and distinguish between differing metastatic disease burdens. Here, we hypothesized that biomarkers within the blood metabolome could identify cancers within a mixed population of patients referred from primary care with nonspecific symptoms, the so-called "low-risk, but not no-risk" patient group, as well as distinguishing between those with and without metastatic disease.

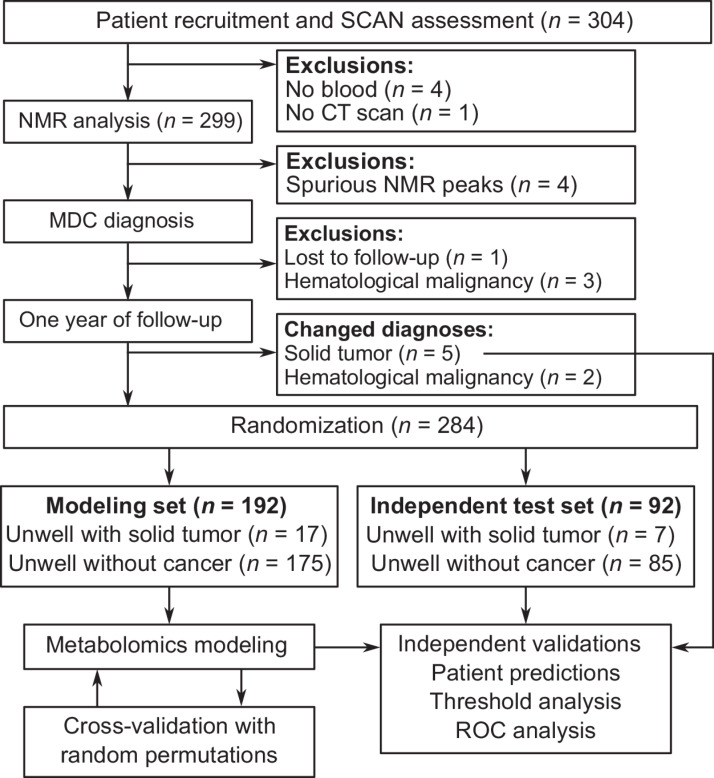
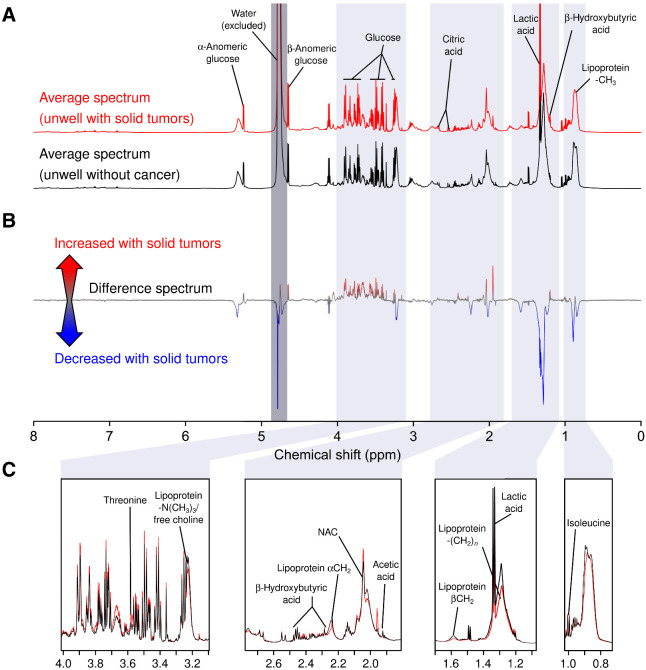
Experimental design: Patients (n = 304 comprising modeling, n = 192, and test, n = 92) were recruited from 2017 to 2018 from the Oxfordshire Suspected CANcer (SCAN) pathway, a multidisciplinary diagnostic center (MDC) referral pathway for patients with nonspecific signs and symptoms. Blood was collected and analyzed by NMR metabolomics. Orthogonal partial least squares discriminatory analysis (OPLS-DA) models separated patients, based upon diagnoses received from the MDC assessment, within 62 days of initial appointment.

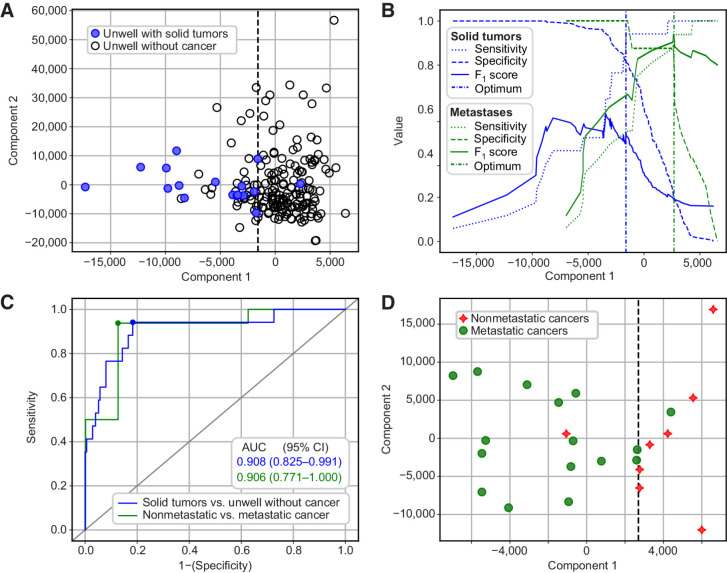
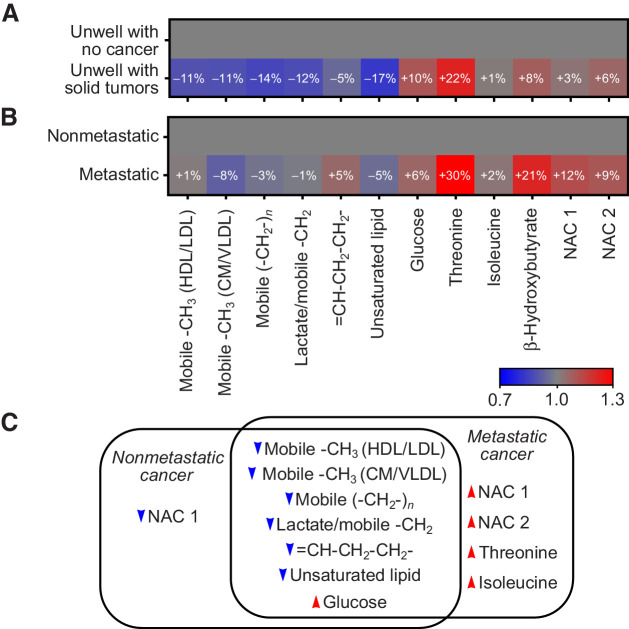
Results: Area under the ROC curve for identifying patients with solid tumors in the independent test set was 0.83 [95% confidence interval (CI): 0.72-0.95]. Maximum sensitivity and specificity were 94% (95% CI: 73-99) and 82% (95% CI: 75-87), respectively. We could also identify patients with metastatic disease in the cohort of patients with cancer with sensitivity and specificity of 94% (95% CI: 72-99) and 88% (95% CI: 53-98), respectively.

Conclusions: For a mixed group of patients referred from primary care with nonspecific signs and symptoms, NMR-based metabolomics can assist their diagnosis, and may differentiate both those with malignancies and those with and without metastatic disease. See related commentary by Van Tine and Lyssiotis, p. 1477.


Figures

Figure 1. Study schematic showing patient recruitment into the study, exclusions, biofluid collection, and confirmed diagnoses.
Figure 1.
Study schematic showing patient recruitment into the study, exclusions, biofluid collection, and confirmed diagnoses.
Figure 2. A, Mean NMR spectra for samples from unwell patients with either confirmed solid tumor diagnoses (red, n = 17) or confirmed noncancer diagnoses (black, n = 175). B, Difference spectrum showing regions that were increased in patients with solid tumors (red), decreased in patients with solid tumors (blue), or unchanged (gray). C, Insets showing magnified regions at points of significant difference between unwell with solid tumor spectra (red) and unwell without cancer spectra (black). NAC, N-acetylated glycoproteins.
Figure 2.
A, Mean NMR spectra for samples from unwell patients with either confirmed solid tumor diagnoses (red, n = 17) or confirmed noncancer diagnoses (black, n = 175). B, Difference spectrum showing regions that were increased in patients with solid tumors (red), decreased in patients with solid tumors (blue), or unchanged (gray). C, Insets showing magnified regions at points of significant difference between unwell with solid tumor spectra (red) and unwell without cancer spectra (black). NAC, N-acetylated glycoproteins.
Figure 3. A, OPLS-DA plot showing separation of unwell patients with solid tumor diagnoses (blue, filled) from unwell patients with noncancer diagnoses (black, open). B, Sensitivity (dots), specificity (dashes), and F1 score (continuous) for solid tumors versus unwell patients without cancer (blue), or metastatic versus nonmetastatic cancers (green) at all possible thresholds of classification according to Component 1. Vertical dashed lines show optimal classification threshold for each model. C, ROC curves for classification between unwell with solid tumors versus unwell without cancer diagnoses (blue line; model in A), and metastatic versus nonmetastatic diagnoses (green line; model in C). Small, colored circles on lines indicate points closest to top-left corner, corresponding to dashed vertical lines in B. D, OPLS-DA plot showing separation of patients with nonmetastatic cancer diagnoses (red stars) or metastatic cancer diagnoses (green circles).
Figure 3.
A, OPLS-DA plot showing separation of unwell patients with solid tumor diagnoses (blue, filled) from unwell patients with noncancer diagnoses (black, open). B, Sensitivity (dots), specificity (dashes), and F1 score (continuous) for solid tumors versus unwell patients without cancer (blue), or metastatic versus nonmetastatic cancers (green) at all possible thresholds of classification according to Component 1. Vertical dashed lines show optimal classification threshold for each model. C, ROC curves for classification between unwell with solid tumors versus unwell without cancer diagnoses (blue line; model in A), and metastatic versus nonmetastatic diagnoses (green line; model in C). Small, colored circles on lines indicate points closest to top-left corner, corresponding to dashed vertical lines in B. D, OPLS-DA plot showing separation of patients with nonmetastatic cancer diagnoses (red stars) or metastatic cancer diagnoses (green circles).
Figure 4. A, Fold changes in key metabolites identified by multivariate analysis concentrations in unwell patients with solid tumors relative to the mean metabolite concentrations in unwell patients without cancer. B, Fold changes in key metabolite concentrations in patients with metastatic cancer, relative to the mean metabolite concentration in patients with nonmetastatic cancer. C, Venn diagram illustrating direction of metabolite concentration changes in metastatic and nonmetastatic cancers, relative to unwell patients without cancer. HDL, high-density lipoprotein. Note that “/” represents that the two metabolites overlap in the NMR data, and not a ratio of the two metabolite concentrations. Individual plots of metabolite concentrations are given in Supplementary Fig. S4.
Figure 4.
A, Fold changes in key metabolites identified by multivariate analysis concentrations in unwell patients with solid tumors relative to the mean metabolite concentrations in unwell patients without cancer. B, Fold changes in key metabolite concentrations in patients with metastatic cancer, relative to the mean metabolite concentration in patients with nonmetastatic cancer. C, Venn diagram illustrating direction of metabolite concentration changes in metastatic and nonmetastatic cancers, relative to unwell patients without cancer. HDL, high-density lipoprotein. Note that “/” represents that the two metabolites overlap in the NMR data, and not a ratio of the two metabolite concentrations. Individual plots of metabolite concentrations are given in Supplementary Fig. S4.
Figure 5. Example patient journeys showing how metabolomics and multidisciplinary diagnostic center workup provided different diagnoses.
Figure 5.
Example patient journeys showing how metabolomics and multidisciplinary diagnostic center workup provided different diagnoses.

Comment in

References

    1. Hawkes N. Cancer survival data emphasise importance of early diagnosis. BMJ 2019;364:l408. - PubMed
    1. World Health Organization. Guide to cancer early diagnosis. World Health Organization; 2017. Available from: https://www.who.int/publications/i/item/guide-to-cancer-early-diagnosis.
    1. Elliss-Brookes L, McPhail S, Ives A, Greenslade M, Shelton J, Hiom S, et al. . Routes to diagnosis for cancer – determining the patient journey using multiple routine data sets. Br J Cancer 2012;107:1220–6. - PMC - PubMed
    1. Porta M, Fernandez E, Belloc J, Malats N, Gallén M, Alonso J. Emergency admission for cancer: a matter of survival? Br J Cancer 1998;77:477–84. - PMC - PubMed
    1. Nicholson BD, Oke J, Friedemann Smith C, Phillips J-A, Lee J, Abel L, et al. . The Suspected CANcer (SCAN) pathway: protocol for evaluating a new standard of care for patients with non-specific symptoms of cancer. BMJ Open 2018;8:e018168. - PMC - PubMed

Publication types