Trawl impacts on the relative status of biotic communities of seabed sedimentary habitats in 24 regions worldwide
- PMID: 34983873
- PMCID: PMC8764683
- DOI: 10.1073/pnas.2109449119
Trawl impacts on the relative status of biotic communities of seabed sedimentary habitats in 24 regions worldwide
Abstract
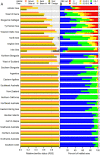
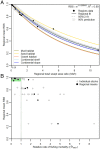
Bottom trawling is widespread globally and impacts seabed habitats. However, risks from trawling remain unquantified at large scales in most regions. We address these issues by synthesizing evidence on the impacts of different trawl-gear types, seabed recovery rates, and spatial distributions of trawling intensity in a quantitative indicator of biotic status (relative amount of pretrawling biota) for sedimentary habitats, where most bottom-trawling occurs, in 24 regions worldwide. Regional average status relative to an untrawled state (=1) was high (>0.9) in 15 regions, but <0.7 in three (European) regions and only 0.25 in the Adriatic Sea. Across all regions, 66% of seabed area was not trawled (status = 1), 1.5% was depleted (status = 0), and 93% had status > 0.8. These assessments are first order, based on parameters estimated with uncertainty from meta-analyses; we recommend regional analyses to refine parameters for local specificity. Nevertheless, our results are sufficiently robust to highlight regions needing more effective management to reduce exploitation and improve stock sustainability and seabed environmental status-while also showing seabed status was high (>0.95) in regions where catches of trawled fish stocks meet accepted benchmarks for sustainable exploitation, demonstrating that environmental benefits accrue from effective fisheries management. Furthermore, regional seabed status was related to the proportional area swept by trawling, enabling preliminary predictions of regional status when only the total amount of trawling is known. This research advances seascape-scale understanding of trawl impacts in regions around the world, enables quantitative assessment of sustainability risks, and facilitates implementation of an ecosystem approach to trawl fisheries management globally.
Keywords: habitat sensitivity; recovery; spatial upscaling; trawl footprints; trawl impacts.
Conflict of interest statement
Competing interest statement: The authors have received funds from a range of sources including governments, foundations, nongovernmental organizations, and industries (see Acknowledgements) that have interests in conservation, sustainable use, and effective fisheries management—which may be perceived as a conflict of interest. However, the authors declare that neither these nor any other interests have directly or indirectly influenced the objectivity of this paper, and the findings and conclusions in the paper are those of the authors alone, independent of their organizations or funding sources.
Figures


References
-
- Kaiser M. J., Collie J. S., Hall S. J., Jennings S., Poiner I. R., Modification of marine habitats by trawling activities: Prognosis and solutions. Fish Fish. 3, 114–136 (2002).
-
- Eigaard O. R., et al. , The footprint of bottom trawling in European waters: Distribution, intensity and seabed integrity. ICES J. Mar. Sci. 74, 847–886 (2017).
-
- Jennings S., Kaiser M. J., The effects of fishing on marine ecosystems. Adv. Mar. Biol. 34, 201–352 (1998).
-
- Collie J. S., Hall S. J., Kaiser M. J., Poiner I. R., A quantitative analysis of fishing impacts on shelf-sea benthos. J. Anim. Ecol. 69, 785–798 (2000). - PubMed
-
- Kaiser M. J., et al. , Global analysis of response and recovery of benthic biota to fishing. Mar. Ecol. Prog. Ser. 311, 1–14 (2006).
MeSH terms
LinkOut - more resources
Full Text Sources

