. 2022 Jan 11;119(2):e2110993118.
doi: 10.1073/pnas.2110993118.

Trophic interactions with heterotrophic bacteria limit the range of Prochlorococcus

Affiliations

Trophic interactions with heterotrophic bacteria limit the range of Prochlorococcus

Christopher L Follett et al. Proc Natl Acad Sci U S A. .

Abstract

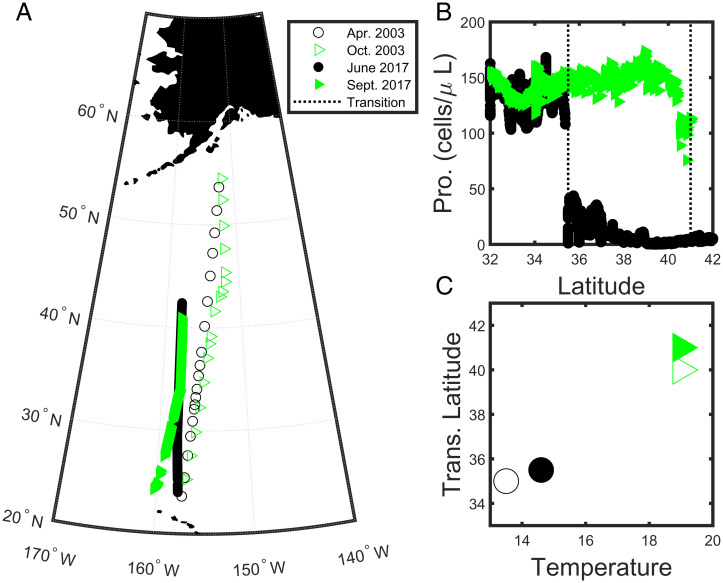
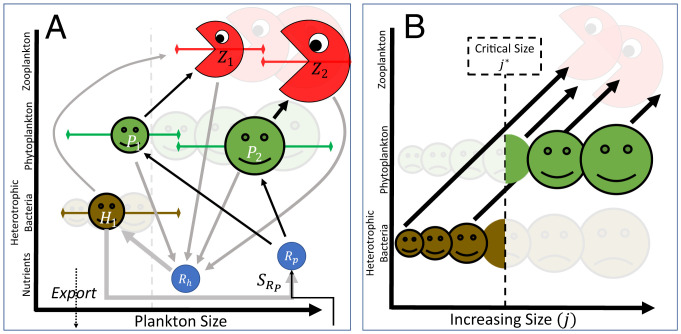
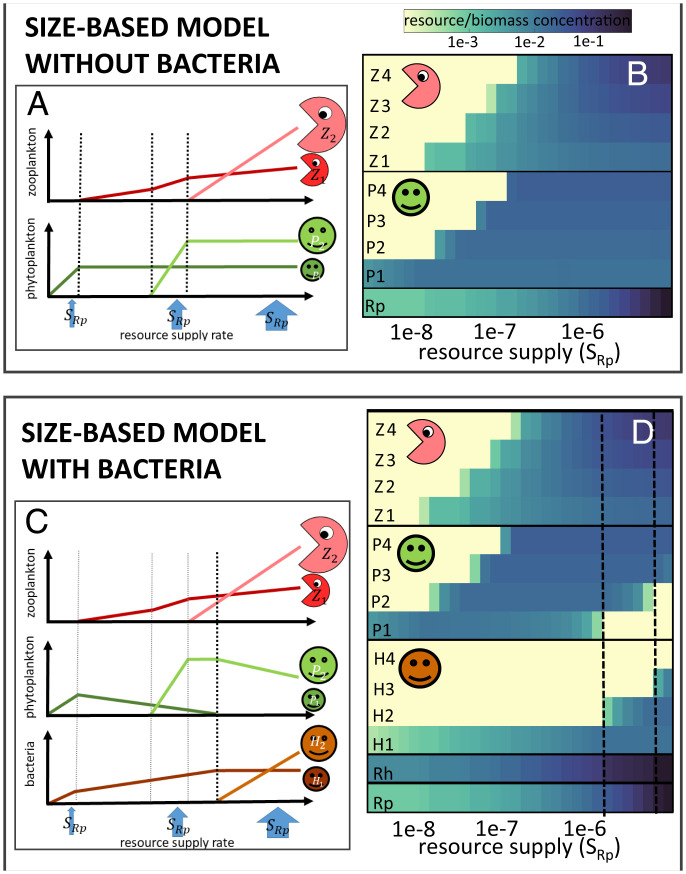
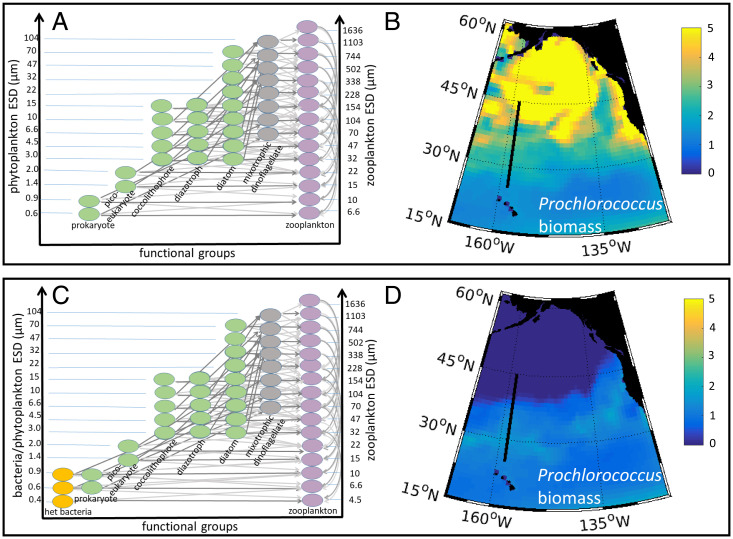
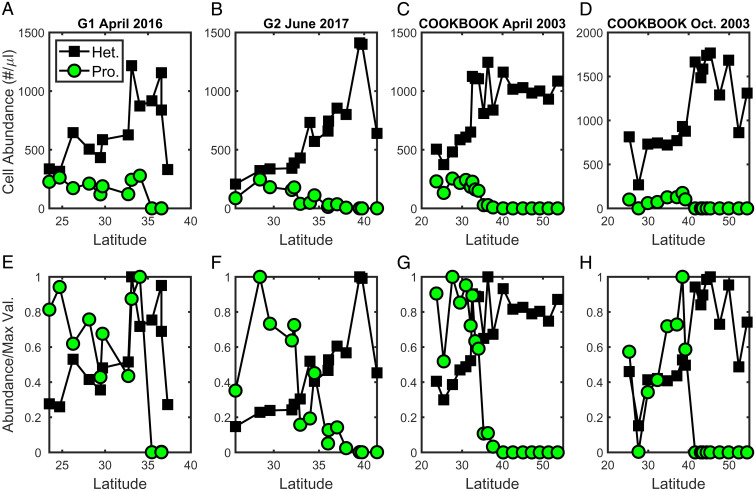
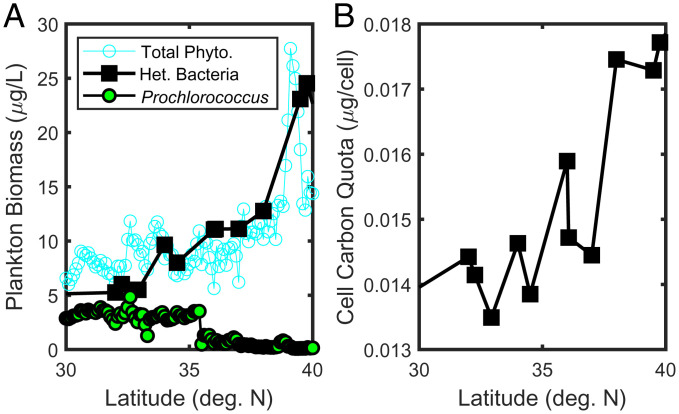
Prochlorococcus is both the smallest and numerically most abundant photosynthesizing organism on the planet. While thriving in the warm oligotrophic gyres, Prochlorococcus concentrations drop rapidly in higher-latitude regions. Transect data from the North Pacific show the collapse occurring at a wide range of temperatures and latitudes (temperature is often hypothesized to cause this shift), suggesting an ecological mechanism may be at play. An often used size-based theory of phytoplankton community structure that has been incorporated into computational models correctly predicts the dominance of Prochlorococcus in the gyres, and the relative dominance of larger cells at high latitudes. However, both theory and computational models fail to explain the poleward collapse. When heterotrophic bacteria and predators that prey nonspecifically on both Prochlorococcus and bacteria are included in the theoretical framework, the collapse of Prochlorococcus occurs with increasing nutrient supplies. The poleward collapse of Prochlorococcus populations then naturally emerges when this mechanism of "shared predation" is implemented in a complex global ecosystem model. Additionally, the theory correctly predicts trends in both the abundance and mean size of the heterotrophic bacteria. These results suggest that ecological controls need to be considered to understand the biogeography of Prochlorococcus and predict its changes under future ocean conditions. Indirect interactions within a microbial network can be essential in setting community structure.

Keywords: Prochlorococcus; biogeography; trophic interactions.


Conflict of interest statement

The authors declare no competing interest.

Figures

Fig. 1.
Fig. 1.
Cruise transect data: The transition from relatively stable to very few Prochlorococcus occurs at different latitudes over the seasons, and at different temperatures. (A) Cruise tracks for four latitudinal cruises across the northeast Pacific Ocean from April 2003, October 2003, April 2016, and September 2017. Black circles represent spring, and green triangles represent fall. Filled symbols are measurements from cruises associated with the Simons Collaboration on Ocean Processes and Ecology (SCOPE)-Gradients (7) cruise campaign, and open symbols are associated with cruises as part of the Comprehensive Oligotrophic Ocean Knowledge-Biogeochemical Observations Oahu-Kodiak (COOK-BOOK) program (8). (B) Mixed layer abundances of Prochlorococcus (cells per microliter) along the transect of the two cruises in June 2017 and September 2017. The dashed vertical lines indicate the latitude of the abrupt drop in cell numbers. (C) The corresponding latitude (y axis) and temperature (x axis) where the transition occurs.
Fig. 2.
Fig. 2.
Ecosystem schematics. (A) Heterotrophic bacteria, Hj, phytoplankton, Pj, and zooplankton, Zj, along with their required resources Ri (i=p,h) are shown with arrows representing the elemental flow. The earlier size-based PZ model (Eqs. 13) formulation with two sizes is represented by the black arrows. The addition of a heterotroph, H1 and organic matter resource Rh shown with gray arrows (i.e., the system represented by Eqs. 610), allows for the exclusion of P1 at large enough resource supplies (SRp). (B) The mechanism for exclusion can be described in terms of a critical size class, j*, separating a heterotroph-dominated from an autotroph-dominated section of the size spectrum. This critical size increases as a function of inorganic resource supply.
Fig. 3.
Fig. 3.
(A and C) Schematic of the theoretical steady-state results for different resource rates (SR) for (A) simple Rp, Pj, Zj size structured model (Eqs. 13) and (C) the more complex model including size classes of heterotrophic bacteria Hj (Eqs. 610). (B and D) Solutions for zero-dimensional numerical model for different resource supply rates for (B) Eqs. 13 and (D) Eqs. 610. Solutions are steady state for low resource supply rates, and are averages over several cycles of predator–prey oscillations that occur for higher resource supply rates in the simplified equations.
Fig. 4.
Fig. 4.
Global biophysical model. (A and C) Schematic of the ecosystem structure with y axis representing the size of organisms and x axis representing their functional type. In A, remineralization is parameterized as a rate, while, in C, three heterotrophic bacteria size classes are explicitly included in the food web. (B and D) Modeled surface biomass (milligrams C per cubic meter) of the model Prochlorococcus analogs for the case with no explicit bacteria (B) and the case with bacteria (D).
Fig. 5.
Fig. 5.
Observed surface data for Prochlorococcus (green circles) and heterotrophic bacteria (black squares). (AD) Cell abundance (cells per microliter) across four different transects spanning 2003–2016. Cruises in BD are the same as in Fig. 1. Additional cruise information is available for the SCOPE-Gradients cruises 1 and 2 (A and B; see ref. 7) and the COOK-BOOK cruises (C and D; see ref. 8). (EH) Cell abundance normalized to the maximum value of that type on that transect (above, AD).
Fig. 6.
Fig. 6.
Observed surface data from the June 2017 north–south transect near 158W (MGL1704, SCOPE-Gradients 2; also see Fig. 1). (A) Total estimated carbon biomass (micrograms C per liter; see Materials and Methods) for heterotrophic bacteria (black squares), Prochlorococcus (green circles), and total phytoplankton (blue open circles). (B) Mean cell mass (micrograms C per cell) of heterotrophic bacteria.

References

    1. Partensky F., Garczarek L., Prochlorococcus: Advantages and limits of minimalism. Annu. Rev. Mar. Sci. 2, 305–331 (2010). - PubMed
    1. Flombaum P., et al. ., Present and future global distributions of the marine Cyanobacteria Prochlorococcus and Synechococcus. Proc. Natl. Acad. Sci. U.S.A. 110, 9824–9829 (2013). - PMC - PubMed
    1. Goericke R., The structure of marine phytoplankton communities—Patterns, rules, and mechanisms. CCOFI Rep. 52, 182–197 (2011).
    1. Ribalet F., et al. ., SeaFlow data v1, high-resolution abundance, size and biomass of small phytoplankton in the North Pacific. Sci. Data 6, 277 (2019). - PMC - PubMed
    1. Johnson Z. I., et al. ., Niche partitioning among Prochlorococcus ecotypes along ocean-scale environmental gradients. Science 311, 1737–1740 (2006). - PubMed

Publication types

LinkOut - more resources