. 2022 Jan 5;10(1):2.
doi: 10.1038/s41413-021-00165-x.

Inhibition of aberrant Hif1α activation delays intervertebral disc degeneration in adult mice

Affiliations

Inhibition of aberrant Hif1α activation delays intervertebral disc degeneration in adult mice

Zuqiang Wang et al. Bone Res. .

Abstract

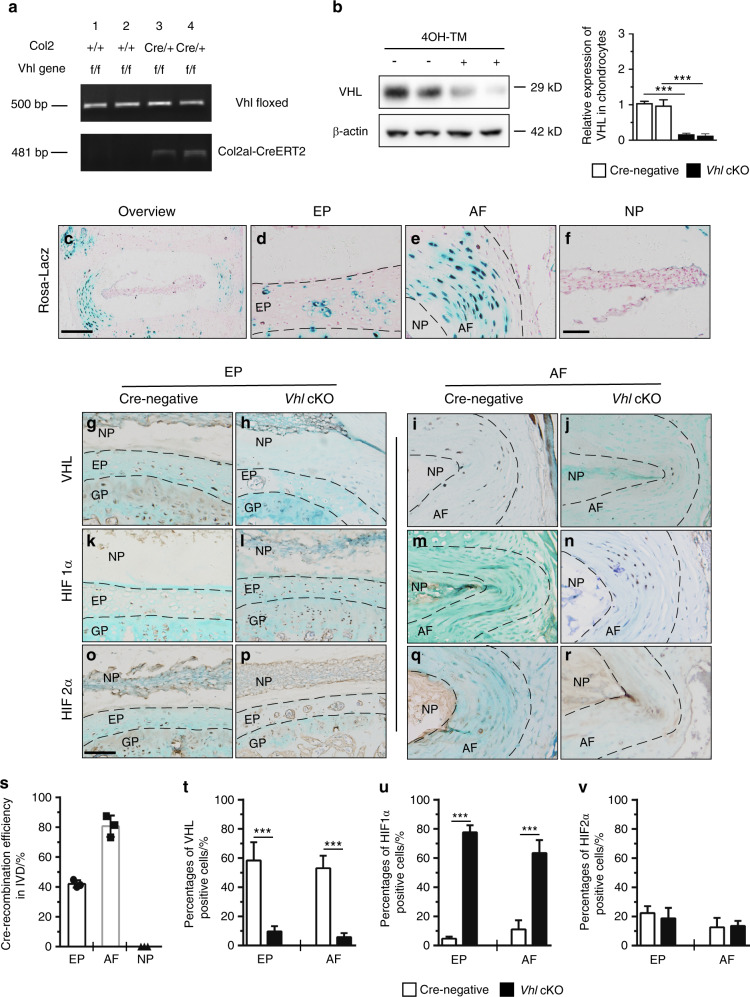
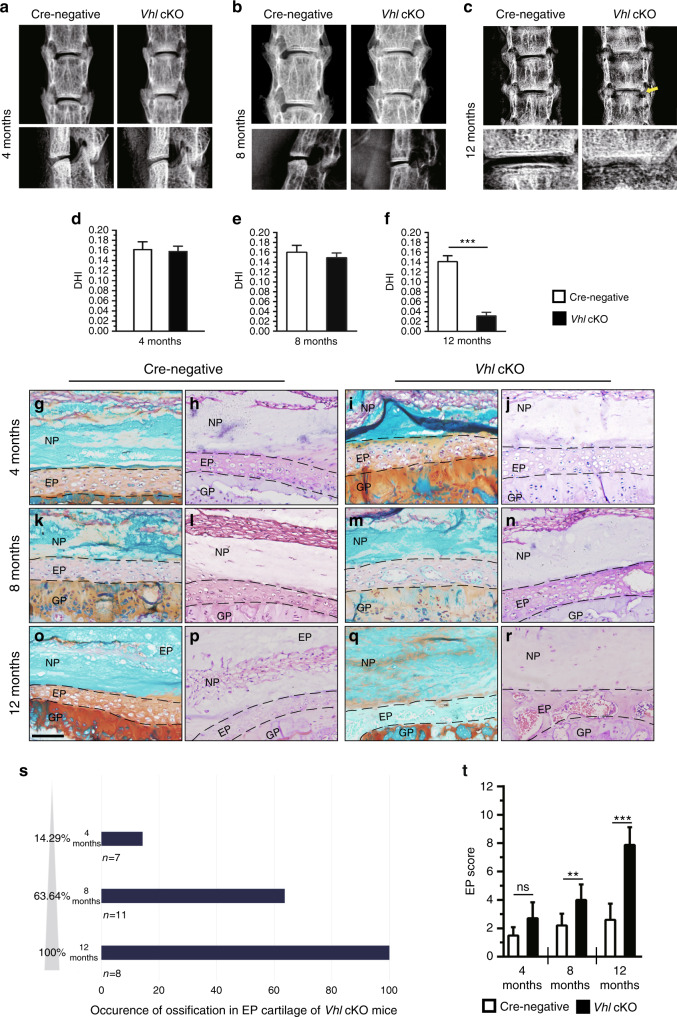
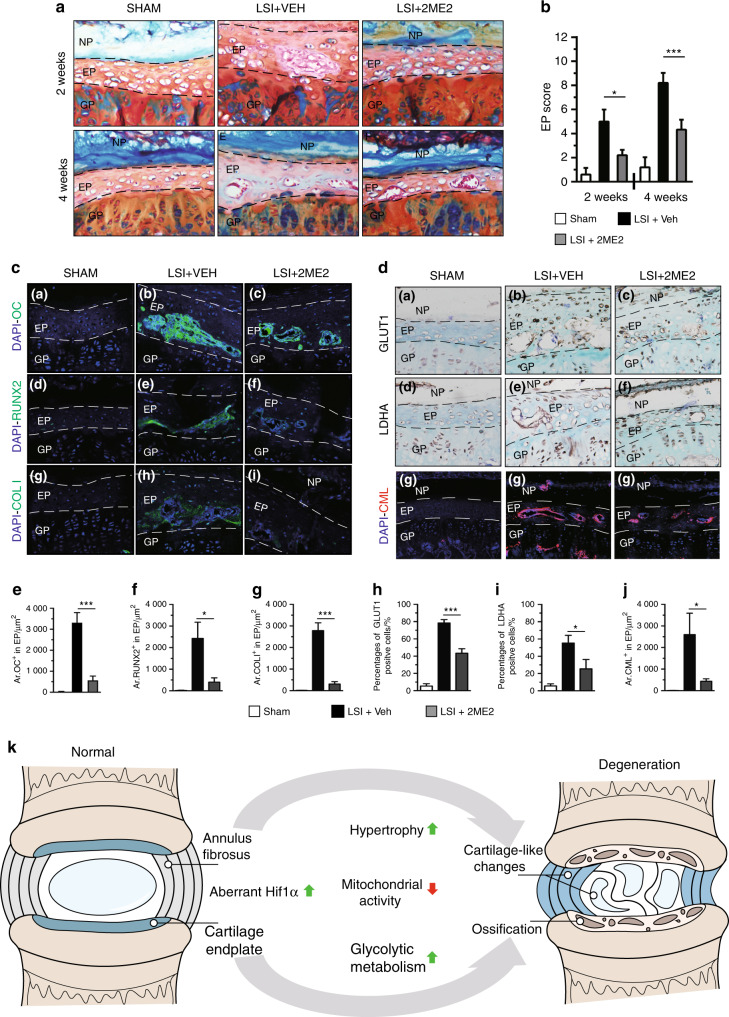
The intervertebral disc (IVD) is the largest avascular tissue. Hypoxia-inducible factors (HIFs) play essential roles in regulating cellular adaptation in the IVD under physiological conditions. Disc degeneration disease (DDD) is one of the leading causes of disability, and current therapies are ineffective. This study sought to explore the role of HIFs in DDD pathogenesis in mice. The findings of this study showed that among HIF family members, Hif1α was significantly upregulated in cartilaginous endplate (EP) and annulus fibrosus (AF) tissues from human DDD patients and two mouse models of DDD compared with controls. Conditional deletion of the E3 ubiquitin ligase Vhl in EP and AF tissues of adult mice resulted in upregulated Hif1α expression and age-dependent IVD degeneration. Aberrant Hif1α activation enhanced glycolytic metabolism and suppressed mitochondrial function. On the other hand, genetic ablation of the Hif1α gene delayed DDD pathogenesis in Vhl-deficient mice. Administration of 2-methoxyestradiol (2ME2), a selective Hif1α inhibitor, attenuated experimental IVD degeneration in mice. The findings of this study show that aberrant Hif1α activation in EP and AF tissues induces pathological changes in DDD, implying that inhibition of aberrant Hif1α activity is a potential therapeutic strategy for DDD.


Conflict of interest statement

The authors declare no competing interests.

Figures

Fig. 1
Fig. 1
Upregulated HIF1α signaling in EP and AF tissues of degenerative IVD. (a) Real-time PCR analysis of HIF1A, HIF2A and HIF3A expression in degenerative lumbar EP from patients with DDD. be Immunohistochemical detection of HIF1A expression was performed in normal and degenerative lumbar EP and AF tissues. fh Histological analysis of IVD samples harvested at 2 and 4 weeks post LSI (lumbar spine instability) surgery and by Safranin O/Fast green staining. The arrowheads indicate EP ossifications. IHC staining for HIF1α was performed in the IVD of wild-type mice. (i) Sham mice, (j, k) 2 weeks and 4 weeks after LSI surgery. l Quantitative analysis of the areas of HIF1α immunoreacted positive cells in LSI surgery. mo Caudal vertebrae were harvested at 0, 1, and 3 weeks after tail-looping surgery and analyzed histologically by Safranin O/Fast green staining. pr Immunohistochemical analysis of HIF1α+ cells in tail-looping surgery. The black arrow indicates AF degeneration. s Quantitative analysis of HIF1α+ cells. Scale bar: 100 µm (be), 50 µm (fk), 100 µm (mr). Data are expressed as the percent expression relative to controls. Values represent the mean (symbols) ± SD (error bars). *P < 0.05; **P < 0.01; ***P < 0.001.
Fig. 2
Fig. 2
Conditional deletion of Vhl in EP and AF cells leads to aberrant Hif1α activation in mouse IVDs. a Polymerase chain reaction (PCR) for genotyping Vhlflox/flox Col2a1-CreERT2 (Vhl cKO) mice. b VHL protein expression in response to tamoxifen (TM) treatment in primary IVD cells from Vhlflox/flox Col2a1-CreERT2 mice, as determined by western blotting. cf Lac-Z staining detecting the Cre-mediated recombination efficiency in IVD cells of Col2a1-CreERT2; Rosa26 mice at 4 months of age (n = 5 per group). (gr) Immunohistochemistry analysis of VHL, HIF1α and HIF2α in the EP and AF of Vhl cKO and control mice (n = 5 per group). s Quantitative analysis of the Cre recombination efficiency in IVD cells. tv Quantitative analysis of VHL+ cells and HIF1α+ and HIF2α+ cells in the EP and AF of Vhl cKO and control mice. Scale bar: 100 µm (c), 50 µm (dr). Data are expressed as the percent expression relative to controls. Values represent the mean (symbols) ± SD (error bars). *P< 0.05; **P< 0.01; ***P< 0.001.
Fig. 3
Fig. 3
Aberrant Hif1α activation in IVD cells causes age-dependent degeneration. ac Radiographic assessment of IVD phenotypes in Vhl cKO mice and control mice at 4, 8, and 12 months of age. The yellow arrow indicates the formation of osteophytes (n = 7–8 per group). df Methods for measurement of the lengths between L4 and L5 (L4/L5) and for calculation of the disc height index (DHI). gr Safranin-O/Fast green/H&E staining of lumbar IVDs at 4, 8, and 12 months (n = 7–8). s Occurrence of ossification in EP cartilage of Vhl cKO mice. t Histological degenerative scores of EP cartilage in WT and Vhl cKO mice. Scale bar: 50 µm (gr). Data are expressed as the percent expression relative to controls. Values represent the mean (symbols) ± SD (error bars). *P < 0.05; **P < 0.01; ***P < 0.001.
Fig. 4
Fig. 4
Aberrant Hif1α activation causes degenerative changes in IVD tissues. a Fast green/Safranin O- and H&E-stained coronal sections of the AF and NP from WT and Vhl cKO mice. b Histological degenerative scores of NP/AF tissues in WT and Vhl cKO mice. c, d Representative COLI immunofluorescence images of IVDs from the lumbar AF of 12-month-old WT and Vhl cKO mice (green: anti-ColI; blue: Hoechst) (n = 3–4). e, f CD24 signals were analyzed by immunofluorescence assay from NP cells of WT and Vhl cKO mice at the age of 12 months. (red: anti-CD24; blue: Hoechst) (n = 3–4). gh Quantitative analysis of COLI+ cells and CD24+ cells in the EP and AF of Vhl cKO and control mice. i Immunostaining and j quantitative analysis of RUNX2+ cells, COLX+ cells, MMP13+ cells, COLI+ cells, OC+ cells, VEGF+ cells, COL2AL and aggrecan in lumbar discs from WT and Vhl cKO mice at the age of 4 months (n = 3 per group). Scale bar: 50 µm (a, cf, i). Data are expressed as the percent expression relative to controls. Values represent the mean (symbols) ± SD (error bars). *P< 0.05; **P< 0.01; ***P< 0.001.
Fig. 5
Fig. 5
Aberrant HIF1α signaling enhances glycolytic metabolism. al Immunohistochemical detection of GLUT1, LDHA, and PDK1 expression in lumbar discs of WT and Vhl cKO mice (n = 3–5 per group). mo Percentages of GLUT1-, LDHA- and PDK1-immunoreacted positive cells. m, GLUT1-; n, LDHA-; and o, PDK1-positive cells were quantified. p Western blotting analysis of GLUT1, PDK1, and LDHA expression in iAF cells in the siRNA-Vhl group, where the siNega group was used as a control. qs The signal intensities were quantified (n = 3 per group). tu The glucose consumption and lactate production of iAF cells transfected with siRNA-Vhl were determined. Scale bar: 50 µm (al). Data are expressed as the percent expression relative to controls. Values represent the mean (symbols) ± SD (error bars). *P< 0.05; **P< 0.01; ***P< 0.001.
Fig. 6
Fig. 6
Aberrant HIF1α signaling causes mitochondrial dysfunction. a, b Immunofluorescence detection of COX4 and TOM20 was performed in lumbar discs of WT and Vhl cKO mice (n = 3 per group). c, d Percentages of COX4- and TOM20-immunoreacted positive cells. e RCS cells were transfected with siRNA-Vhl (RCS-siRNA-Vhl). Total RNA was isolated, and the mRNA levels of Ppargc1a, Mxi1, Mfn1, Mfn2, Opa1, Ant1, CypD, and Ucp3 were detected by RT-PCR (n = 3 per group). f, g Fluorescent staining for monitoring mitochondria with a MitoTracker® probe. (h-i) RCS cells subjected to siRNA-Vhl were stained with JC-1. Changes in △Ψm were detected by fluorescence microscopy. (j, k) ROS production was determined using the fluorescent probe dihydroethidium (DHE) (green: DHE; blue: Hoechst) (n = 3–4). l Quantification of flow cytometry for mitochondrial mass. m Carboxymethyl lysine (CML) signals were analyzed by an immunofluorescence assay from WT and Vhl cKO mice at the age of 12 months (red: anti-CML; blue: Hoechst) (n = 3–4). n Quantification of mitochondrial membrane potential, o DHE fluorescence, p areas of CML-positive cells in EP, and q percentages of CML-positive cells in AF. Scale bar: 50 µm (ab, m), 20 µm (hk), 10 µm (f, g). Data are expressed as the percent expression relative to controls. Values represent the mean (symbols) ± SD (error bars). *P< 0.05; **P< 0.01; ***P< 0.001.
Fig. 7
Fig. 7
Genetic ablation of the Hif1α gene delays DDD pathogenesis. ag RCS cells were transfected with siRNA-Vhl (RCS-siRNA-Vhl), followed by treatment with ADZ7545 (10 μmol·L−1). Total RNA was isolated, and the mRNA levels of Pdk1, Runx2, Mmp13, Adamts5, Col10al, Col2al, and Aggrecan were detected by RT-PCR (n = 3 per group). hs Representative Fast green/Safranin O- and H&E-stained images of EPs from WT, Vhl cKO, and Vhl Hif1α cKO mice (n = 6–8 per group). t Occurrence of ossification in EP cartilage of Vhl Hif1α cKO mice. u Degenerative scores of EP cartilage in WT, Vhl cKO, and Vhl Hif1α cKO mice. Scale bar: 50 µm (al). Data are expressed as the percent expression relative to controls. Values represent the mean (symbols) ± SD (error bars). *P < 0.05; **P < 0.01; ***P < 0.001.
Fig. 8
Fig. 8
Pharmacologic inhibition of Hif1α attenuates experimental IVD degeneration. a IVD samples were harvested at 2 and 4 weeks post LSI surgery and analyzed histologically by Safranin O/Fast green/alcian blue staining. b Histological degenerative scores of EP tissue. c Immunofluorescence detection and eg quantitative analysis of OC, RUNX2, and COLI expression were performed in lumbar discs of mice at 4 weeks post LSI surgery (n = 3 per group). d Immunostaining and hj quantitative analysis of GLUT+ cells, LDHA+ cells and CML+ cells (red) in lumbar discs (n = 3 per group). k Schematic diagram of the mechanisms underlying the roles of aberrant HIF1α signaling in DDD pathogenesis. Scale bar: 50 µm (a, c, d). Data are expressed as the percent expression relative to controls. Values represent the mean (symbols) ± SD (error bars). *P< 0.05; **P< 0.01; ***P< 0.001.

References

    1. Balague F, Mannion AF, Pellise F, Cedraschi C. Non-specific low back pain. Lancet. 2012;379:482–491. - PubMed
    1. Hansson E, Hansson T. The cost-utility of lumbar disc herniation surgery. Eur. Spine J. 2007;16:329–337. - PMC - PubMed
    1. Andersson GB. Epidemiological features of chronic low-back pain. Lancet. 1999;354:581–585. - PubMed
    1. Kerr GJ, Veras MA, Kim MK, Seguin CA. Decoding the intervertebral disc: unravelling the complexities of cell phenotypes and pathways associated with degeneration and mechanotransduction. Semin. Cell Dev. Biol. 2017;62:94–103. - PubMed
    1. Boden SD, Davis DO, Dina TS, Patronas NJ, Wiesel SW. Abnormal magnetic-resonance scans of the lumbar spine in asymptomatic subjects. A prospective investigation. J. Bone Jt. Surg. Am. 1990;72:403–408. - PubMed