

Spatial assessment of femoral neck bone density and microstructure in hip osteoarthritis
- PMID: 34984214
- PMCID: PMC8693349
- DOI: 10.1016/j.bonr.2021.101155
Spatial assessment of femoral neck bone density and microstructure in hip osteoarthritis
Abstract
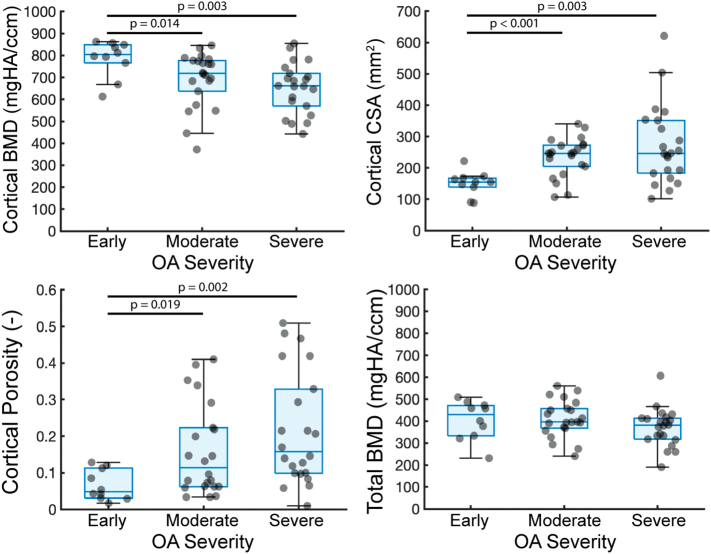
Osteoarthritis (OA) is known to involve profound changes in bone density and microstructure near to, and even distal to, the joint. Critically, however, a full, spatial picture of these abnormalities has not been well documented in a quantitative fashion in hip OA. Here, micro-computed tomography (44.8 μm/voxel) and data-driven computational anatomy were used to generate 3-D maps of the distribution of bone density and microstructure in human femoral neck samples with early (6F/4M, mean age = 51.3 years), moderate (14F/8M, mean age = 60 years), and severe (16F/6M, mean age = 63.3 years) radiographic OA. With increasing severity of radiographic OA, there was decreased cortical bone mineral density (BMD) (p=0.003), increased cortical thickness (p=0.001), increased cortical porosity (p=0.0028), and increased cortical cross-sectional area (p=0.0012, due to an increase in periosteal radius (p=0.018)), with no differences detected in the total femoral neck or trabecular compartment measures. No OA-related region-specific differences were detected through Statistical Parametric Mapping, but there were trends towards decreased tissue mineral density (TMD) in the inferior femoral neck with increasing OA severity (0.050 < p ≤ 0.091), possibly due to osteophytes. Overall, the lack of differences in cortical TMD among radiographic OA groups indicated that the decrease in cortical BMD with increasing OA severity was largely due to the increased cortical porosity rather than decreased tissue mineralization. As porosity is inversely associated with stiffness and strength in cortical bone, increased porosity may offset the effect that increased cortical cross-sectional area would be expected to have on reducing stresses within the femoral neck. The use of high-resolution imaging and quantitative spatial assessment in this study provide insight into the heterogeneous and multi-faceted changes in density and microstructure in hip OA, which have implications for OA progression and fracture risk.
Keywords: Bone; Femur; Hip; Imaging; Micro-computed tomography; Microstructure; Osteoarthritis.
© 2021 The Authors.
Figures


References
-
- Agricola R., Heijboer M.P., Bierma-Zeinstra S.M., Verhaar J.A., Weinans H., Waarsing J.H. Cam impingement causes osteoarthritis of the hip: a nationwide prospective cohort study (CHECK) 2013;72:918–923. - PubMed
-
- Aguado-Maestro I., Panteli M., García-Alonso M., García-Cepeda I., Giannoudis P.V. Hip osteoarthritis as a predictor of the fracture pattern in proximal femur fractures. Injury. 2017;48:S41–S46. - PubMed
-
- Bala Y., Zebaze R., Seeman E. 2015. Role of cortical bone in bone fragility. - PubMed
-
- Beck T.J., Ruff C.B., Scott W.W., Plato C.C., Tobin J.D., Quan C.A. Sex differences in geometry of the femoral neck with aging: a structural analysis of bone mineral data. Calcif. Tissue Int. 1992;50:24–29. - PubMed
-
- Beck T.J., Looker A.C., Ruff C.B., Sievanen H., Wahner H.W. Structural trends in the aging femoral neck and proximal shaft: analysis of the third national health and nutrition examination survey dual-energy X-ray absorptiometry data. J. Bone Miner. Res. 2000;15:2297–2304. - PubMed
Grants and funding
LinkOut - more resources
Full Text Sources
Research Materials
