. 2021 Dec 4;25(1):103571.
doi: 10.1016/j.isci.2021.103571. eCollection 2022 Jan 21.

PPARα and PPARγ activation is associated with pleural mesothelioma invasion but therapeutic inhibition is ineffective

Affiliations

PPARα and PPARγ activation is associated with pleural mesothelioma invasion but therapeutic inhibition is ineffective

M Lizeth Orozco Morales et al. iScience. .

Abstract

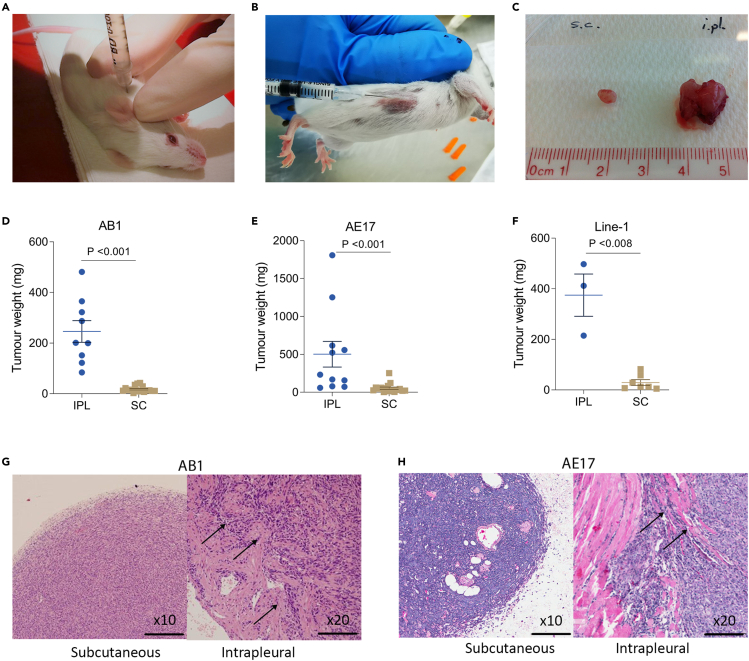
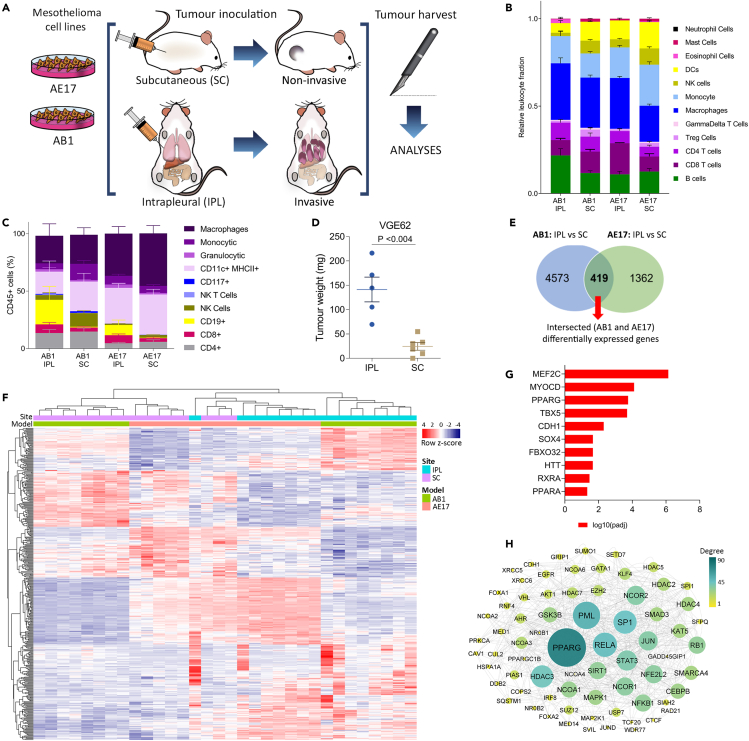
Mesothelioma is a cancer that typically originates in the pleura of the lungs. It rapidly invades the surrounding tissues, causing pain and shortness of breath. We compared cell lines injected either subcutaneously or intrapleurally and found that only the latter resulted in invasive and rapid growth. Pleural tumors displayed a transcriptional signature consistent with increased activity of nuclear receptors PPARα and PPARγ and with an increased abundance of endogenous PPAR-activating ligands. We found that chemical probe GW6471 is a potent, dual PPARα/γ antagonist with anti-invasive and anti-proliferative activity in vitro. However, administration of GW6471 at doses that provided sustained plasma exposure levels sufficient for inhibition of PPARα/γ transcriptional activity did not result in significant anti-mesothelioma activity in mice. Lastly, we demonstrate that the in vitro anti-tumor effect of GW6471 is off-target. We conclude that dual PPARα/γ antagonism alone is not a viable treatment modality for mesothelioma.

Keywords: Biological sciences; Metabolomics; Transcriptomics.


Conflict of interest statement

The authors declare no competing interests.

Figures

None
Graphical abstract
Figure 1
Figure 1
Mesothelioma cells are more invasive and divide more rapidly in the pleural cavity compared to the subcutaneous space Tumor inoculation in the (A) intrapleural site and (B) subcutaneous site in BALB/c mice. (C) Subcutaneous (left) and intrapleural (right) tumors were harvested at day 10. (D–F) Weights from IPL and SC tumors with (D) AB1 cell line in BALB/c mice (E) AE17 cell line in C57BL/6 mice, and (F) Line-1 cell line in BALB/c mice. Data are means ± SEM from three independent sets of experiments. Student's t-test (D) p <0.001 (E) p <0.001, and (F) p <0.008. (G and H) IPL and SC tumors from (G) AB1 and (H) AE17 cell lines were stained with hematoxylin and eosin. Arrows depict tumors penetrating surrounding tissues. Scale bar = 100 μm.
Figure 2
Figure 2
PPARα and γ signaling are associated with invasive pleural mesothelioma development (A) Experimental design, n (mice) = 8 per group. (B) CIBERSORT analysis from AB1 SC, AB1 IPL, AE17 SC, and AE17 IPL groups, n = 8 per group. (C) Flow cytometry of dissociated tumors from AB1 SC (n = 8), AB1 IPL (n = 8), AE17 SC (n = 5), and AE17 IPL (n = 5) bearing mice. (D) Weight (mg) from IPL and SC tumors with VGE62 cell line in NSG mice. Data are presented as means ± SEM. Student's t-test, p <0.004. (E) Venn diagram with the number of differentially expressed genes between IPL and SC tumors from AB1 (4573) and AE17 (1362) models. (F) Unsupervised-hierarchical clustering of intersected differentially expressed genes. (G) Upstream regulator analysis of intersected differentially expressed genes. (H) Graphical reconstruction of network based on the turquoise module obtained from the WGCNA analysis (Figure S2). Node degree is shown as size and color.
Figure 3
Figure 3
Endogenous PPAR ligand arachidonic acid is highly abundant in pleural mesothelioma (A–D) Tumor inoculation of AE17 and AB1 cells induces mesothelioma tumor tissue growth with a location-specific biochemical fingerprint. (A) Differing between the intrapleural (IPL) (red) or subcutaneous (SC) (blue) implantation location, as observed by PLS-DA. (B and C) The 10 most influential metabolites which describe the observed biochemical phenotypes, modeled by ROC Curve analysis (B) ROC curves for individual biomarker models based on the average model performance, using between two and ten of the identified metabolites (C) The most influential metabolites ranked by importance. (D) Metabolomic pathways analyses. Significant pathways are displayed as circles and the color of each circle is displayed as p value (Y axis). The size of the circle corresponds to the pathway impact score (X axis). (E and F) Cell metabolic activity assay using MTT in (E) AB1, AE17, VGE62 (F) HAP1, HAP1 PPARA KO, and HAP1 PPARG KO cell lines. Arachidonic acid was used at 0 (control), 5, and 10 μM. Data are depicted as means ± SD values of three independent experiments, n (replicates per experiment) = 3 per group. Two-way ANOVA with Dunnett's multiple comparison test.
Figure 4
Figure 4
Chemical probe GW6471 is a dual PPARα/γantagonist (A and B) LanthaScreen TR-FRET binding assay for chemical probes GW6471 and GW9662 when binding to (A) PPARα and (B) PPARγ. The curve is presented as a non-linear regression; log(ligand) versus response. IC50 values (μM) are shown in Table 1. Data are presented as means ± SD values, n (replicates per experiment) = 3 per group. (C–F) Reporter cell assay using HG5LN for (C) GW9662 vs PPARα (D) GW9662 versus PPARγ (E) GW6471 versus PPARα, and (F) GW6471 versus PPARγ. Data represented as squares indicate the antagonistic activity of the chemical probes in the presence of PPARα agonist GW327647 or the PPARγ agonist rosiglitazone. Data represented as circles are from control experiments to examine the effect of the chemical probes on the viability of the cell line, HG5LN. The curve is presented as a non-linear regression; log(ligand) versus response. IC50 values (μM) are shown in Table 1. Data are presented as means ± SD values. n (replicates per experiment) = 4 per group.
Figure 5
Figure 5
Dual PPARα/γ antagonist GW6471 inhibits cancer cell growth and migration in vitro (A and B) Soft agar colony formation assay for JU77 human mesothelioma cell line. GW6471 was added in different concentrations, 8, 2, 1, 0.5 μM, and the control (0 μM). (A) Data are means ± SD of three replicates. Two-way ANOVA with Dunnett's multiple comparison test (∗p <0.02, ∗∗p <0.005, ∗∗∗p <0.001). (B) Colonies count was performed using the software ImageJ. Edges were excluded, size = pixel2 0 – infinity, circularity = 0.00–1.00. (C) Scratch assay for migration (control, no matrigel) and invasion (matrigel) in wounded VGE62 human mesothelioma cell line. Original wound in blue. Scale bar = 300 μm. (D) Invasion assay in wounded VGE62 human mesothelioma cell line when adding GW6471 at 10, 1, 0.5 μM, and control (0 μM). Data are means ± SD values of three replicates, n (replicates per experiment) = 4. Two-way ANOVA with Dunnett's multiple comparison test. (E) Cell metabolic activity assay using MTT in VGE62, AB1, and AE17 cell lines. GW6471 was serial diluted from 100 μM to 0.391 μM and a control (0 μM). Cell viability was normalized (% of control). Data are means ± SD values of three replicates, n (replicates per experiment) = 4.
Figure 6
Figure 6
Dual inhibition of PPARα and PPARγ does not result in significant anti-mesothelioma activity in vivo (A) Unbound plasma concentration (nM) time profile for GW6471 following IP administration at 10 mg/kg in female BALB/c mice with and without pre-treatment with ABT. Dotted lines show in vitro reporter cell assay IC50 values (corrected for unbound fraction) for PPARα in blue and PPARγ in orange. Data are presented as individual dots, n (mice per group) = 3. (B) Experimental design. (C) Bioluminescence imaging for tumor bioluminescence monitoring on days 3, 7, and 11 for control groups (vehicle and ABT + vehicle) and treatment groups (GW6471 and ABT + GW6471). (D) Tumor bioluminescence comparison based on average radiance (p/s/cm2/sr) over time. Data are means ± SD values of two replicates, n = 5. Two-way ANOVA with Dunnett's multiple comparison test. (E) IP tumors were stained with hematoxylin and eosin. Tumor invasion in the intestines is indicated by black arrows and in the pancreas by blue arrows. Scale bar = (x10) 100 μm.
Figure 7
Figure 7
The anti-tumor effects of GW6471 are largely off-target (A and B) Cell metabolic activity assay using MTT in HAP1, HAP1 PPARA KO, and HAP1 PPARG KO cell lines. (A) GW6471 and (B) GW9662 were serial diluted from 100 μM to 0.391 μM and compared with a control (0 μM). Cell viability was normalized (% of control). Data are means ± SD values of three different experiments with n (replicates per experiment) = 4. (C, D and E) Migration assay in wounded HAP1, HAP1 PPARA KO, and HAP1 PPARG KO cell lines when adding GW6471 at 10, 1 μM, and control (0 μM). Data are means ± SD values of three different experiments with n (replicates per experiment) = 4. Two-way ANOVA with Dunnett's multiple comparison test. GW6471 significant effect on (C) HAP1; p <0.004 at 1 μM, and p <0.0001 at 10 μM (D) HAP1 PPARA KO; p <0.0001 at 1 and 10 μM, and (E) HAP1 PPARG KO; p <0.0024 at 1 μM, and p <0.0001 at 10 μM.

References

    1. Abu Aboud O., Donohoe D., Bultman S., Fitch M., Riiff T., Hellerstein M., Weiss R.H. PPARα inhibition modulates multiple reprogrammed metabolic pathways in kidney cancer and attenuates tumor growth. Am. J. Physiol. Cell Physiol. 2015;308:C890–C898. - PMC - PubMed
    1. Abu Aboud O., Wettersten H.I., Weiss R.H. Inhibition of PPARa induces cell cycle arrest and apoptosis, and synergizes with glycolysis inhibition in kidney cancer cells. PLoS One. 2013;8:1–9. - PMC - PubMed
    1. Ahmadian M., Suh J.M., Hah N., Liddle C., Atkins A.R., Downes M., Evans R.M. PPAR γ signaling and metabolism: The good, the bad and the future. Nat. Med. 2013;19:557–566. - PMC - PubMed
    1. Andrews, S., 2010. FASTQC. A quality control tool for high throughput sequence data.
    1. Aota S., Nagai T., Olden K., Akiyama S.K., Yamada K.M. Fibronectin and integrins in cell adhesion, signaling, and morphogenesis. Biochem. Soc. Trans. 1991;19:830–835. - PubMed