Randomized Controlled Trial
. 2022 Feb;234(2):e13771.
doi: 10.1111/apha.13771. Epub 2022 Jan 19.

Acute normobaric hypoxia blunts contraction-mediated mTORC1- and JNK-signaling in human skeletal muscle

Affiliations
Randomized Controlled Trial

Acute normobaric hypoxia blunts contraction-mediated mTORC1- and JNK-signaling in human skeletal muscle

Marcus Moberg et al. Acta Physiol (Oxf). 2022 Feb.

Abstract

Aim: Hypoxia has been shown to reduce resistance exercise-induced stimulation of protein synthesis and long-term gains in muscle mass. However, the mechanism whereby hypoxia exerts its effect is not clear. Here, we examine the effect of acute hypoxia on the activity of several signalling pathways involved in the regulation of muscle growth following a bout of resistance exercise.

Methods: Eight men performed two sessions of leg resistance exercise in normoxia or hypoxia (12% O2 ) in a randomized crossover fashion. Muscle biopsies were obtained at rest and 0, 90,180 minutes after exercise. Muscle analyses included levels of signalling proteins and metabolites associated with energy turnover.

Results: Exercise during normoxia induced a 5-10-fold increase of S6K1Thr389 phosphorylation throughout the recovery period, but hypoxia blunted the increases by ~50%. Phosphorylation of JNKThr183/Tyr185 and the JNK target SMAD2Ser245/250/255 was increased by 30- to 40-fold immediately after the exercise in normoxia, but hypoxia blocked almost 70% of the activation. Throughout recovery, phosphorylation of JNK and SMAD2 remained elevated following the exercise in normoxia, but the effect of hypoxia was lost at 90-180 minutes post-exercise. Hypoxia had no effect on exercise-induced Hippo or autophagy signalling and ubiquitin-proteasome related protein levels. Nor did hypoxia alter the changes induced by exercise in high-energy phosphates, glucose 6-P, lactate or phosphorylation of AMPK or ACC.

Conclusion: We conclude that acute severe hypoxia inhibits resistance exercise-induced mTORC1- and JNK signalling in human skeletal muscle, effects that do not appear to be mediated by changes in the degree of metabolic stress in the muscle.

Keywords: FSR; Hippo pathway; deuterium oxide; muscle metabolites; oxygen.


Conflict of interest statement

The authors declare that they have no conflict of interests.

Figures

FIGURE 1
FIGURE 1
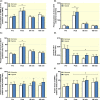
Peripheral capillary oxygen saturation (A), heart rate (B), blood levels of glucose (C), blood levels of lactate (D), muscle levels of lactate (E), muscle levels of ATP (F), PCr (G), Cr (H), PCr/Cr ratio (I), Pi (J), malate (K) and G‐6‐P (L) in the normoxia (black symbols) and hypoxia (blue symbols) trials. Data presented are means ± SEM (n = 8). *P < .05 vs Pre, # P < .05 vs normoxia. The line under the symbols indicates that the effect is present for all data points encompassed by that line
FIGURE 2
FIGURE 2
(A) In‐depth analysis of muscle HIF‐1α protein expression using two different antibodies. PRE represents a mixture of muscle samples from all subjects taken at the resting state in the hypoxia trial. POST represents a mixture of muscle samples from all subjects taken immediately after the exercise bout in the hypoxia‐trial. Cyt. stands for the cytosolic fraction and NET. for the nuclear fraction collected after muscle fractioning. Sup. stands for the supernatant before IP (pre‐IP) and IP. for the immunoprecipitated HIF‐1α. The manufacturer and catalogue no. of the two antibodies for immunoblotting are given in the illustration. For each well, 15 µg of protein was loaded for Cyt., 4.5 µg for NET., 15 µg for Sup., and 20 µL of the IP (representing 40% of the total IP). The arrow indicates the location of the HIF‐1α bands, approx. located at 95 kDa. (B, C) HIF‐1α protein at baseline (Pre), immediately after exercise (Post) and following 90 or 180 minutes of recovery, detected with the antibody from Novus Biologicals and Cell Signaling Technology (CST), respectively. The data presented in B and C are run with the same whole‐tissue lysates used for the entire set of immunoblotting (described in the first section of 4.8). These samples accordingly contain a mixture of cytosolic and nuclear proteins. Note that the blot in C has had a considerably longer exposure time than the blot with the CST antibody in A. Data presented in the bars are the mean ± SEM (n = 8). White bars represent the normoxia trial and blue bars represent the hypoxia trial
FIGURE 3
FIGURE 3
Phosphorylation of (A) S6K1 at Thr389, (B) mTOR at Ser2448, (C) 4E‐BP1 at Thr37/46, (D) eEF2 at Thr56, (E) PRAS40 at Thr256 at and total protein levels of REDD1 and (F) at baseline (Pre), immediately after exercise (Post) and following 90 or 180 minutes of recovery. Data presented in the bars are the mean ± SEM (n = 8). White bars represent the normoxia trial and blue bars represent the hypoxia trial. *P < .05 vs Pre, # P < .05 vs normoxia, (#) P = .09 vs normoxia
FIGURE 4
FIGURE 4
Phosphorylation of (A) JNK at Thr183/Tyr185, (B) SMAD2 at Ser245/250/255, (C) p38 at Thr180/Tyr182, (D) YAP at Ser127 and (E) TAZ at Ser89 at baseline (Pre), immediately after exercise (post) and following 90 or 180 minutes of recovery. Data presented in the bars are the mean ± SEM (n = 8). White bars represent the normoxia trial and blue bars represent the hypoxia trial. *P < .05 vs Pre, # P < .05 vs normoxia
FIGURE 5
FIGURE 5
Phosphorylation of (A) AMPK at Thr172, (B) ACC at Ser79, (C) ULK at Ser317, LC3b‐II/LC3b‐I protein ratio (D), and total protein levels of GABARAP (E) and BNIP3 (F) at baseline (Pre), immediately after exercise (post) and following 90 or 180 minutes of recovery. Data presented in the bars are the mean ± SEM (n = 8). White bars represent the normoxia trial and blue bars represent the hypoxia trial. *P < .05 vs Pre
FIGURE 6
FIGURE 6
Total protein levels of (A) MuRF‐1, (B) MAFbx, and (C) UBR5 at baseline (Pre), and following 180 minutes or 24 hours of recovery. Data presented in the bars are the mean ± SEM (n = 8). White bars represent the normoxia trial and blue bars represent the hypoxia trial. *P < .05 vs Pre
FIGURE 7
FIGURE 7
Representative western blots for the proteins presented in Figures 3, 4, 5, 6
FIGURE 8
FIGURE 8
Intracellular 2H‐alanine enrichment (A) at baseline and after 24 hours of recovery, and (B) mixed muscle protein fractional synthetic rate (FSR) during 24 hours of exercise and recovery in the normoxia trial (black symbols) and hypoxia trial (blue symbols). Each symbol represents an individual subject (n = 8). *P < .05 vs Pre
FIGURE 9
FIGURE 9
Schematic overview of the trial design. Biopsy needles represent muscle biopsy time points. Syringes indicate venous blood sampling time points. Numbers under blocks indicate time (min) after infusion start, set number and time (min) of recovery. Res.Ex stands for knee extensor resistance exercise. WU stands for warm‐up, three sets. Inspired fraction of oxygen during a baseline period and the exercise session was set to 21% or 12% in a randomized fashion. After 180 minutes of recovery, subjects were fed a standardized meal (34 g protein, 21 g carbohydrate and 7 g fat) after which they left the laboratory and returned in an overnight fasted state the next morning for 24‐hour sampling

Comment in

Similar articles

Cited by

References

    1. McLeod M, Breen L, Hamilton DL, Philp A. Live strong and prosper: the importance of skeletal muscle strength for healthy ageing. Biogerontology. 2016;17(3):497‐510. - PMC - PubMed
    1. McKendry J, Breen L, Shad BJ, Greig CA. Muscle morphology and performance in master athletes: a systematic review and meta‐analyses. Ageing Res Rev. 2018;45:62‐82. - PubMed
    1. Filippin LI, Teixeira VN, da Silva MP, Miraglia F, da Silva FS. Sarcopenia: a predictor of mortality and the need for early diagnosis and intervention. Aging Clin Exp Res. 2015;27(3):249‐254. - PubMed
    1. McGlory C, Devries MC, Phillips SM. Skeletal muscle and resistance exercise training; the role of protein synthesis in recovery and remodeling. J Appl Physiol. 2017;122(3):541‐548. - PMC - PubMed
    1. Hoppeler H, Kleinert E, Schlegel C, et al. Morphological adaptations of human skeletal muscle to chronic hypoxia. Int J Sports Med. 1990;11(Suppl 1):S3‐S9. - PubMed

Publication types

Substances