. 2022 Jan 5:11:e73358.
doi: 10.7554/eLife.73358.

A test of the pioneer factor hypothesis using ectopic liver gene activation

Affiliations

A test of the pioneer factor hypothesis using ectopic liver gene activation

Jeffrey L Hansen et al. Elife. .

Abstract

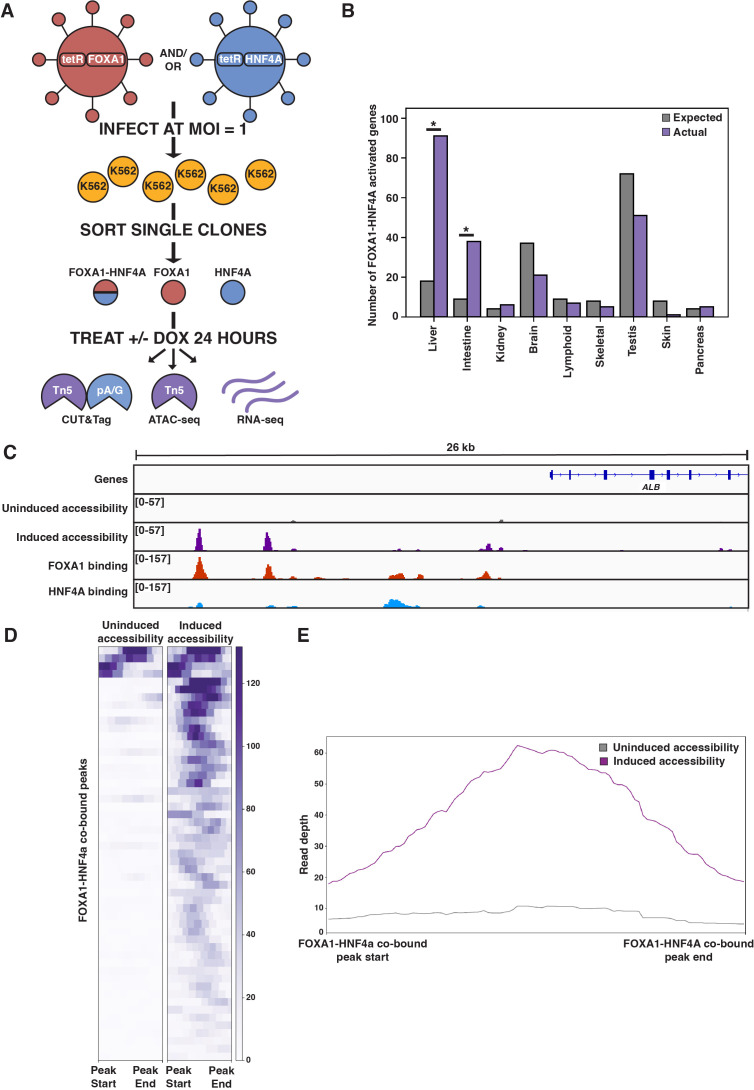
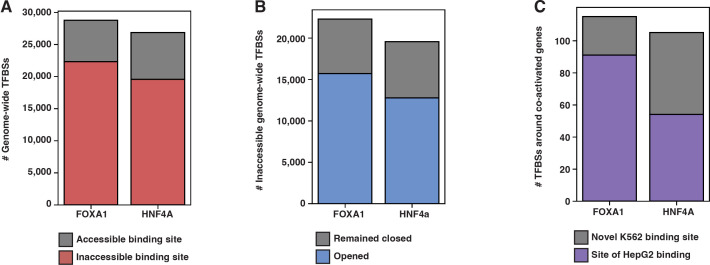
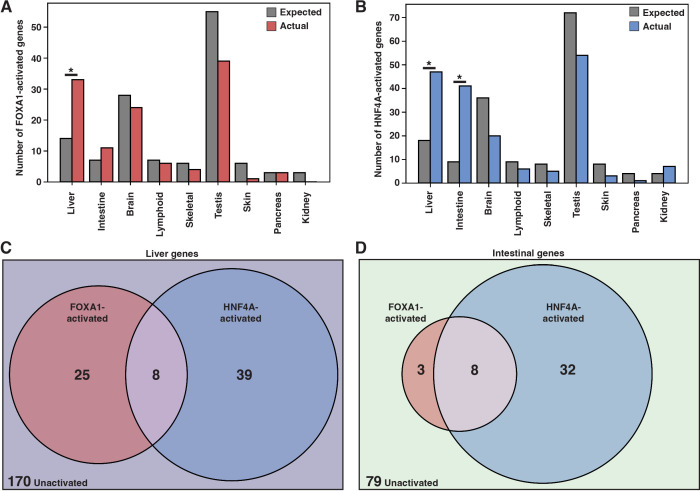
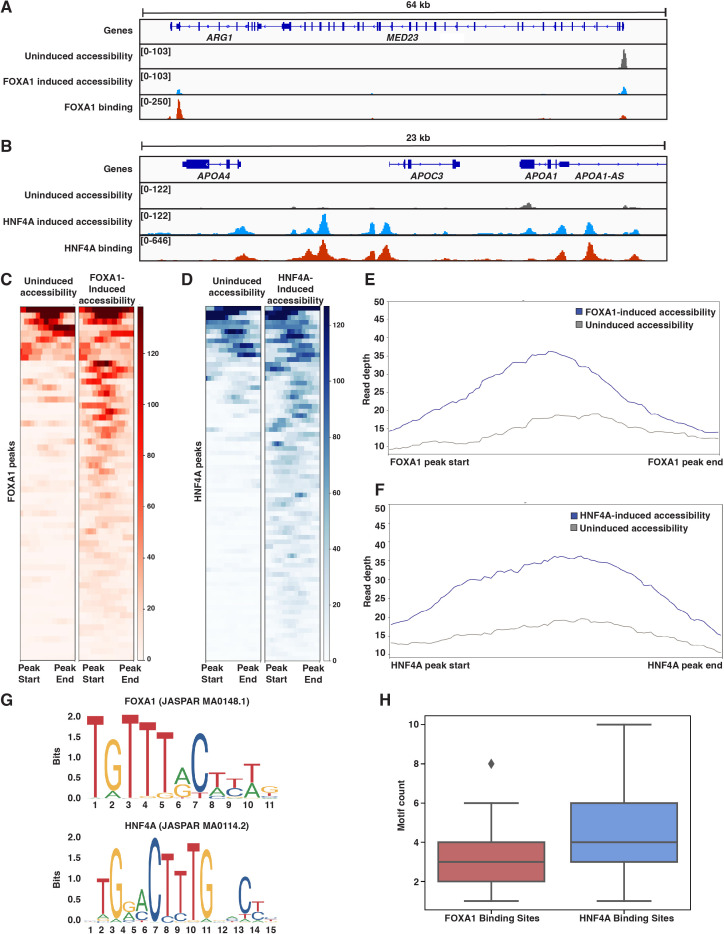
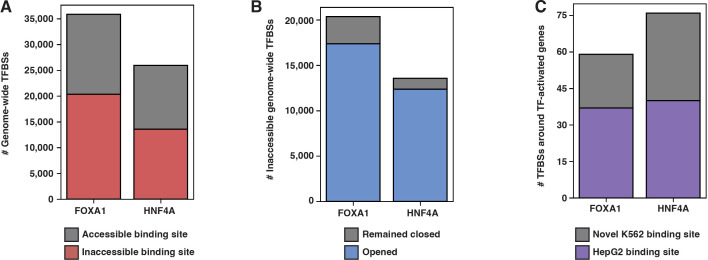
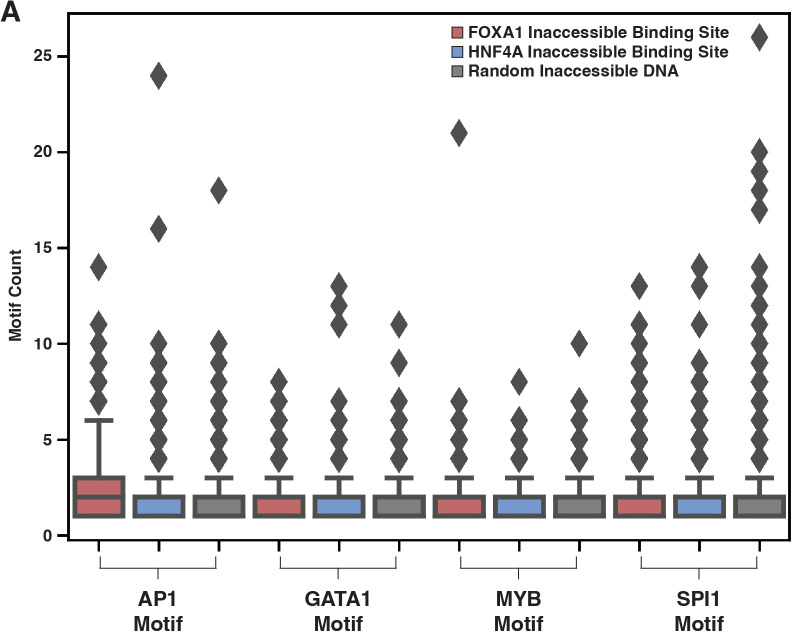
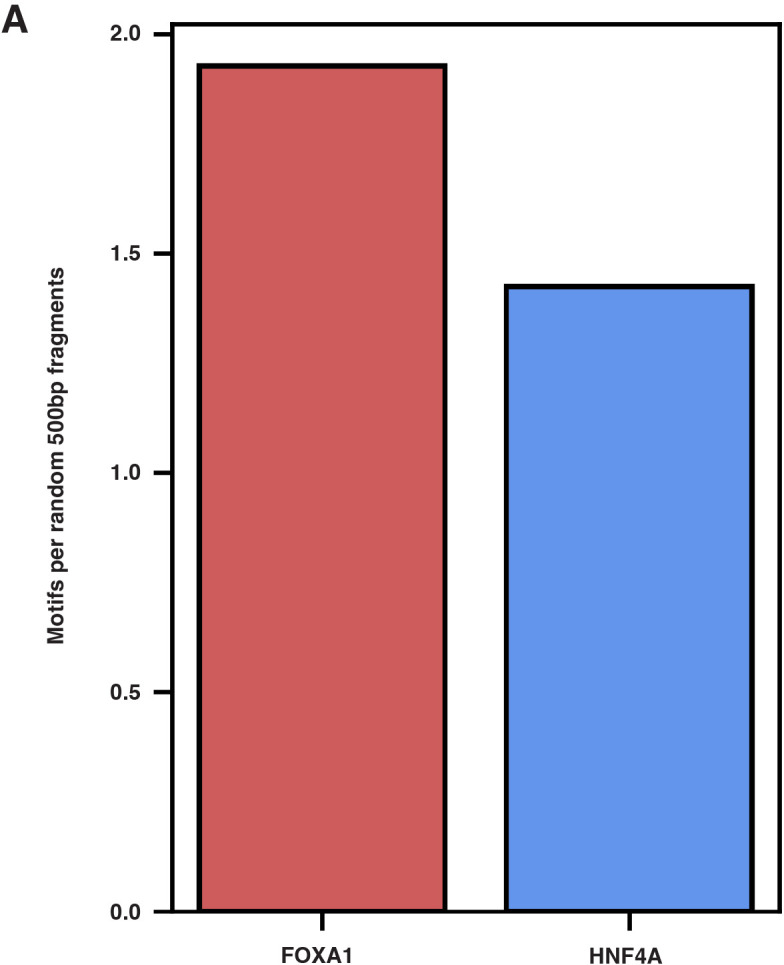
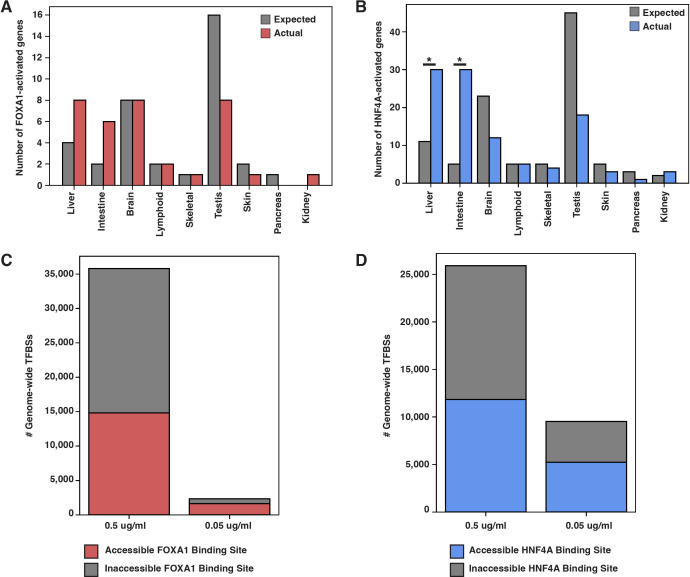
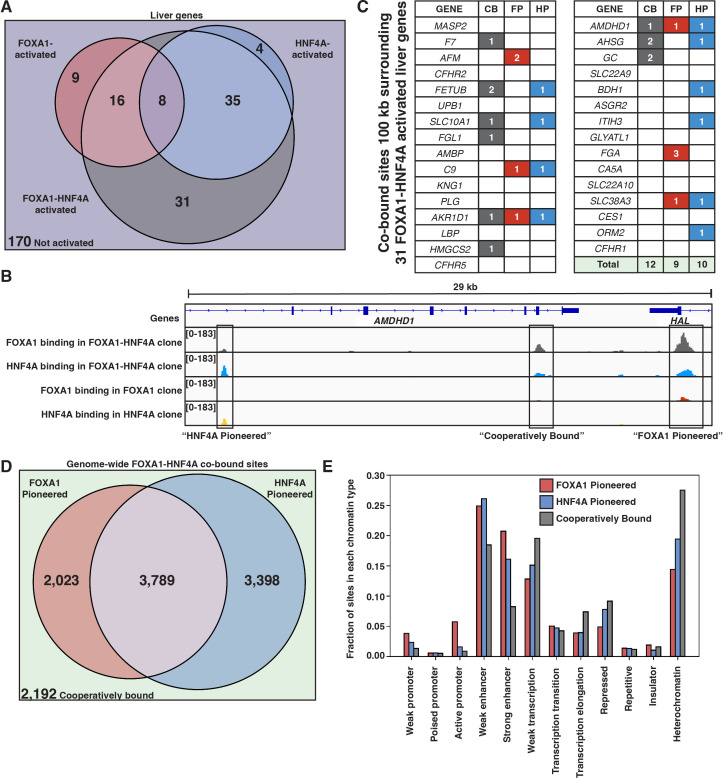
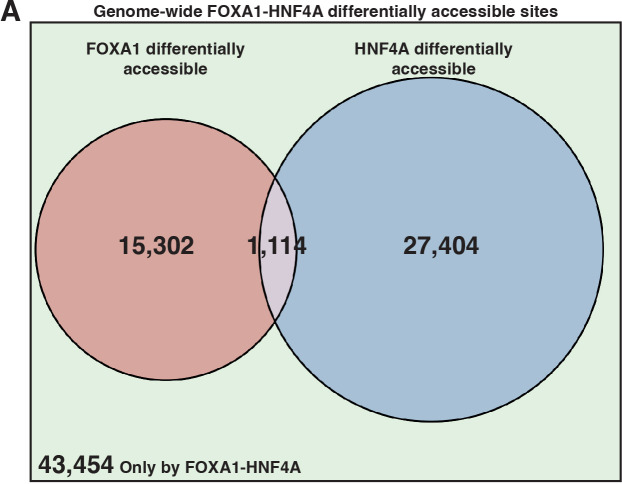
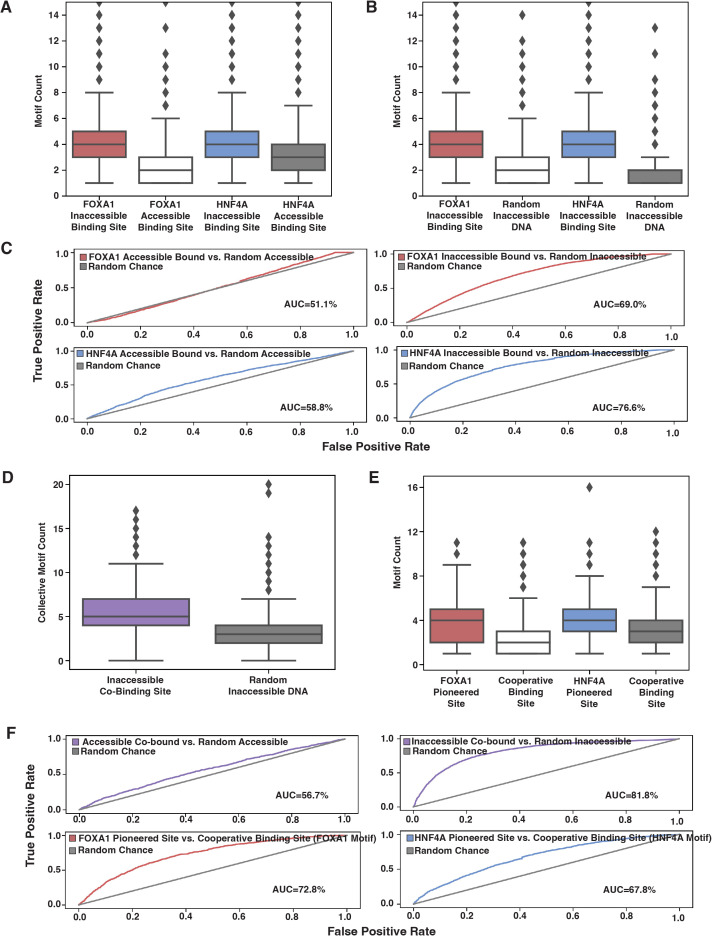
The pioneer factor hypothesis (PFH) states that pioneer factors (PFs) are a subclass of transcription factors (TFs) that bind to and open inaccessible sites and then recruit non-pioneer factors (non-PFs) that activate batteries of silent genes. The PFH predicts that ectopic gene activation requires the sequential activity of qualitatively different TFs. We tested the PFH by expressing the endodermal PF FOXA1 and non-PF HNF4A in K562 lymphoblast cells. While co-expression of FOXA1 and HNF4A activated a burst of endoderm-specific gene expression, we found no evidence for a functional distinction between these two TFs. When expressed independently, both TFs bound and opened inaccessible sites, activated endodermal genes, and 'pioneered' for each other, although FOXA1 required fewer copies of its motif for binding. A subset of targets required both TFs, but the predominant mode of action at these targets did not conform to the sequential activity predicted by the PFH. From these results, we hypothesize an alternative to the PFH where 'pioneer activity' depends not on categorically different TFs but rather on the affinity of interaction between TF and DNA.

Keywords: cellular reprogramming; chromosomes; gene expression; genetics; genomics; human k562 cell line; pioneer factors; transcription factors.

Plain language summary

Cells only use a fraction of their genetic information to make the proteins they need. The rest is carefully packaged away and tightly bundled in structures called nucleosomes. This physically shields the DNA from being accessed by transcription factors – the molecular actors that can read genes and kickstart the protein production process. Effectively, the genetic sequences inside nucleosomes are being silenced. However, during development, transcription factors must overcome this nucleosome barrier and activate silent genes to program cells. The pioneer factor hypothesis describes how this may be possible: first, ‘pioneer’ transcription factors can bind to and ‘open up’ nucleosomes to make target genes accessible. Then, non-pioneer factors can access the genetic sequence and recruit cofactors that begin copying the now-exposed genetic information. The widely accepted theory is based on studies of two proteins – FOXA1, an archetypal pioneer factor, and HNF4A, a non-pioneer factor – but the predictions of the pioneer factor hypothesis have yet to be explicitly tested. To do so, Hansen et al. expressed FOXA1 and HNF4A, separately and together, in cells which do not usually make these proteins. They then assessed how the proteins could bind to DNA and impact gene accessibility and transcription. The experiments demonstrate that FOXA1 and HNF4A do not necessarily follow the two-step activation predicted by the pioneer factor hypothesis. When expressed independently, both transcription factors bound and opened inaccessible sites, activated target genes, and ‘pioneered’ for each other. Similar patterns were observed across the genome. The only notable distinction between the two factors was that FOXA1, the archetypal pioneering factor, required fewer copies of its target sequence to bind DNA than HNF4A. These findings led Hansen et al. to propose an alternative theory to the pioneer factor hypothesis which eliminates the categorical distinction between pioneer and non-pioneer factors. Overall, this work has implications for how biologists understand the way that transcription factors activate silent genes during development.


Conflict of interest statement

JH, KL, BC No competing interests declared

Figures

Figure 1.
Figure 1.. FOXA1-HNF4A pioneers liver-specific loci in K562 cells.
(A) Schematic of experimental design to infect K562 cells with FOXA1- or HNF4A-lentivirus and then perform functional assays on dox-induced cells. In CUT&Tag, a protein A-protein G fusion (pA/G) increases the binding spectrum for Fc-binding and allows Tn5 recruitment to antibody-labeled transcription factor (TF) binding sites. In ATAC-seq, Tn5 homes to any accessible site. And in RNA-seq, polyA RNA is captured and sequenced. (B) The number of tissue-specific genes predicted from the hypergeometric distribution to be activated by FOXA1-HNF4A compared to the number actually activated. Both liver- (p<10–38) and intestinal enrichment (p<10–13) are significant. There are 242 total liver-enriched genes and 122 total intestine-enriched genes. (C) Genome browser view of a representative liver-specific locus (ALB) in FOXA1-HNF4A clonal line that shows uninduced and induced accessibility, FOXA1 binding, and HNF4A binding. (D) Heatmap showing uninduced and induced accessibility at all FOXA1-HNF4A co-bound sites within 50 kb of each FOXA1-HNF4A-activated liver-specific gene (n = 53). (E) Meta plot showing average signal across each site from (D).
Figure 1—figure supplement 1.
Figure 1—figure supplement 1.. Titration of doxycycline concentration and treatment time for transcription factor (TF) and target gene induction.
qPCR measurements made from RNA extracted from either the FOXA1 clonal line (A–D) or the HNF4A clonal line (E–H) that was treated with either increasing doxycycline concentrations or longer time periods. Expression is displayed as log10 fold induction over either 0 µg/ml doxycycline control (for concentration titration) or time 0 (for time titration). Each sample primer was normalized to the HPRT housekeeping gene. Doxycycline concentration titration measurements were made at 0, 0.01, 0.05, 0.1, 0.5, 2, and 5 µg/ml. Doxycycline treatment time measurements were made at 0, 6, 12, 24, 48, 72, and 96 hr.
Figure 1—figure supplement 2.
Figure 1—figure supplement 2.. Characterization of FOXA1 and HNF4A binding patterns in FOXA1-HNF4A clone.
(A) The number of genome-wide FOXA1 or HNF4A transcription factor binding sites (TFBS) in the induced (+dox) cells that overlap with an ATAC-seq peak in the uninduced (-dox) cells (‘accessible binding site’) or that do not overlap with an ATAC-seq peak in the uninduced (-dox) cells (‘inaccessible binding site’). (B) The number of inaccessible binding sites from (A) that overlap with an ATAC-seq peak in the induced (+dox) cells (‘opened’) or that do not overlap with an ATAC-seq peak (‘remained closed’). (C) The number of FOXA1 or HNF4A binding sites within 50 kb of each FOXA1-HNF4A co-activated gene characterized as either a ‘HepG2 binding site,’ where the TFBS overlaps a TFBS of FOXA1 or HNF4A in HepG2 liver cells, or as a ‘Novel K562 binding site,’ where the TFBS does not overlap with a HepG2 binding site.
Figure 2.
Figure 2.. FOXA1 and HNF4A activate independent liver- and intestine-specific genes.
(A) The number of tissue-specific genes predicted from the hypergeometric distribution to be activated by FOXA1 compared to the number actually activated. Liver enrichment (p<10–4) is significant. There are 242 total liver-enriched genes. (B) The number of tissue-specific genes predicted from the hypergeometric distribution to be activated by HNF4A compared to the number actually activated. Liver- (p<10–8) and intestine enrichment (p<10–15) are significant. There are 242 total liver-enriched genes and 122 total intestine-enriched genes. (C) 242 liver genes characterized as activated by Foxa1, HNF4A, both, or neither. (D) 122 intestine genes characterized as activated by FOXA1, HNF4A, both, or neither.
Figure 3.
Figure 3.. Both FOXA1 and HNF4A can pioneer liver-specific loci.
(A) Genome browser view of a representative liver-specific locus (ARG1) in FOXA1 clonal line showing uninduced and induced accessibility and FOXA1 binding. (B) Genome browser view of a representative liver-specific locus (APOC3) in HNF4A clonal line showing uninduced and induced accessibility and HNF4A binding. (C) Heatmap of uninduced and induced accessibility at all FOXA1 binding sites within 50 kb of each FOXA1-activated liver-specific genes (n = 59). (D) Heatmap of uninduced and induced accessibility at all HNF4A binding sites within 50 kb of each HNF4A-activated liver-specific genes (n = 76). (E) Meta plot showing average signal across each site from (C). (F) Meta plot showing average signal across each site from (D). (G) Human FOXA1 and HNF4A sequence logo from JASPAR. (H) FOXA1 or HNF4A motif count within 500 bp centered upon FOXA1 or HNF4A binding sites within 50 kb of each FOXA1- or HNF4A-activated liver-specific genes, respectively. Motifs were called with FIMO using 1e-3 a p-value threshold. For each boxplot, the center line represents the median, the box represents the first to third quartiles, and the whiskers represent any points within 1.5× the interquartile range.
Figure 3—figure supplement 1.
Figure 3—figure supplement 1.. Characterization of FOXA1 and HNF4A binding patterns in FOXA1 or HNF4A individual clones.
(A) The number of genome-wide FOXA1 or HNF4A transcription factor binding sites (TFBS) in the induced (+dox) cells that overlap with an ATAC-seq peak in the uninduced (-dox) cells (‘aAccessible binding site’) or that do not overlap with an ATAC-seq peak in the uninduced (-dox) cells (‘inaccessible binding site’). (B) The number of inaccessible binding sites from (A) that overlap with an ATAC-seq peak in the induced (+dox) cells (‘opened’) or that do not overlap with an ATAC-seq peak (‘remained closed’). (C) The number of FOXA1 or HNF4A binding sites within 50 kb of each FOXA1- or HNF4A-activated gene characterized as either a ‘HepG2 binding site,’ where the TFBS overlaps a TFBS of FOXA1 or HNF4A in HepG2 liver cells, or as a ‘Novel K562 binding site,’ where the TFBS does not overlap with a HepG2 binding site.
Figure 3—figure supplement 2.
Figure 3—figure supplement 2.. K562 transcription factor (TF) motif content in binding sites.
(A) FIMO scans at p-value threshold 1e-3 for four most common proposed K562 pioneer factors (PFs) in either FoxA1 inaccessible binding sites (red), Hnf4a inaccessible binding sites (blue), or random equally lengthed binding sites (gray).
Figure 3—figure supplement 3.
Figure 3—figure supplement 3.. FOXA1 and HNF4A motif scanning.
(A) 1000 random 200 bp fragments were generated using BEDTools and then scanned for FOXA1 and HNF4A motifs with FIMO using 1e-3 a p-value threshold. Total motif count was divided by the number of non-N-containing random sequences (924) to identify motifs per random 200 bp fragment.
Figure 3—figure supplement 4.
Figure 3—figure supplement 4.. Expression and binding at lower doxycycline induction.
(A) The number of tissue-specific genes predicted from the hypergeometric distribution to be activated by FOXA1 at a lower doxycycline concentration (0.05 µg/ml) compared to the number actually activated. There are 242 total liver-enriched genes. (B) The number of tissue-specific genes predicted from the hypergeometric distribution to be activated by HNF4A at a lower doxycycline concentration (0.05 µg/ml) compared to the number actually activated. Liver- (p<10–5) and intestine enrichment (p<10–14) are significant. There are 242 total liver-enriched genes and 122 total intestine-enriched genes. (C, D) Genome-wide FOXA1 (C) or HNF4A (D) binding sites classified as either events that occurred at sites that were accessible or inaccessible in the uninduced (-dox) state at 0.5 and 0.05 µg/ml doxycycline induction.
Figure 4.
Figure 4.. FOXA1 and HNF4A both pioneer and cooperative at liver-specific sites.
(A) Venn diagram of all liver genes categorized as either activated by FOXA1, HNF4A, FOXA1-HNF4A, some combination, or by none of the three cocktails. (B) Genome browser view of a representative liver-specific locus (AMDHD1) showing examples of a co-bound site that is ‘FOXA1 pioneered’ (FP), ‘HNF4A pioneered’ (HP), and ‘cooperatively bound’ (CB). The first two tracks are FOXA1 and HNF4A binding in the FOXA1-HNF4A co-expression clone, and the last two tracks are FOXA1 and HNF4A binding in their individual expression clones. (C) List of the 31 liver genes that are only activated by FOXA1-HNF4A co-expression. The columns indicate how many co-bound FP, HP, or CB peaks exist within 100 kb of the gene. (D) Venn diagram of all genome-wide co-bound peaks categorized as either bound by FOXA1 individually (FP), HNF4A individually (HP), by both, or by neither (CB). (E) Overlap of FP, HP, and CB sites from (D) with ChromHMM annotations showing the fraction of each co-binding site type in each chromatin region.
Figure 4—figure supplement 1.
Figure 4—figure supplement 1.. Characterization of FOXA1-HNF4A differential accessibility.
(A) Venn diagram of all FOXA1-HNF4A-induced differentially accessible peaks categorized by whether the peak was also induced in the FOXA1 clone, HNF4A clone, neither, or both.
Figure 5.
Figure 5.. Affinity model predicts binding events.
(A) FOXA1 or HNF4A motif count at all genomic occurrences of the respective transcription factor’s (TF’s) accessible or inaccessible binding sites. (B) FOXA1 or HNF4A motif count in genome-wide inaccessible binding sites versus length-matched random inaccessible DNA sequences. (C) Receiver operating characteristic (ROC) curves for predictive power of using sequence motif content to predict accessible (left panels) or inaccessible (right panels) binding sites from random sequence. (D) Total FOXA1 and HNF4A motif count at all genomic occurrences of inaccessible co-binding versus length-matched random inaccessible DNA sequences. (E) FOXA1 or HNF4A motif count in respective FOXA1 or HNF4A pioneered sites versus in cooperative binding sites (where neither TF bound individually). (F) ROC curves for predictive power of using sequence motif content to predict accessible or inaccessible co-binding events from random sequence (top panels) or to predict FOXA1 or HNF4A pioneered events from cooperative binding events. All FIMO scans used 1e-3 as p-value threshold and were conducted on 500 bp of sequence centered upon the binding site.

Similar articles

Cited by

References

    1. Bailey TL. STREME: Accurate and versatile sequence motif discovery. Bioinformatics. 2021;1:btab203. doi: 10.1093/bioinformatics/btab203. - DOI - PMC - PubMed
    1. Barozzi I, Simonatto M, Bonifacio S, Yang L, Rohs R, Ghisletti S, Natoli G. Coregulation of transcription factor binding and nucleosome occupancy through DNA features of mammalian enhancers. Molecular Cell. 2014;54:844–857. doi: 10.1016/j.molcel.2014.04.006. - DOI - PMC - PubMed
    1. Biddie SC, John S, Sabo PJ, Thurman RE, Johnson TA, Schiltz RL, Miranda TB, Sung M-H, Trump S, Lightman SL, Vinson C, Stamatoyannopoulos JA, Hager GL. Transcription factor AP1 potentiates chromatin accessibility and glucocorticoid receptor binding. Molecular Cell. 2011;43:145–155. doi: 10.1016/j.molcel.2011.06.016. - DOI - PMC - PubMed
    1. Boyes J, Felsenfeld G. Tissue-specific factors additively increase the probability of the all-or-none formation of a hypersensitive site. The EMBO Journal. 1996;15:2496–2507. - PMC - PubMed
    1. Buenrostro JD, Wu B, Chang HY, Greenleaf WJ. ATAC-seq: A Method for Assaying Chromatin Accessibility Genome-Wide. Current Protocols in Molecular Biology. 2015;109:21. doi: 10.1002/0471142727.mb2129s109. - DOI - PMC - PubMed

Publication types

MeSH terms

Substances

Associated data