. 2022 May;235(1):e13775.
doi: 10.1111/apha.13775. Epub 2022 Feb 4.

Catestatin induces glycogenesis by stimulating the phosphoinositide 3-kinase-AKT pathway

Affiliations

Catestatin induces glycogenesis by stimulating the phosphoinositide 3-kinase-AKT pathway

Gautam Bandyopadhyay et al. Acta Physiol (Oxf). 2022 May.

Abstract

Aim: Defects in hepatic glycogen synthesis contribute to post-prandial hyperglycaemia in type 2 diabetic patients. Chromogranin A (CgA) peptide Catestatin (CST: hCgA352-372 ) improves glucose tolerance in insulin-resistant mice. Here, we seek to determine whether CST induces hepatic glycogen synthesis.

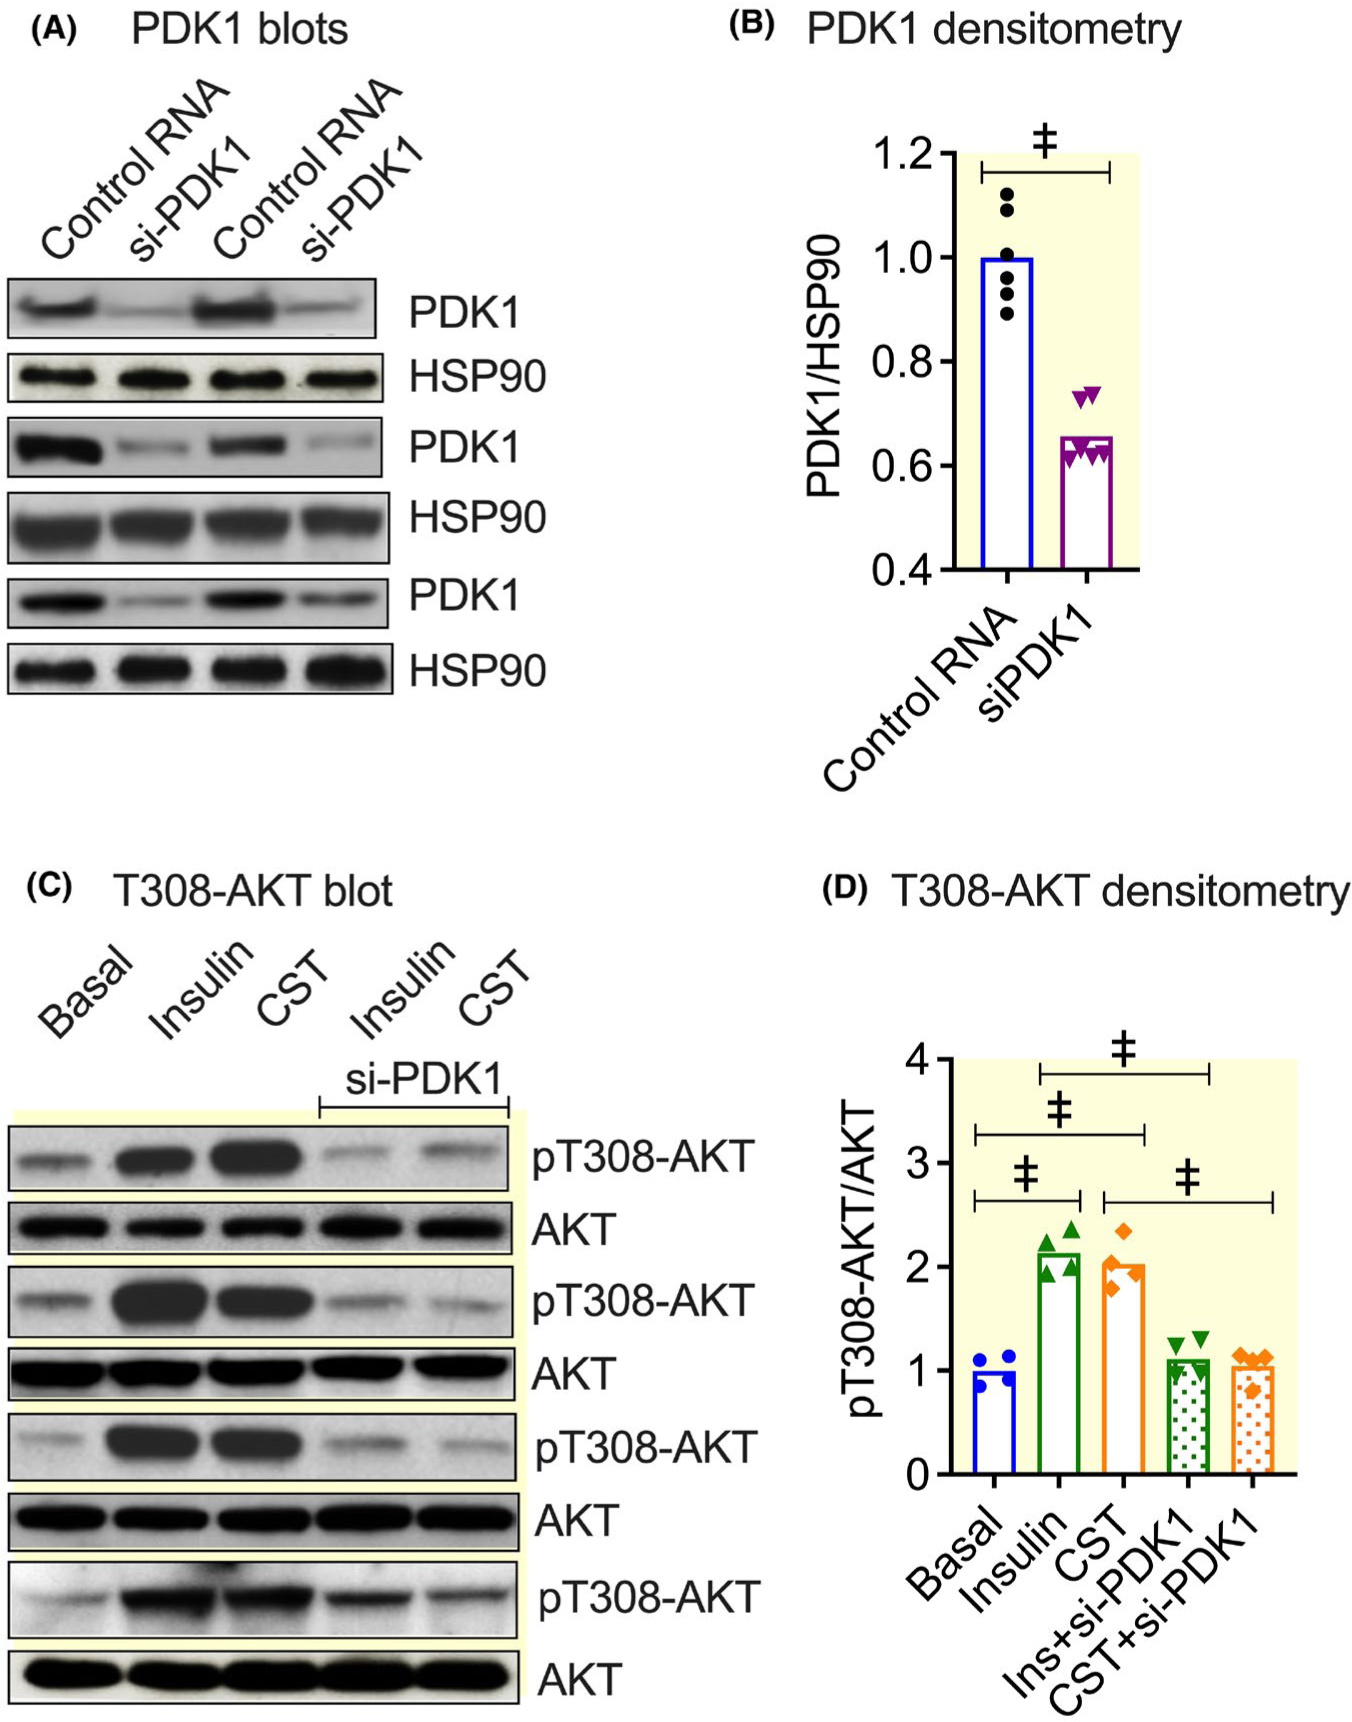
Methods: We determined liver glycogen, glucose-6-phosphate (G6P), uridine diphosphate glucose (UDPG) and glycogen synthase (GYS2) activities; plasma insulin, glucagon, noradrenaline and adrenaline levels in wild-type (WT) as well as in CST knockout (CST-KO) mice; glycogen synthesis and glycogenolysis in primary hepatocytes. We also analysed phosphorylation signals of insulin receptor (IR), insulin receptor substrate-1 (IRS-1), phosphatidylinositol-dependent kinase-1 (PDK-1), GYS2, glycogen synthase kinase-3β (GSK-3β), AKT (a kinase in AKR mouse that produces Thymoma)/PKB (protein kinase B) and mammalian/mechanistic target of rapamycin (mTOR) by immunoblotting.

Results: CST stimulated glycogen accumulation in fed and fasted liver and in primary hepatocytes. CST reduced plasma noradrenaline and adrenaline levels. CST also directly stimulated glycogenesis and inhibited noradrenaline and adrenaline-induced glycogenolysis in hepatocytes. In addition, CST elevated the levels of UDPG and increased GYS2 activity. CST-KO mice had decreased liver glycogen that was restored by treatment with CST, reinforcing the crucial role of CST in hepatic glycogenesis. CST improved insulin signals downstream of IR and IRS-1 by enhancing phospho-AKT signals through the stimulation of PDK-1 and mTORC2 (mTOR Complex 2, rapamycin-insensitive complex) activities.

Conclusions: CST directly promotes the glycogenic pathway by (a) reducing glucose production, (b) increasing glycogen synthesis from UDPG, (c) reducing glycogenolysis and (d) enhancing downstream insulin signalling.

Keywords: catestatin; glucose-6-phosphate; glycogen; glycogen synthase; hyperglycaemia; phospho-AKT.


Conflict of interest statement

CONFLICTS OF INTEREST

The authors have declared no conflict of interest.

Figures

FIGURE 1
FIGURE 1
Effects of chronic catestatin (CST) and acute insulin treatments on hepatic glycogen contents in both fed and fasted normal chow diet wild-type (NCD-WT) mice. Mice were treated with CST (2 μg/g body weight/day for 15 days or 1 hr; intraperitoneal) followed by fasting (8 hr) and treatment with saline or insulin (0.4 mU/g body weight for 30 min; intraperitoneal) before harvesting tissues under deep anaesthesia. A, Liver glycogen content in fed (n = 12) and fasted (n = 15) NCD-WT mice. Two-way ANOVA: Interaction: P < .001; Food: P < .001; Treatment: P < .001. B, Plasma insulin levels in fed and fasted WT-NCD mice (n = 14). Student’s t test. C, Liver glycogen content in fed and fasted WT-NCD mice treated with saline (Sal; n = 43), acute CST for 1 hr (Acu; n = 12) or chronic CST for 15 days (Chr; n = 43). Three-way ANOVA: Food: P < .001; Acute vs Chronic: P < .001; Saline vs CST: P < .001; Food × Acute vs Chronic: ns; Food × Saline vs CST: P < .05; Acute vs Chronic × Saline vs CST; P < .001; Food × Acute vs Chronic × Saline vs CST: ns. D, Liver glycogen content after saline (n = 20), insulin for 30 min (n = 9), acute CST plus insulin (n = 9) or chronic CST for 15 days plus insulin for 30 min (n = 11) treatment in fasted NCD-WT mice. One-way ANOVA. E, Glycogen content in fed NCD-WT gastrocnemius muscle after saline or CST (2 μg/g body weight/day for 15 days; intraperitoneal) treatment (n = 10). Student’s t test. F, Morphometric analysis of transmission electron microscopy (TEM) micrographs showing glycogen granules in saline and CST-treated subsarcolemma and myofibril. Two-way ANOVA: Interaction: P < .01; Treatment: P < .001; Zone: P < .001. G, Morphometric assessment of lipid content in the TEM micrographs of steatotic liver of diet-induced obese mice after saline or chronic CST treatments. Student’s t test. *P < .05; P < .01; P < .001
FIGURE 2
FIGURE 2
Effects of chronic catestatin (CST) and acute insulin treatments on plasma counterregulatory hormone levels in both fed and fasted normal chow diet wild-type (NCD-WT) mice. Fed or fasted NCD-WT mice were treated with CST (2 μg/g body weight/day for 15 days: intraperitoneal) before harvesting tissues under deep anaesthesia after 24 hrs of last injection. A, Noradrenaline (n = 16), adrenaline (n = 16) and glucagon (n = 6) levels in fed and fasted NCD-WT mice. Three-way ANOVA: Hormones: P < .001; Fed vs Fast: P < .001; Saline vs CST: P < .001; Hormones × Fed vs Fast: P < .05; Hormones × Saline vs CST: ns; Fed vs Fast × Saline vs CST: P < .001; Hormones × Fed vs Fast × Saline vs CST: P < .001. B, Noradrenaline levels in saline or insulin-treated fed or fasted NCD-WT mice (n = 7). Two-way ANOVA: Interaction: P < .01; Treatment: P < .05; Food: P < .01. C, Adrenaline levels in saline or insulin-treated fed or fasted NCD-WT mice (n = 7). Two-way ANOVA: Interaction: P < .01; Treatment: P < .001; Food: P < .001. D, Schematic diagram showing age, diet, CST treatments, glucose and insulin tolerance tests and tissue harvesting. E, Liver glycogen content in fed and fasted diet-induced obese (DIO-WT) mice after saline (n = 27) or CST (n = 16) treatments. Two-way ANOVA: Interaction: P < .01; Treatment: P < .001; Food: P < .001. F, Effects of saline (n = 47), insulin alone (n = 9; 30 min) or in combination with chronic CST (n = 12) on glycogen content in fasted DIO-WT mice. One-way ANOVA: P < .001. P < .01; P < .001; ns, not significant
FIGURE 3
FIGURE 3
Effects of intraperitoneal or oral catestatin (CST) treatment on glucose tolerance in diet-induced obese (DIO) mice without causing weight loss. A, B, Oral glucose tolerance test (O-GTT): (A) Dose-dependent effects of oral CST on blood glucose levels during O-GTT (n = 6). Two-way ANOVA: Interaction: P < .05; Time: P < .001; Treatment: P < .001. B, The area under the curve (AUC) of the O-GTT was used to determine EC50 of CST action. One-way ANOVA: P < .001. C, Blood glucose levels during O-GTT after time-course of CST treatment (2 μg/g body weight) (n = 7). Two-way ANOVA: Interaction: P < .001; Time: P < .001; Treatment: P < .001. D, The area under the curve (AUC) of the O-GTT. One-way ANOVA: P < .001. E, Intraperitoneal insulin tolerance test (ip-ITT): Blood glucose levels during ip-ITT after chronic CST treatment (n = 12). Two-way ANOVA: Interaction: P < .001; Time: P < .001; Treatment: P < .001. F, The AUC of the ip-ITT. Student’s t test. *P < .05; P < .01; P < .001; ns, not significant
FIGURE 4
FIGURE 4
Effects of chronic catestatin (CST) and acute insulin treatments on hepatic glycogen content and plasma levels of counterregulatory hormones levels in normal chow diet (NCD)-CST-knock-out (KO) mice. NCD-WT and NCD-CST-KO mice were treated with CST (2 μg/g body weight/day for 15 days; intraperitoneal) followed by treatment with insulin (0.4 mU/g body weight for 30 min) before tissue harvesting. Tissues were harvested from fed or fasted (8 hr) mice under deep anaesthesia. A, Hepatic glycogen content in fed and fasted NCD-CST-KO mice compared with NCD-WT mice (n = 12). Two-way ANOVA: Interaction: P < .001; Treatment: P < .001; Food: P < .001. B, Effects of insulin (30 min) on glycogen content in fed and fasted NCD-CST-KO mice (n = 12). Two-way ANOVA: Interaction: ns; Time: Treatment: P < .05; Food: P < .001. C, Liver glycogen content in fasted and fed NCD-CST-KO mice after saline (n = 26) chronic CST treatment (n = 14). Two-way ANOVA: Interaction: ns; Time: Treatment: P < .05; Food: P < .001. D, Effects of insulin (30 min) alone or in combination with chronic CST on liver glycogen content in fasted CST-KO-NCD mice (n = 12). One-way ANOVA: P < .001. E, Plasma insulin levels in fed or fasted NCD-CST-KO mice (n = 14). Student’s t test. F, Noradrenaline (n = 15), adrenaline (n = 15) and glucagon (n = 6) levels in fed or fasted NCD-CST-KO mice after chronic treatments with CST. Three-way ANOVA: Hormones: P < .001; Fed vs Fast: P < .01; Sal vs CST: P < .001; Hormones × Fed vs Fast: ns; Hormones × Sal vs CST: P < .001; Fed vs Fast × Sal vs CST: P < .05; Hormones × Fed vs Fast × Sal vs CST: ns. G, Noradrenaline and adrenaline levels in saline or insulin (30 min)-treated fed and fasted CST-KO-NCD mice (n = 6). Three-way ANOVA: Catecholamines: P < .001; Fed vs Fast: P < .001; Sal vs Insulin: P < .01; Catecholamines × Fed vs Fast: P < .001; Catecholamines × Sal vs Insulin: P < .05; Fed vs Fast × Sal vs CST: ns; Catecholamines × Fed vs Fast × Sal vs CST: ns. *P < .05; P < .001; ns, not significant
FIGURE 5
FIGURE 5
Regulation of glycogenesis and glycogenolysis in hepatocytes by catestatin (CST) and regulation of the levels of glucose-6-phosphate (G6P) and uridine diphosphate glucose (UDPG) as well as GYS2 activity in mouse liver by CST. A, Dose-dependent effects of CST on glycogenesis from 14C-glucose in cultured primary lean hepatocytes. The EC50 was calculated using GraphPad PRISM software. B, Effects of insulin and/or CST on glycogenesis (n = 4–5). One-way ANOVA: P < .001. C, Effects of insulin (Ins), adrenaline, noradrenaline and/or CST on glycogenolysis from preloaded radio-labelled glycogen (n = 6). One-way ANOVA: P < .001. D, Effects of CST on liver G6P levels in fed or fasted normal chow diet (NCD)-wild-type (WT) mice (n = 6). Two-way ANOVA: Interaction: ns; Treatment: P < .001; Food: ns. E, Effects of CST on liver G6P levels in fed or fasted diet-induced obese (DIO)-WT mice (n = 6). Two-way ANOVA: Interaction: ns; Treatment: ns; Food: P < .01. (F) and (G) Effects of CST on UDPG in the liver of fasted NCD-WT or DIO-WT mice (n = 4). Student’s t test. (H) and (I) Effects of CST on GYS2 activities in the liver of fasted NCD-WT and DIO-WT mice (n = 6). Student’s t test. For GYS2 activity, the activation ratios in the presence of low (0.1 mM) and high (10 mM) G6P are shown (n = 6). Tissues were from the same experiments shown in Figures 1 and 2. *P < .05; P < .01; P < .001, ns, not significant
FIGURE 6
FIGURE 6
Unchanged tyrosine phosphorylation of insulin receptor (IR) and insulin receptor substrate-1 (IRS-1) and increased PI3-kinase activity by catestatin (CST) in primary hepatocytes. A, Immunoblots show tyrosine phosphorylation (pY) of IR in response to insulin and CST (n = 3). B, Immunoblots show tyrosine phosphorylation (pY) of IRS-1 in response to insulin and CST (n = 3). C, Corresponding density ratio of phospho-/total IR signals. One-way ANOVA: P < .001. D, Corresponding density ratio of phospho-/total IRS-1 signals. One-way ANOVA: P < .01. E, Autoradiograph of thin layer chromatography plate showing the formation of phosphatidyl inositol-3-phosphate (PI3-P) due to increased PI-3-kinase activity in the anti-p85-immunprecipitates after stimulation with insulin and/or CST. *P < .05; P < .01; ns, not significant
FIGURE 7
FIGURE 7
Stimulation of phosphorylation of AKT at T308 residue by insulin and catestatin (CST) in a PDK-1-dependent manner. A, Immunoblots showing downregulation of PDK-1 protein expression by si-RNA. B, Bar graphs showing knockdown efficiencies from the immunoblot. Student’s t test. C, Immunoblots showing phospho-T308-AKT and total AKT signals after saline (Basal), insulin and CST treatments in the presence and absence of si-RNA against PDK-1. D, Bar graphs showing phospho-/total AKT signals. One-way ANOVA: P < .001. P < .001; ns, not significant
FIGURE 8
FIGURE 8
Increased phosphorylation of mammalian/mechanistic target of rapamycin (mTOR) in the mTORC2 complex and AKT-S473 by insulin and catestatin (CST) in primary hepatocytes. A, Immunoblots showing phosphorylation of mTOR at Ser2481 (n = 3). B, Corresponding density ratio of phospho-/total of mTOR signals. One-way ANOVA: P < .001. C, Immunoblots showing phosphorylation of AKT at Ser473 (n = 3). D, Corresponding density ratio of phospho-/total AKT signals. One-way ANOVA: P < .001. *P < .05; P < .01; P < .001; ns, not significant
FIGURE 9
FIGURE 9
Catestatin (CST) augments hepatic GYS2 activity (ie, increased dephosphorylation) and decreases GSK-3β activity (ie, increased phosphorylation) in fasted normal chow diet (NCD)-wild-type (WT) and diet-induced obese (DIO)-WT mice. A, Immunoblots showing total and phosphorylated signals for GSK-3 β and GYS2 in NCD-WT and DIO-WT mice. B, Densitometry values of GSK-3β in NCD-WT mice (n = 4). One-way ANOVA: P < .001. C, Densitometry values of GSK-3β in DIO-WT mice (n = 4). One-way ANOVA: P < .001. D, Densitometry values of GYS2 in NCD-WT mice (n = 4). One-way ANOVA: P < .01. E, Densitometry values of GYS2 in DIO-WT mice (n = 4). One-way ANOVA: P < .001. Tissues were from the same experiments as shown in Figures 1 and 2. *P < .05; †,‡P < .001; ns, not significant
FIGURE 10
FIGURE 10
Schematic diagram showing insulin and catestatin-mediated signalling pathways involved in the regulation of hepatic glucose and glycogen metabolism

Comment in

Similar articles

Cited by

References

    1. Martin BC, Warram JH, Krolewski AS, Bergman RN, Soeldner JS, Kahn CR. Role of glucose and insulin resistance in development of type 2 diabetes mellitus: results of a 25-year follow-up study. Lancet. 1992;340(8825):925–929. - PubMed
    1. Kahn SE, Hull RL, Utzschneider KM. Mechanisms linking obesity to insulin resistance and type 2 diabetes. Nature. 2006;444(7121):840–846. - PubMed
    1. Shoelson SE, Herrero L, Naaz A. Obesity, inflammation, and insulin resistance. Gastroenterology. 2007;132(6):2169–2180. - PubMed
    1. DeFronzo RA, Ferrannini E, Groop L, et al. Type 2 diabetes mellitus. Nat Rev Dis Primers. 2015;1:15019. - PubMed
    1. Menke A, Casagrande S, Geiss L, Cowie CC. Prevalence of and trends in diabetes among adults in the United States, 1988–2012. JAMA. 2015;314(10):1021–1029. - PubMed

Publication types