. 2022 Sep;18(9):2134-2149.
doi: 10.1080/15548627.2021.2020979. Epub 2022 Jan 5.

Restoration of mitophagy ameliorates cardiomyopathy in Barth syndrome

Affiliations

Restoration of mitophagy ameliorates cardiomyopathy in Barth syndrome

Jun Zhang et al. Autophagy. 2022 Sep.

Abstract

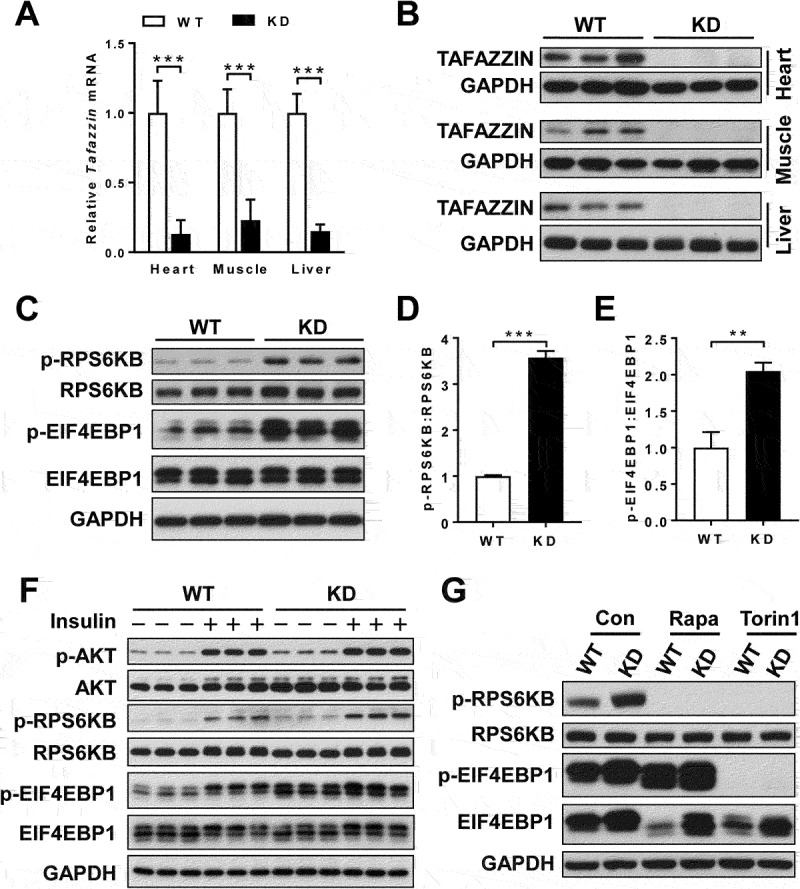
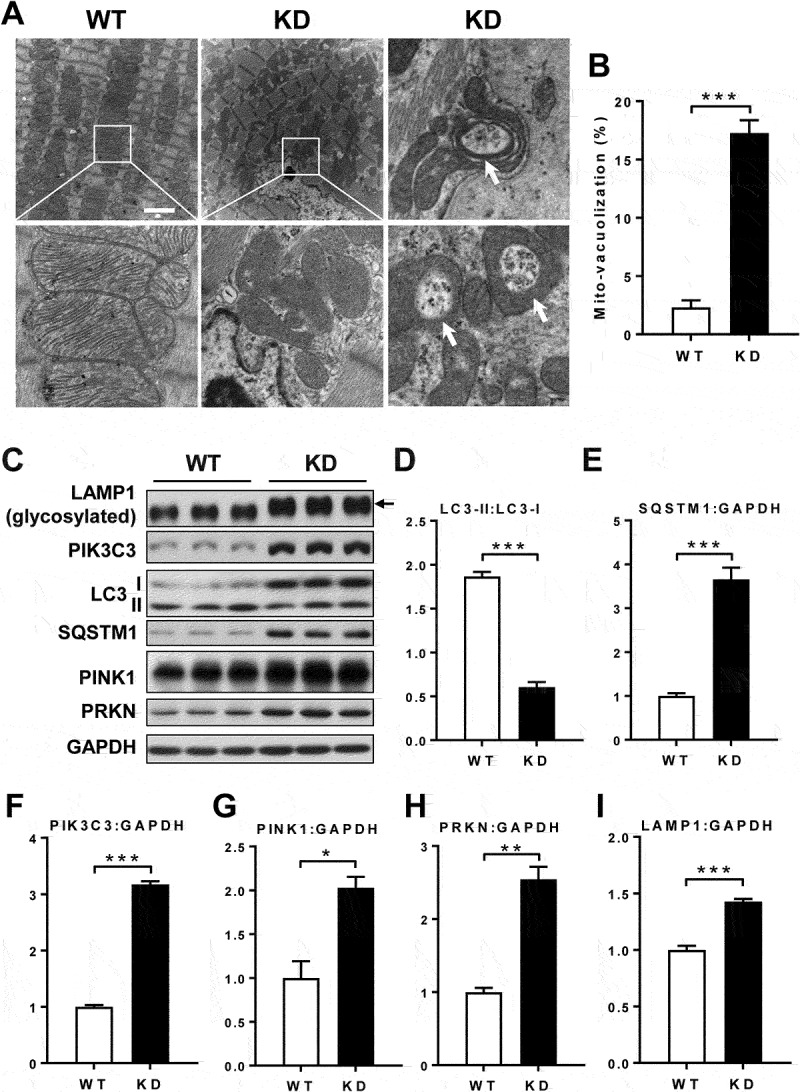
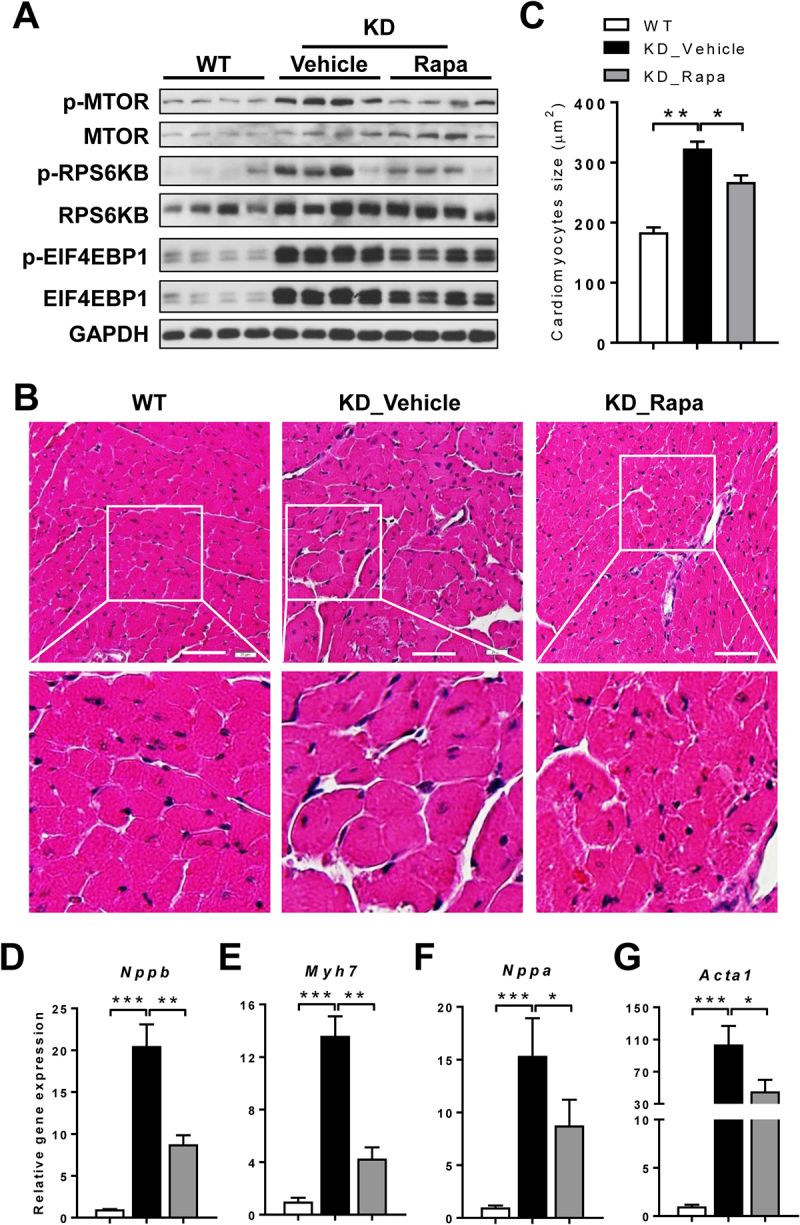
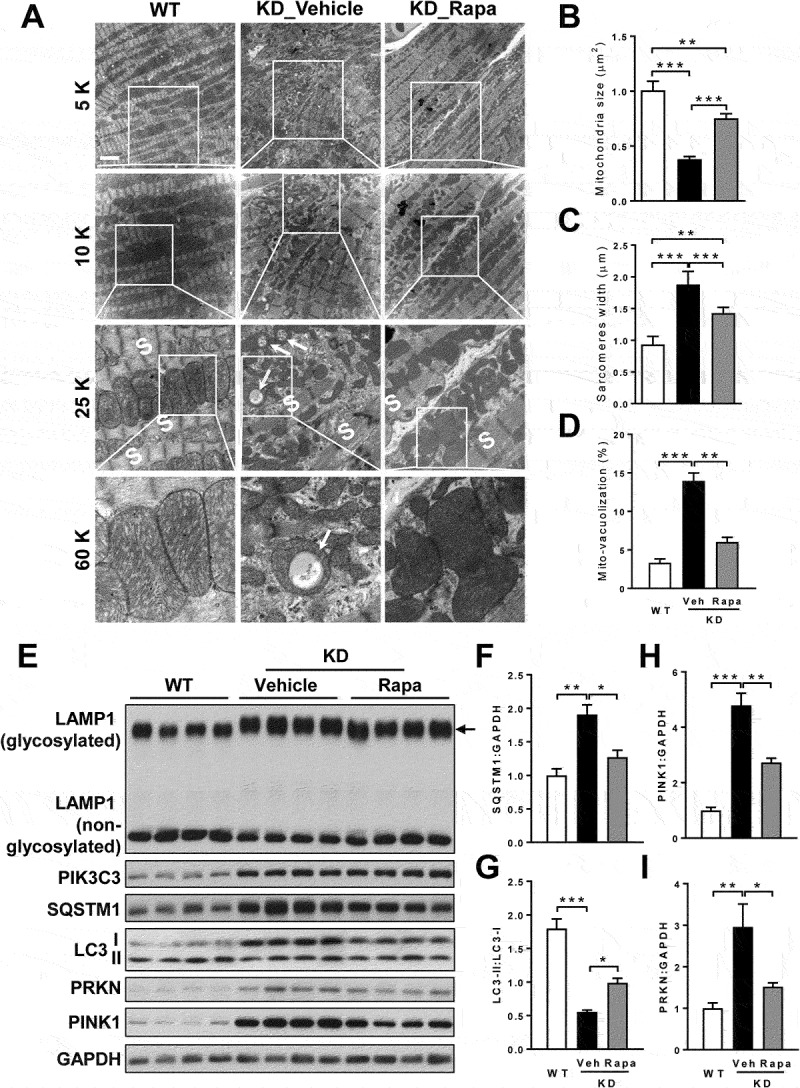
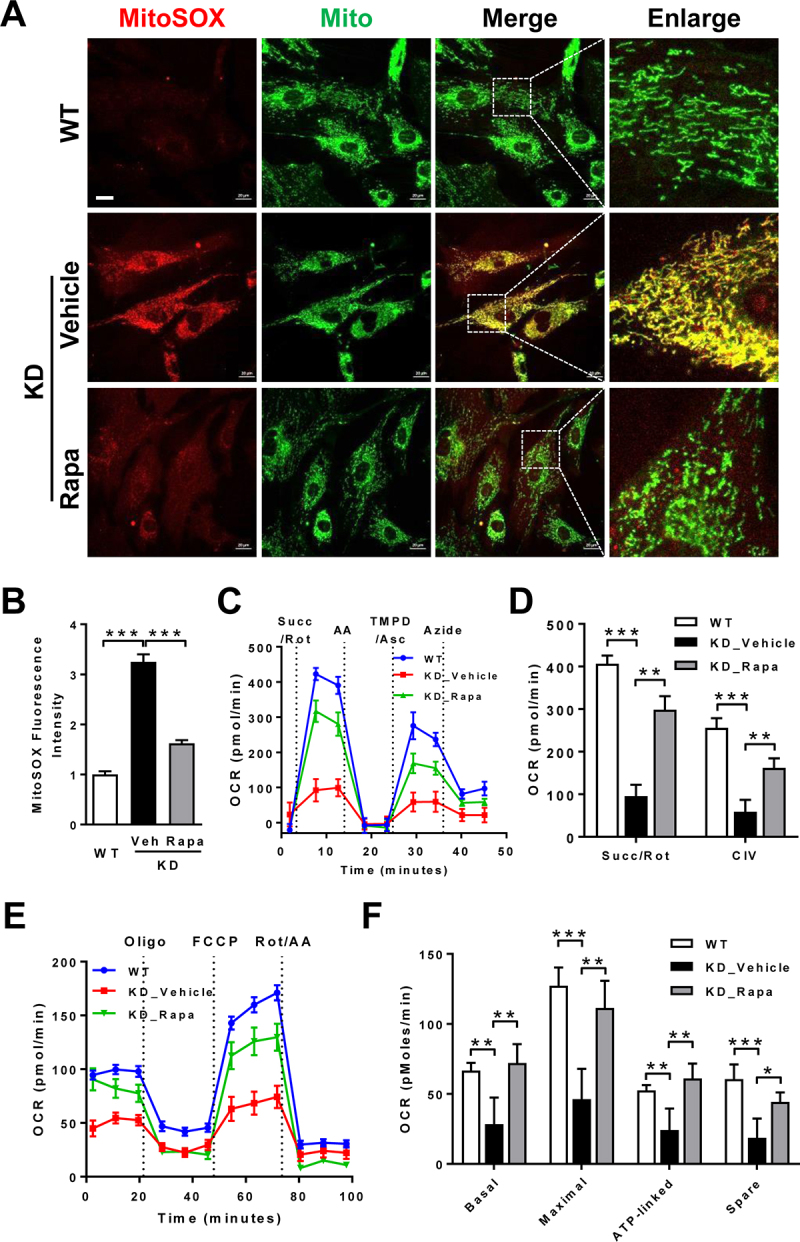
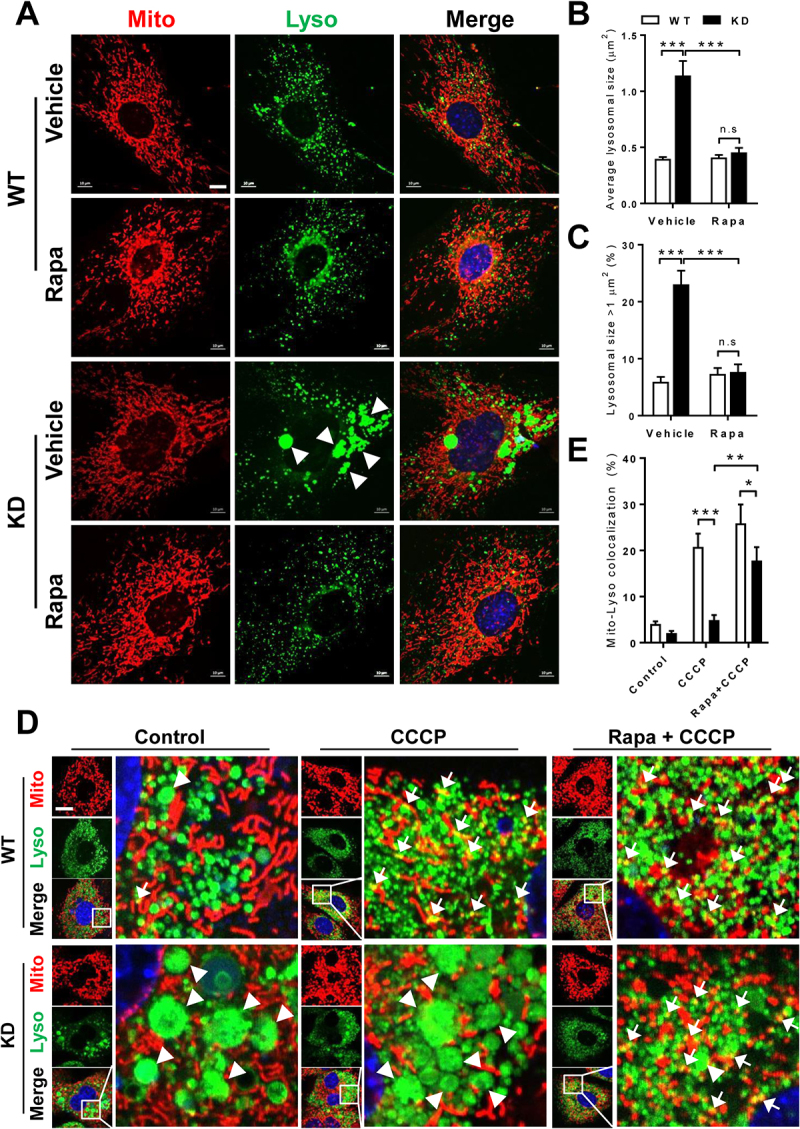
Barth syndrome (BTHS) is an X-linked genetic disorder caused by mutations in the TAFAZZIN/Taz gene which encodes a transacylase required for cardiolipin remodeling. Cardiolipin is a mitochondrial signature phospholipid that plays a pivotal role in maintaining mitochondrial membrane structure, respiration, mtDNA biogenesis, and mitophagy. Mutations in the TAFAZZIN gene deplete mature cardiolipin, leading to mitochondrial dysfunction, dilated cardiomyopathy, and premature death in BTHS patients. Currently, there is no effective treatment for this debilitating condition. In this study, we showed that TAFAZZIN deficiency caused hyperactivation of MTORC1 signaling and defective mitophagy, leading to accumulation of autophagic vacuoles and dysfunctional mitochondria in the heart of Tafazzin knockdown mice, a rodent model of BTHS. Consequently, treatment of TAFAZZIN knockdown mice with rapamycin, a potent inhibitor of MTORC1, not only restored mitophagy, but also mitigated mitochondrial dysfunction and dilated cardiomyopathy. Taken together, these findings identify MTORC1 as a novel therapeutic target for BTHS, suggesting that pharmacological restoration of mitophagy may provide a novel treatment for BTHS.Abbreviations: BTHS: Barth syndrome; CCCP: carbonyl cyanide 3-chlorophenylhydrazone; CL: cardiolipin; EIF4EBP1/4E-BP1: eukaryotic translation initiation factor 4E binding protein 1; GAPDH: glyceraldehyde-3-phosphate dehydrogenase; KD: knockdown; KO: knockout; LAMP1: lysosomal-associated membrane protein 1; LV: left ventricle; MAP1LC3/LC3: microtubule-associated protein 1 light chain 3; MEFs: mouse embryonic fibroblasts; MTORC1: mechanistic target of rapamycin kinase complex 1; OCR: oxygen consumption rate; PE: phosphatidylethanolamine; PIK3C3/VPS34: phosphatidylinositol 3-kinase catalytic subunit type 3; PINK1: PTEN induced putative kinase 1; PRKN/Parkin: parkin RBR E3 ubiquitin protein ligase; qRT-PCR: quantitative real-time polymerase chain reaction; RPS6KB/S6K: ribosomal protein S6 kinase beta; SQSTM1/p62: sequestosome 1; TLCL: tetralinoleoyl cardiolipin; WT: wild-type.

Keywords: BTHS; MTORC1; TAFAZZIN; cardiolipin; mitophagy; rapamycin.


Conflict of interest statement

No potential conflict of interest was reported by the author(s).

Figures

Figure 1.
Figure 1.
TAFAZZIN deficiency causes MTORC1 hyperactivation. (A) qRT-PCR analysis of Tafazzin mRNA expression in the heart, skeletal muscle, and liver of male WT and TAFAZZIN KD mice fed with water containing doxycycline (2 mg/mL) after weaning (21-days-old) for 2 months. (B) Western blot analysis of TAFAZZIN protein expression in the heart, skeletal muscle, and liver of WT and TAFAZZIN KD mice. (C) Western blot analysis of MTORC1 signaling pathways in the heart of WT and TAFAZZIN KD mice. (D and E) Statistical analysis of phosphorylated levels of RPS6KB (D) and EIF4EBP1 (E) in the heart of WT and TAFAZZIN KD mice. (F) Western blot analysis of AKT-MTORC1 signaling pathway in the heart of WT and TAFAZZIN KD mice in response to insulin stimulation. (G) Western blot analysis of MTORC1 activity in primary MEFs isolated from WT and TAFAZZIN KD mice. MEFs were cultured in medium containing doxycycline (1 μg/mL) for 3 days, and then treated with rapamycin (1 μM) or torin1 (1 μM) for 30 min. Data are represented as mean ± SD. **p < 0.01, ***p < 0.001 by Student’s t test.
Figure 2.
Figure 2.
TAFAZZIN deficiency leads to defective mitophagy in mice heart. (A) Electron microscopy analysis of cardiac mitochondrial morphology in WT and TAFAZZIN KD mice. Scale bar: 2 μm. (B) Quantification of autophagic vacuoles in the heart of WT and TAFAZZIN KD mice. n = 3 mice per group. (C) Western blot analysis of the expression of glycosylated LAMP1 and autophagic biomarkers, including PIK3C3, LC3, SQSTM1, PINK1, and PRKN, in the heart of WT and TAFAZZIN KD mice. (D) Statistical analysis of LC3-II:LC3-I ratio in the heart of WT and TAFAZZIN KD mice. (E-I) Quantification of the protein expression levels, including SQSTM1 (E), PIK3C3 (F), PINK1 (G), PRKN (H) and glycosylated LAMP1 (I), in the heart of WT and TAFAZZIN KD mice. Data are represented as mean ± SD. *p < 0.05, **p < 0.01, ***p < 0.001 by Student’s t test.
Figure 3.
Figure 3.
Rapamycin attenuates cardiomyopathy and LV dysfunction in TAFAZZIN KD mice. (A) Experimental outline of rapamycin administration in TAFAZZIN KD mice. (B) Representative images of the echocardiographic analysis of cardiac function of WT and TAFAZZIN KD mice fed with control or rapamycin diet. LVID-s and LVID-d, LV internal diameter at end systole and at end diastole, respectively. (C and D) Echocardiographic analysis of LV ejection fraction (EF, C) and fractional shortening (FS, D) in WT and TAFAZZIN KD mice. (E-J) Echocardiographic analysis of LVID-s (E), LVID-d (F), interventricular septum thickness at end systole (IVS-s, G) and at end diastole (IVS-d, H), and LV posterior wall thickness at end systole (LVPW-s, I) and at end diastole (LVPW-d, J) of WT and TAFAZZIN KD mice fed with control or rapamycin diet. n = 5–8. Data are represented as mean ± SD. *p < 0.05, **p < 0.01, ***p < 0.001 by one-way ANOVA. n.s, no significance.
Figure 4.
Figure 4.
Rapamycin attenuates cardiomyocyte hypertrophy through inhibition of MTORC1 signaling. (A) Western blot analysis of MTORC1 signaling pathways in the heart of WT and TAFAZZIN KD mice fed with control or rapamycin diet. (B) H&E staining of the LV sections of WT and TAFAZZIN KD mice. Scale bar: 40 μm. (C) Quantitative analysis of cardiomyocytes size of WT and TAFAZZIN KD mice fed with control or rapamycin diet. n = 3 mice per group, 100 cells per mouse were used for quantification analysis. (D-G) qRT-PCR analysis of mRNA levels of major biomarkers associated with hypertrophic cardiomyopathy, including Nppb (D), Myh7 (E), Nppa (F), and Acta1 (G) in the heart of WT and TAFAZZIN KD mice fed with control or rapamycin diet. Data are represented as mean ± SD. *p < 0.05, **p < 0.01, ***p < 0.001 by one-way ANOVA.
Figure 5.
Figure 5.
Rapamycin mitigates autophagic vacuoles and restores mitophagy in the heart of TAFAZZIN KD mice. (A) Electron microscopy analysis of cardiac mitochondrial morphology in the WT and TAFAZZIN KD mice fed with control or rapamycin diet. Scale bar: 4 μm. Arrows highlight the mitochondria with vacuole. S, sarcomere. (B) Quantitative analysis of cardiac mitochondrial size. n = 3 mice per group, and 100 mitochondria per mouse were counted. (C) Statistical analysis of sarcomere width in the heart of WT and TAFAZZIN KD mice fed with control or rapamycin diet. (D) Quantitative analysis of autophagic vacuoles in the heart of WT and TAFAZZIN KD mice fed with control or rapamycin diet. n = 3 mice per group, and 100 mitochondria per mouse were counted. (E) Western blot analysis of LAMP1 and biomarkers associated with autophagy and mitophagy, including PIK3C3, LC3, SQSTM1, PINK1 and PRKN, in the heart of WT and TAFAZZIN KD mice fed with control or rapamycin diet. (F-I) Statistical analysis of protein expression levels, including SQSTM1 (F), LC3-II:LC3-I ratio (G), PINK1 (H), and PRKN (I), in the heart of WT and TAFAZZIN KD mice fed with control or rapamycin diet. n = 4. Data are represented as mean ± SD. *p < 0.05, **p < 0.01, ***p < 0.001 by one-way ANOVA.
Figure 6.
Figure 6.
Rapamycin attenuates mitochondrial superoxide anions production and restores mitochondrial respiration in TAFAZZIN-deficient cells. (A) Confocal imaging analysis of the mitochondrial superoxide anions in primary WT and TAFAZZIN KD MEFs. MEFs were cultured in the presence or absence of rapamycin (1 μM) or vehicle for 4 h, followed by staining with MitoTracker Green and MitoSOX Red. Scale bar: 20 μm. (B) Quantitative analysis of MitoSOX Red fluorescence intensity. All images were taken at the same settings, and the MitoSOX Red intensity was analyzed using ImageJ software. n > 30 cells per group. (C) Seahorse analysis of OCR in isolated mitochondria from the heart of WT and TAFAZZIN KD mice. The OCRs were measured from equal amount of mitochondria isolated from frozen heart samples in response to succinate/rotenone (Succ/Rot), antimycin A (AA), TMPD/ascorbate (TPMD/Asc), and sodium azide treatment. n = 6–7 per group. (D) Quantitative analysis of Succ/Rot- and TMPD/Asc (complex IV, CIV)-dependent respiration in isolated mitochondria from frozen heart samples shown in panel C. (E) Seahorse analysis of mitochondrial OCR in primary WT and TAFAZZIN KD MEFs in response to treatment with rapamycin (1 μM) or vehicle for 4 h. The OCR was normalized by protein concentration in each sample. (F) Quantitative analysis of OCR from basal, maximal, and ATP-linked respiration, as well as spare capacity in primary MEFs shown in panel E. Data are represented as mean ± SD. *p < 0.05, **p < 0.01, ***p < 0.001 by one-way ANOVA.
Figure 7.
Figure 7.
Rapamycin restores lysosomal morphology and mitophagy in TAFAZZIN KD MEFs. (A) Confocal imaging analysis of lysosomal morphology in MEFs. Primary MEFs from TAFAZZIN KD and WT mice were treated with rapamycin (1 μM) or vehicle for 4 h, followed by staining with MitoTracker Red and LysoTracker Green to label mitochondria and lysosomes, respectively. Scale bar: 10 μm. Arrow heads highlight the enlarged lysosomes. (B and C) Quantitative analysis of the average size of lysosomes (B) and the percentage of enlarged lysosomes (>1 μm2) (C) in WT and TAFAZZIN KD MEFs in response to rapamycin treatment. n > 15 cells per group. (D) Confocal imaging analysis of the mitolysosomes formation in MEFs in response to induction of mitophagy by CCCP (20 μM) for 1 h. For rapamycin treatment, cells were pre-treated with rapamycin (1 μM) for 3 h, followed by CCCP treatment. Scale bar: 20 μm. Arrow heads highlight the enlarged lysosomes, and arrows highlight the co-localization of MitoTracker Red with LysoTracker Green. (E) Quantitative analysis of the co-localization of MitoTracker Red with LysoTracker Green in MEFs in response to CCCP and rapamycin treatment. n = 50 cells per group. Data are represented as mean ± SD. *p < 0.05, **p < 0.01, ***p < 0.001 by two-way ANOVA. n.s, no significance.

Similar articles

Cited by

References

    1. Barth PG, Scholte HR, Berden JA, et al. An X-linked mitochondrial disease affecting cardiac muscle, skeletal muscle and neutrophil leucocytes. J Neurol Sci. 1983. Dec;62(1–3):327–355. - PubMed
    1. Lu YW, Galbraith L, Herndon JD, et al. Defining functional classes of Barth syndrome mutation in humans. Hum Mol Genet. 2016 May 1;25(9):1754–1770. - PMC - PubMed
    1. Claypool SM, McCaffery JM, Koehler CM.. Mitochondrial mislocalization and altered assembly of a cluster of Barth syndrome mutant tafazzins. J Cell Biol. 2006 Jul 31;174(3):379–390. - PMC - PubMed
    1. Xu Y, Malhotra A, Ren M, et al. The enzymatic function of tafazzin. J Biol Chem. 2006 Dec 22;281(51):39217–39224. - PubMed
    1. Gebert N, Joshi AS, Kutik S, et al. Mitochondrial cardiolipin involved in outer-membrane protein biogenesis: implications for Barth syndrome. Curr Biol. 2009 Dec 29;19(24):2133–2139. - PMC - PubMed

Publication types