. 2022 Jan 1;29(Pt 1):53-66.
doi: 10.1107/S1600577521012091. Epub 2022 Jan 1.

Opportunities and challenges of applying advanced X-ray spectroscopy to actinide and lanthanide N-donor ligand systems

Affiliations

Opportunities and challenges of applying advanced X-ray spectroscopy to actinide and lanthanide N-donor ligand systems

Tim Pruessmann et al. J Synchrotron Radiat. .

Abstract

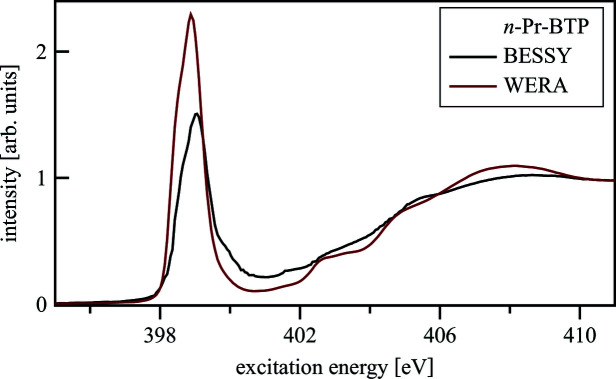
N-donor ligands such as n-Pr-BTP [2,6-bis(5,6-dipropyl-1,2,4-triazin-3-yl)pyridine] preferentially bind trivalent actinides (An3+) over trivalent lanthanides (Ln3+) in liquid-liquid separation. However, the chemical and physical processes responsible for this selectivity are not yet well understood. Here, an explorative comparative X-ray spectroscopy and computational (L3-edge) study for the An/Ln L3-edge and the N K-edge of [An/Ln(n-Pr-BTP)3](NO3)3, [Ln(n-Pr-BTP)3](CF3SO3)3 and [Ln(n-Pr-BTP)3](ClO4)3 complexes is presented. High-resolution X-ray absorption near-edge structure (HR-XANES) L3-edge data reveal additional features in the pre- and post-edge range of the spectra that are investigated using the quantum chemical codes FEFF and FDMNES. X-ray Raman spectroscopy studies demonstrate the applicability of this novel technique for investigations of liquid samples of partitioning systems at the N K-edge.

Keywords: CC-RIXS; HR-XANES; X-ray Raman; actinides; lanthanides; partitioning.


Figures

Figure 1
Figure 1
Simplified MO scheme of An/Ln bound to N and the excitations causing the pre-edge (red), WL (blue) and EXAFS (green) features observed in An/Ln L 3-edge spectra.
Figure 2
Figure 2
Standard and HR-XANES of [Eu(n-Pr-BTP)3](OTf)3.
Figure 3
Figure 3
Gd L 3-edge HR-XANES of [Gd(n-Pr-BTP)3](OTf)3 measured at the Gd L α1 and L β2 emission line.
Figure 4
Figure 4
Normalized 2p3d (a) and 2p4d (b) RIXS pre-edge maps of [Gd(n-Pr-BTP)3](OTf)3 with XANES position (red line).
Figure 5
Figure 5
Calculations of [Eu(n-Pr-BTP)3](OTf)3 with FEFF and FDMNES with FMS and FP compared with the experimental spectrum.
Figure 6
Figure 6
Calculations of [Eu(n-Pr-BTP)3](OTf)3 with FEFF and FDMNES with experimental and DFT optimized structures compared with the experimental spectrum.
Figure 7
Figure 7
[Gd(n-Pr-BTP)3](OTf)3 experimental spectrum compared with Gd(H-BTP)3 spectra calculated with FEFF and FDMNES for DFT optimized structures with symmetry restrictions (structure 1), without symmetry restrictions (structure 2) and without symmetry restrictions and a solvation sphere (structure 3).
Figure 8
Figure 8
Angles (a) and (b) describing the in-plane and out-of-plane angles of the triazine rings compared with the pyridine rings.
Figure 9
Figure 9
FEFF shell-by-shell calculations of Gd(H-BTP)3 compared with an experimental [Gd(n-Pr-BTP)3](OTf)3 spectrum (a) and the four shells used in the shell-by-shell calculations (b).
Figure 10
Figure 10
Gd L 3-edge HR-XANES of [Gd(n-Pr-BTP)3](NO3)3 and Gd(NO3)3 (a) and [Gd(n-Pr-BTP)3](OTf)3 and Gd(OTf)3 (b).
Figure 11
Figure 11
Pre-edge calculated with FEFF9.5 (a) and FDMNES (b) for Gd(H-BTP)3, including Gd f -, d-DOS compared with experimental spectra of [Gd(n-Pr-BTP)3](OTf)3.
Figure 12
Figure 12
Pu L 3-edge HR-XANES of [Pu(n-Pr-BTP)3](NO3)3 and Pu(NO3)3; Pu L 3-edge XANES of [Pu(n-Pr-BTP)3](NO3)3; FDMNES calculations of Pu(H-BTP)3 XANES and DOS.
Figure 13
Figure 13
Am L 3-edge HR-XANES of [Am(n-Pr-BTP)3](NO3)3 and Am(NO3)3.
Figure 14
Figure 14
Experimental spectra of [Pu(n-Pr-BTP)3](NO3)3 and [Am(n-Pr-BTP)3](NO3)3 (a) and spectra calculated with FDMNES of Pu(H-BTP)3 and Am(H-BTP)3 (b).
Figure 15
Figure 15
N K-edge spectra of [Ho(n-Pr-BTP)3](NO3)3 measured in different detection modes.
Figure 16
Figure 16
N K-edge spectra of n-Pr-BTP measured in PEY at the UE52-PGM beamline at BESSY and at the WERA beamline at KARA.
Figure 17
Figure 17
The effects of radiation damage in [Ho(n-Pr-BTP)3](ClO4)3 N K-edge spectra after irradiation of the samples.
Figure 18
Figure 18
The contribution of formula image to [Ln(n-Pr-BTP)3](NO3)3 N K-edge spectra.
Figure 19
Figure 19
O K-edge spectra of iso­propanol (a) and water (b). N K-edge spectrum of n-Pr-BTP (c).
Figure 20
Figure 20
N K-edge spectra of n-Pr-BTP crystalline and in iso­propanol solution.

References

    1. Asakura, H., Shishido, T., Fuchi, S., Teramura, K. & Tanaka, T. (2014). J. Phys. Chem. C, 118, 20881–20888.
    1. Asakura, H., Shishido, T., Teramura, K. & Tanaka, T. (2015). J. Phys. Chem. C, 119, 8070–8077.
    1. Banik, N. L., Schimmelpfennig, B., Marquardt, C. M., Brendebach, B., Geist, A. & Denecke, M. A. (2010). Dalton Trans. 39, 5117–5122. - PubMed
    1. Bartolomé, F., Krisch, M. H., Raoux, D. & Tonnerre, J.-M. (1999). Phys. Rev. B, 60, 13497–13506.
    1. Bartolomé, F., Tonnerre, J. M., Sève, L., Raoux, D., Chaboy, J., García, L. M., Krisch, M. & Kao, C. C. (1997). Phys. Rev. Lett. 79, 3775–3778.