. 2022 Mar 9;96(5):e0208621.
doi: 10.1128/jvi.02086-21. Epub 2022 Jan 5.

Activation of the MKK3-p38-MK2-ZFP36 Axis by Coronavirus Infection Restricts the Upregulation of AU-Rich Element-Containing Transcripts in Proinflammatory Responses

Affiliations

Activation of the MKK3-p38-MK2-ZFP36 Axis by Coronavirus Infection Restricts the Upregulation of AU-Rich Element-Containing Transcripts in Proinflammatory Responses

Shumin Li et al. J Virol. .

Abstract

Coronavirus infections induce the expression of multiple proinflammatory cytokines and chemokines. We have previously shown that in cells infected with gammacoronavirus infectious bronchitis virus (IBV), interleukin 6 (IL-6), and IL-8 were drastically upregulated, and the MAP kinase p38 and the integrated stress response pathways were implicated in this process. In this study, we report that coronavirus infection activates a negative regulatory loop that restricts the upregulation of a number of proinflammatory genes. As revealed by the initial transcriptomic and subsequent validation analyses, the anti-inflammatory adenine-uridine (AU)-rich element (ARE)-binding protein, zinc finger protein 36 (ZFP36), and its related family members were upregulated in cells infected with IBV and three other coronaviruses, alphacoronaviruses porcine epidemic diarrhea virus (PEDV), human coronavirus 229E (HCoV-229E), and betacoronavirus HCoV-OC43, respectively. Characterization of the functional roles of ZFP36 during IBV infection demonstrated that ZFP36 promoted the degradation of transcripts coding for IL-6, IL-8, dual-specificity phosphatase 1 (DUSP1), prostaglandin-endoperoxide synthase 2 (PTGS2) and TNF-α-induced protein 3 (TNFAIP3), through binding to AREs in these transcripts. Consistently, knockdown and inhibition of JNK and p38 kinase activities reduced the expression of ZFP36, as well as the expression of IL-6 and IL-8. On the contrary, overexpression of mitogen-activated protein kinase kinase 3 (MKK3) and MAPKAP kinase-2 (MK2), the upstream and downstream kinases of p38, respectively, increased the expression of ZFP36 and decreased the expression of IL-8. Taken together, this study reveals an important regulatory role of the MKK3-p38-MK2-ZFP36 axis in coronavirus infection-induced proinflammatory response. IMPORTANCE Excessive and uncontrolled induction and release of proinflammatory cytokines and chemokines, the so-called cytokine release syndrome (CRS), would cause life-threatening complications and multiple organ failure in severe coronavirus infections, including severe acute respiratory syndrome (SARS), Middle East respiratory syndrome (MERS) and COVID-19. This study reveals that coronavirus infection also induces the expression of ZFP36, an anti-inflammatory ARE-binding protein, promoting the degradation of ARE-containing transcripts coding for IL-6 and IL-8 as well as a number of other proteins related to inflammatory response. Furthermore, the p38 MAP kinase, its upstream kinase MKK3 and downstream kinase MK2 were shown to play a regulatory role in upregulation of ZFP36 during coronavirus infection cycles. This MKK3-p38-MK2-ZFP36 axis would constitute a potential therapeutic target for severe coronavirus infections.

Keywords: ARE-binding proteins; MK2 kinase; MKK3 kinase; ZFP36; coronavirus; p38 MAPK; proinflammatory cytokines and chemokines.


Conflict of interest statement

The authors declare no conflict of interest.

Figures
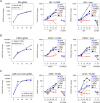
FIG 1
FIG 1
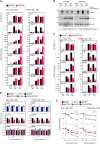
ZFP36 and related ARE-binding proteins are induced by coronavirus infection. H1299 and Vero cells were infected with IBV, PEDV, HCoV-OC43, and HCoV-229E at MOI∼2 or mock-treated with UV-inactivated viruses. Cells were harvested at the indicated time points and total RNAs were extracted for RT-qPCR. The levels of IBV, PEDV, HCoV-OC43, and HCoV-229E genomic RNA (CoV gRNA), and the mRNA levels of ZFP36 family (ZFP36, ZFP36L1, and ZFP36L2), other ARE-binding proteins (AUF1/BRF1), IL-6 and IL-8 were determined by the ΔΔCt method using the GAPDH mRNA from virus-infected cells harvested at 0 hpi for normalization.
FIG 2
FIG 2
ZFP36 regulates the expression of IL-6, IL-8 and other genes related to proinflammatory response during IBV infection. A. H1299 and Vero cells were transfected with siEGFP and siZFP36 before being infected with IBV at an MOI of ∼2. Cells were harvested at the indicated time points and lysates were prepared for RNA extraction or by three freeze/thaw cycles. Equal amounts of total RNA were reverse-transcribed, and the mRNA levels of ZFP36, IL-6, IL-8, DUSP1, PTGS2, and TNFAIP3 were determined by the ΔΔCt method using the GAPDH mRNA extracted from siEGFP-transfected and mock-infected cells harvested at 16 hpi for normalization. Virus titers were expressed in units of log TCID50 per ml. Significance levels were presented by the P value (ns, nonsignificant; *, P < 0.05; **, P < 0.01; ***, P < 0.001). N.D., non-determined. B. H1299 and Vero cells were transfected with pXJ40 and pXJ40-ZFP36 before being infected with IBV at an MOI of ∼2 or mock-infected (M). Cells were harvested at the indicated time points and subjected to Western blot analysis using the indicated antibodies. Beta-actin was included as the loading control. Sizes of protein ladders in kDa are indicated on the left. C. Total RNA samples were extracted from cells in (B) and subjected to RT-qPCR. The levels of IL-8, DUSP1, PTGS2, and TNFAIP3 were determined by the ΔΔCt method using the GAPDH mRNA extracted from pXJ40-transfected and mock-infected cells at 16 hpi for normalization. Total lysates were prepared from cells harvested in (B) at the indicated time points by three freeze/thaw cycles. Virus titers were determined and expressed in units of log TCID50 per ml. Significance levels were presented by the P value (ns, nonsignificant; *, P < 0.05; **, P < 0.01; ***, P < 0.001). N.D., non-determined. D. Vero and H1299 cells were either untransfected or transfected with siEGFP, siZFP36, pXJ40, or pXJ40-ZFP36, respectively. Cells were then infected with IBV at an MOI of 2, and treated with actinomycin D (Act D) (10 μM/ml) and DMSO at 16 h postinfection. Total RNA samples were extracted at the indicated time points and subjected to RT-qPCR analysis. The levels of IBV gRNA and ZFP36 were determined by the ΔΔCt method using the GAPDH mRNA extracted from pXJ40 or siEGFP-transfected and IBV-infected cells at 0 h before treatment with actinomycin D for normalization. Significance levels were presented by the P value (ns, nonsignificant; *, P < 0.05; **, P < 0.01; ***, P < 0.001). N.D., non-determined. E. Total RNA samples were extracted from cells in (D) and subjected to RT-qPCR. The levels of IL-8 were determined by the ΔΔCt method using the GAPDH mRNA extracted from pXJ40 or siEGFP-transfected and IBV-infected cells at 0 h before treatment with actinomycin D for normalization.
FIG 3
FIG 3
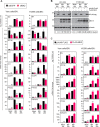
ZFP36 regulates the expression of IL-6, IL-8 and other genes related to proinflammatory response during PEDV, HCoV-229E and HCoV-OC43 infection. A. H1299 and Vero cells were transfected with siEGFP and siZFP36 before being infected with PEDV, HCoV-229E and HCoV-OC43 at MOI∼2. Total RNA samples were extracted at the indicated time points. Equal amounts of total RNA were reverse-transcribed, and the mRNA levels of gRNA, ZFP36, IL-6, IL-8, DUSP1, PTGS2, and TNFAIP3 were determined by the ΔΔCt method using the GAPDH mRNA extracted from siEGFP-transfected and mock-infected cells harvested at 36 hpi for normalization. Significance levels were presented by the P value (ns, nonsignificant; *, P < 0.05; **, P < 0.01; ***, P < 0.001). N.D., non-determined. B. H1299 and Vero cells were transfected with pXJ40 and pXJ40-ZFP36 before being infected with PEDV, HCoV-229E, and HCoV-OC43 at MOI∼2 or mock-infected (M). Total RNA samples were extracted at the indicated time points. Equal amounts of total RNA were reverse-transcribed, and the mRNA levels of gRNA, ZFP36, IL-6, IL-8, DUSP1, PTGS2, and TNFAIP3 were determined by the ΔΔCt method using the GAPDH mRNA extracted from siEGFP-transfected and mock-infected cells harvested at 36 hpi for normalization. Significance levels were presented by the P value (ns, nonsignificant; *, P < 0.05; **, P < 0.01; ***, P < 0.001). N.D., non-determined.
FIG 4
FIG 4
The RNA-binding activity of ZFP36 is required for its regulatory function on gene expression. A. H1299 and Vero cells were transfected with pXJ40, pXJ40-ZFP36, pXJ40-ZFP36-C124R, and pXJ40-ZFP36-C174R, respectively, before being infected with IBV at MOI∼2 or mock-infected (M). Cells were harvested at the indicated time points and subjected to Western blot analysis using the indicated antibodies. Beta-actin was included as the loading control. Sizes of protein ladders in kDa were indicated on the left. B. Total RNA samples were extracted from cells in (A) and subjected to RT-qPCR. The levels of IL-8, DUSP1, PTGS2, and TNFAIP3 were determined by the ΔΔCt method using the GAPDH mRNA extracted from pXJ40-transfected and mock-infected cells at 16 hpi for normalization. The lysates were prepared from cells harvested in (A) at the indicated time points by three freeze/thaw cycles. Virus titers were determined and expressed in the unit of log TCID50 per ml. Significance levels were presented by the P value (ns, nonsignificant; *, P < 0.05; **, P < 0.01; ***, P < 0.001). N.D., non-determined.
FIG 5
FIG 5
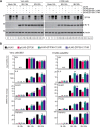
Induction of ZFP36 and IL-8 by IBV infection was dependent on the activation of p38 and JNK. A. H1299 cells were transfected with siEGFP, sip38, siJNK and siERK before being infected with IBV at MOI∼2, cells were harvested at the indicated time points and subjected to Western blot analysis using the indicated antibodies. Beta-actin was included as the loading control. Sizes of protein ladders in kDa were indicated on the left. B. Total RNA samples were extracted from cells in (A) and subjected to RT-qPCR. The levels of ZFP36, IL-6 and IL-8 were determined by the ΔΔCt method using the GAPDH mRNA extracted from siEGFP-transfected and mock-infected cells at 16 hpi for normalization. The cells lysates were harvested from cells in (A) at the indicated time points by three freeze/thaw cycles, and virus titers were determined and expressed in the unit of log TCID50 per ml. Significance levels were presented by the P value (ns, nonsignificant; *, P < 0.05; **, P < 0.01; ***, P < 0.001). N.D., non-determined. C. H1299 and DF1 cells were infected with IBV at MOI∼2 and treated with indicated concentrations of SB-203580 or the same volume of DMSO at 2 hpi. Total RNAs were extracted and subjected to RT-qPCR. The levels of MK2, ZFP36, IL-6, IL-8, and IBV genomic RNA were determined by the ΔΔCt method using the GAPDH mRNA extracted from infected and DMSO-treated cells at 0 hpi for normalization. Significance levels were presented by the P value (ns, nonsignificant; *, P < 0.05; **, P < 0.01; ***, P < 0.001). N.D., non-determined. D. H1299 and DF1 cells were treated with SP600125 as in (C). Total RNAs were extracted and subjected to RT-qPCR. The levels of MK2, ZFP36, IL-6, IL-8, and IBV genomic RNA were determined by the ΔΔCt method using the GAPDH mRNA extracted from infected and DMSO-treated cells at 0 hpi for normalization. Significance levels were presented by the P value (ns, nonsignificant; *, P < 0.05; **, P < 0.01; ***, P < 0.001). N.D., non-determined.
FIG 6
FIG 6
ZFP36 acts as a negative regulator controlling the expression of IL-6, IL-8 and other genes related to proinflammatory response during IBV and HCoV-43 infections. A. H1299 cells were transfected with pXJ40 and pXJ40-ZFP36 before being infected with IBV or HCoV-OC43 at MOI∼2 and treated with indicated concentrations of SB-203580 at 2 hpi. Total RNA samples were extracted from cells at the indicated time points and subjected to RT-qPCR. The levels of IL-6, IL-8, DUSP1, PTGS2, TNFAIP3, and IBV or HCoV-OC43 gRNA were determined by the ΔΔCt method using the GAPDH mRNA extracted from pXJ40-transfected and infected as well as p38 inhibitor-treated cells at 8 hpi for normalization. Significance levels were presented by the P value (ns, nonsignificant; *, P < 0.05; **, P < 0.01; ***, P < 0.001). N.D., non-determined. B. H1299 cells were treated with SP600125 as in (A). Total RNA samples were extracted from cells at the indicated time points and subjected to RT-qPCR. The levels of IL-6, IL-8, DUSP1, PTGS2, TNFAIP3, and IBV or HCoV-OC43 genomic RNA were determined by the ΔΔCt method using the GAPDH mRNA extracted from pXJ40-transfected and infected as well as JNK inhibitor-treated cells at 8 hpi for normalization. Significance levels were presented by the P value (ns, nonsignificant; *, P < 0.05; **, P < 0.01; ***, P < 0.001). N.D., non-determined.
FIG 7
FIG 7
MK2 activates the expression of ZFP36, IL-8 and other genes related to proinflammatory response during IBV infection. A. H1299 and Vero cells were transfected with siEGFP and siMK2 before being infected with IBV at MOI∼2. Cells were harvested at the indicated time points for RNA extraction or by three freeze/thaw cycles. Equal amounts of total RNA were reverse-transcribed, and the mRNA expression levels of MK2, ZFP36, IL-6, IL-8, DUSP1, PTGS2, and TNFAIP3 were determined by the ΔΔCt method using the GAPDH mRNA extracted from siEGFP-transfected and mock-infected cells at 16 hpi for normalization. Virus titers were determined and expressed in the unit of log TCID50 per ml. Significance levels were presented by the P value (ns, nonsignificant; *, P < 0.05; **, P < 0.01; ***, P < 0.001). N.D., non-determined. B. H1299 and Vero cells were transfected with pXJ40-FLAG and pXJ40-FLAG-MK2 before being infected with IBV at MOI∼2 or mock infected (M). Cells were harvested at the indicated time points and subjected to Western blot analysis using the indicated antibodies. Beta-actin was included as the loading control. Sizes of protein ladders in kDa were indicated on the left. C. Total RNA samples were extracted from cells in (B) and subjected to RT-qPCR. The levels of ZFP36, IL-8, DUSP1, PTGS2, and TNFAIP3 were determined by the ΔΔCt method using the GAPDH mRNA extracted from pXJ40-transfected and mock-infected cells at 16 hpi for normalization. Virus titers were determined from cells lysates harvested in (B) at the indicated time points by three freeze/thaw cycles and expressed in the unit of log TCID50 per ml. Significance levels were presented by the P value (ns, nonsignificant; *, P < 0.05; **, P < 0.01; ***, P < 0.001). N.D., non-determined.
FIG 8
FIG 8
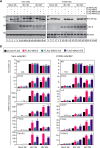
MKK3 activates the expression of ZFP36, IL-8 and other genes related to proinflammatory. A. H1299 and Vero cells were transfected with pXJ40-FLAG, pXJ40-FLAG-MKK3, pXJ40-FLAG-MKK3-AA, and pXJ40-FLAG-MKK3-EE, before being infected with IBV at MOI∼2 or mock-infected (M). Cells were harvested at the indicated time points and subjected to Western blot analysis using the indicated antibodies. Beta-actin was included as the loading control. Sizes of protein ladders in kDa were indicated on the left. B. Total RNAs were extracted from cells in (A) and subjected to RT-qPCR. The levels of ZFP36, IL-8, DUSP1, PTGS2, and TNFAIP3 were determined by the ΔΔCt method using the GAPDH mRNA extracted from pXJ40-FLAG-transfected and mock-infected cells at 16 hpi for normalization. Virus titers were determined from cell lysates harvested in (A) at the indicated time points by three freeze/thaw cycles and expressed in the unit of log TCID50 per ml. Significance levels were presented by the P value (ns, nonsignificant; *, P < 0.05; **, P < 0.01; ***, P < 0.001). N.D., non-determined.
FIG 9
FIG 9
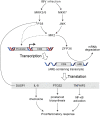
Diagram illustrating the current working model. The working model showing the induction of proinflammatory cytokines and chemokines by MKK3-p38-MK2-ZFP36 axis during coronavirus infection. Pointed and blunt arrows denote activation and suppression, respectively. Dotted lines denote processes that are not fully characterized.

Similar articles

Cited by

References

    1. Fung TS, Liu DX. 2019. Human coronavirus: host-pathogen interaction. Annu Rev Microbiol 73:529–557. 10.1146/annurev-micro-020518-115759. - DOI - PubMed
    1. Fung TS, Liu DX. 2021. Similarities and dissimilarities of COVID-19 and other coronavirus diseases. Annu Rev Microbiol 75:19–47. 10.1146/annurev-micro-110520-023212. - DOI - PubMed
    1. Mackay IM, Arden KE. 2015. MERS coronavirus: diagnostics, epidemiology and transmission. Virol J 12:222. 10.1186/s12985-015-0439-5. - DOI - PMC - PubMed
    1. Atzrodt CL, Maknojia I, McCarthy RDP, Oldfield TM, Po J, Ta KTL, Stepp HE, Clements TP. 2020. A guide to COVID-19: a global pandemic caused by the novel coronavirus SARS-CoV-2. FEBS J 287:3633–3650. 10.1111/febs.15375. - DOI - PMC - PubMed
    1. Xia L, Yang Y, Wang J, Jing Y, Yang Q. 2018. Impact of TGEV infection on the pig small intestine. Virol J 15:102. 10.1186/s12985-018-1012-9. - DOI - PMC - PubMed

Publication types

MeSH terms