Review
. 2022 Jan 5;20(1):e3001508.
doi: 10.1371/journal.pbio.3001508. eCollection 2022 Jan.

Comparative genomics reveals electron transfer and syntrophic mechanisms differentiating methanotrophic and methanogenic archaea

Affiliations
Review

Comparative genomics reveals electron transfer and syntrophic mechanisms differentiating methanotrophic and methanogenic archaea

Grayson L Chadwick et al. PLoS Biol. .

Abstract

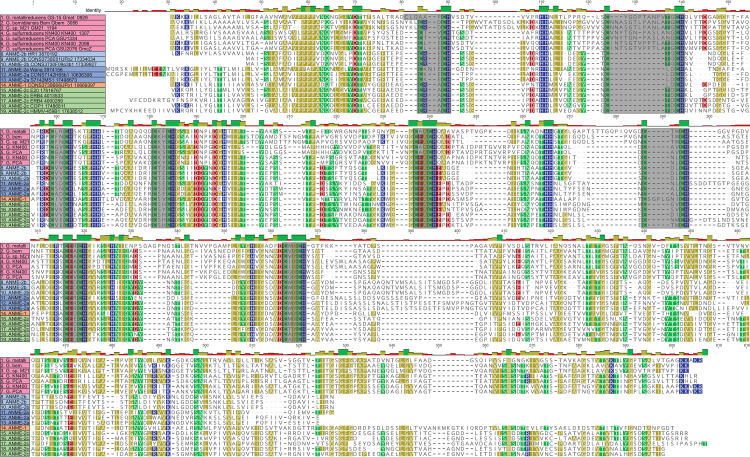
The anaerobic oxidation of methane coupled to sulfate reduction is a microbially mediated process requiring a syntrophic partnership between anaerobic methanotrophic (ANME) archaea and sulfate-reducing bacteria (SRB). Based on genome taxonomy, ANME lineages are polyphyletic within the phylum Halobacterota, none of which have been isolated in pure culture. Here, we reconstruct 28 ANME genomes from environmental metagenomes and flow sorted syntrophic consortia. Together with a reanalysis of previously published datasets, these genomes enable a comparative analysis of all marine ANME clades. We review the genomic features that separate ANME from their methanogenic relatives and identify what differentiates ANME clades. Large multiheme cytochromes and bioenergetic complexes predicted to be involved in novel electron bifurcation reactions are well distributed and conserved in the ANME archaea, while significant variations in the anabolic C1 pathways exists between clades. Our analysis raises the possibility that methylotrophic methanogenesis may have evolved from a methanotrophic ancestor.


Conflict of interest statement

S.J.H. is a co-founder of Koonkie Inc., a bioinformatics consulting company that designs and provides scalable algorithmic and data analytics solutions in the cloud.

Figures

Fig 1
Fig 1. Phylogeny of ANME and related archaea.
Phylogenetic trees constructed from ANME genomes, sequences of closely related archaea, and a selection of sequences derived from clone libraries demonstrate the relationship between ANME and methanogens of the Halobacterota. (A) Phylogenetic tree built with 16S rRNA gene sequences, root leads to sequence from Sulfolobus solfataricus p2. (B) Phylogenomic tree built with concatenated marker set 4 (see S1 Table for list), root also to S. solfataricus p2. (C) Phylogenetic tree built with protein sequence of RpoB, root leads to sequences from “Ca. Methanomethyliales” and “Ca. Bathyarchaeota.” (D) Phylogenetic tree of McrA protein sequences. Note the divergence of proposed alkane oxidizing McrA genes in “Ca. Syntrophoarchaeum,” “Ca. Bathyarchaeota,” and “Ca. Argoarchaeum.” Branch support values of 100% are labeled with closed circles, >50% with open circles. Tree scales represent substitutions per site. Tree construction parameters are found in the Materials and methods section. For tree files and alignments, see S1 Data. Detailed tree figures are presented in S2–S5 Figs. ANME, anaerobic methanotrophic; McrA, methyl-coenzyme M reductase subunit A; RpoB, RNA polymerase subunit beta; 16S rRNA, small subunit ribosomal RNA.
Fig 2
Fig 2. Summary of ANME energy metabolism.
Schematic representation of the 3 phases of ANME energy metabolism in our current model. In Phase 1, methane is oxidized to CO2 through the reversal of the canonical seven step methanogenesis pathway. Energy is invested in this phase in the form of sodium ion translocation from the outer face of the cytoplasmic membrane to the inner face (yellow arrow). As C1 moieties are sequentially oxidized, 8 electrons are transferred to soluble electron carriers such as F420H2, NADPH, Fd2−, and CoM-SH/CoB-SH. In Phase 2, 8 electrons on these primary electron carriers are transferred to secondary electron carriers in a process that conserves energy needed for cell growth in the form of sodium and proton motive forces (yellow arrows). These secondary electron carriers may be quinols (QH2) methanophenazine (MpH2) or possibly soluble electron carriers such as formate (HCOO−) or an unknown electron shuttle (XH2). In Phase 3, the secondary electron carriers are relieved of their electrons in various ways depending on the environmentally available electron acceptors, which can include SRB in the case of marine ANME-SRB consortia, iron, manganese, or oxidized nitrogen species in the case of “Ca. Methanoperedens”. Humic substances and artificial electron acceptors (AQDS) have also served as electron acceptors in laboratory experiments for a variety of different ANME from fresh and marine environments. ANME, anaerobic methanotrophic; AOM, anaerobic oxidation of methane; SRB, sulfate-reducing bacteria.
Fig 3
Fig 3. Presence of methanogenesis pathway genes in ANME archaea.
The proteins responsible for the 7 steps of methanogenesis from CO2. Colored boxes represent presence of homologs of these proteins in ANME genomes. Missing genes are represented by gray boxes with diagonal line fill. Numbers in the second column represent estimated genome completeness. When genes are together in a gene cluster, their boxes are displayed fused together. If a gene cluster appears truncated by the end of a contig, it is depicted by a serrated edge on the box representing the last gene on the contig. Numbers following protein names indicate whether the enzyme is closely related to those found in Methanosarcinaceae [1] or are distantly related homologs [2]. Question mark represents hypothetical protein of unknown function found clustered with Mer2. Tree orienting genome order is the same as found Fig 1B. For details on paralog phylogenetic relations, see Fig 4. Gene accession numbers can be found in S2 Data. ANME, anaerobic methanotrophic; Fmd/Fwd, formyl-methanofuran dehydrogenase; Ftr, formylmethanofuran-H4MPT formyltransferase; Mch, N5,N10-methenyl-H4MPT cyclohydrolase; Mcr, methyl-coenzyme M reductase; Mer, methylene-H4MPT reductase; Mtd, F420-dependent methylene-H4MPT dehydrogenase; Mtr, N5-methyl-H4MPT:coenzyme M methyltransferase.
Fig 4
Fig 4. Phylogeny of enzymes in the methanogenesis pathway.
Phylogenetic trees constructed from protein sequences of enzymes involved in the methanogenesis pathway in ANME and related archaea. Mcr phylogeny is presented in Fig 1. Numbers next to clades indicate whether the cluster is closely related to those found in Methanosarcinaceae [1] or are distantly related homologs [2], matching labels in Fig 3. (A) MtrE, N5-methyl-H4MPT:coenzyme M methyltransferase subunit E; (B) Mer, methylene-H4MPT reductase; (C) Mtd, F420-dependent methylene-H4MPT dehydrogenase; (D) Mch, N5,N10-methenyl-H4MPT cyclohydrolase; (E) Ftr, formylmethanofuran-H4MPT formyltransferase; (F) FmdB/FwdB, formyl-methanofuran dehydrogenase subunit B, molybdenum/tungsten variety, respectively. Branch support values of 100% are labeled with closed circles, >50% with open circles. Tree scales represent substitutions per site. Tree construction parameters are found in the Materials and methods section. Alignments and tree files can be found in S1 Data. ANME, anaerobic methanotrophic; Mcr, methyl-coenzyme M reductase.
Fig 5
Fig 5. MetF in ANME archaea.
(A) Amino acid sequence identity of MetF homologs found in ANME, “Ca. Argoarchaeum” and “Ca. Syntrophoarchaeum.” ANME-1 and “Ca. Syntrophoarchaeum” form one cluster based on sequence similarity, while ANME-2a, ANME-2b, ANME-2d, ANME-3, and “Ca. Argoarchaeum” form a second. Grayscale values represent percent identity. Sequences similar to the ANME-2/3 or ANME-1 clusters were retrieved via BLAST search of the NCBI nr database and used to construct phylogenetic trees of these 2 groups. (B) ANME-2, ANME-3, and “Ca. Argoarchaeum” cluster together with closely related members of the Methanosarcinaceae. (C) ANME-1 and “Ca. Syntrophoarchaeum” form a polyphyletic group within a diverse group of sequences derived from MAGs of uncultured archaea. Notably, the ANME-1 sp. SA is significantly different than the rest of the ANME-1. Roots for both trees lead to closely related MetF sequences from bacteria. Branch support values of 100% are labeled with closed circles, >50% with open circles. Tree scales represent substitutions per site. Tree construction parameters are found in the Materials and methods section. Alignments and tree files can be found in S1 Data. ANME, anaerobic methanotrophic; MAG, metagenome-assembled genome; MetF, methylenetetrahydrofolate reductase.
Fig 6
Fig 6. Cytoplasmic electron carrier oxidation.
Some energy conservation systems discovered in methanogenic archaea are conserved in ANME archaea (colored fill), while others appear absent (transparent gray with diagonal line fill). (A) F420H2 oxidation is coupled to proton translocation in methylotrophic methanogens via the Fpo/Fqo complex or by the production of H2 by Frh and subsequent oxidation by Vht. In either case, electrons are ultimately deposited on MpH2. Neither Frh or Vht complexes have been observed in any ANME genomes analyzed here. (B) Fd2− oxidation can be coupled either to sodium motive force or proton motive force in methylotrophic methanogens. The Rnf complex catalyzes Fd2−:Mp oxidoreductase reaction coupled to sodium translocation and is found in a number of methanogens and ANME. The ANME-2c contain most of the complex but lack the cytochrome c, cytochrome b, and MA0665 subunits, so their activity is difficult to predict. Ech and Vht can combine to produce net proton translocation via H2 diffusion in methylotrophic methanogens, but neither complex is found in ANME. FpoF can catalyze a Fd2−:F420 oxidoreductase reaction, and F420H2 could then pass through the Fpo/Fqo complex. Various HdrABC complexes are present in all ANME genomes and could in principle oxidize Fd2− and CoM-SH/CoB-SH through a reversal of electron bifurcation reaction. The electron acceptor in this process is likely to not be H2 in most ANME groups due to the absence of MvhG and MvhA. (C) Besides, the HdrABC complexes mentioned above and second possible CoM-SH/CoB-SH oxidation strategy would be a reversal of the HdrDE reaction found in methylotrophic methanogens. In ANME, the reaction would have to proceed in the direction illustrated and therefore would dissipate proton motive force by consuming a proton on the positive side of the membrane. For presence/absence of these systems in ANME genomes analyzed here, see S6 Fig. ANME, anaerobic methanotrophic; Ech, energy-conserving hydrogenase; Fpo, F420H2:methanophenazine oxidoreductase; Fqo, F420H2:quinone oxidoreductase complex; Frh, F420-reducing hydrogenase.
Fig 7
Fig 7. HdrABC structure overview.
Depiction of the primary structure of HdrA and the quaternary structure of the HdrABC-MvhADG complex based on the structure from M. wolfeii. (A) HdrA can be broken down into 4 domains, the positions of these domains and key iron–sulfur cluster binding cysteines are illustrated, scale denotes amino acid position in the M. wolfeii sequence. (B) Quaternary structure of the entire HdrABC-MvhABG complex illustrating the dimeric structure. Metal cofactors involved in the oxidation/reduction of substrates or electron transport through the complex are highlighted. (C) Detail of HdrA domain structure highlighting cofactor position and proposed electron flow from MvhD in through the C-terminal ferredoxin, bifurcation through the FAD cofactor, with 2 electrons flowing out through HdrBC via the thioredoxin reductase domain’s FeS cluster, while 2 other electrons flow out through the inserted ferredoxin domain, presumably to free ferredoxin (Fd2−). Importantly, for the proposed heterodimeric HdrA discussed here, this latter electron flow passes through the FeS cluster bound through a combination of Cys residues in the N-terminal domain, combined with a single Cys from the other HdrA subunit (Cys197 highlighted in red). FAD, flavin adenine dinucleotide.
Fig 8
Fig 8. Hdr operons and domain heterogeneity.
(A) Examples of gene clusters containing HdrA genes from select ANME genomes. HdrA paralogs present in ANME have extensive modification to the domain structure as compared to the HdrA crystalized from M. wolfeii (see Fig 7 for details of HdrA structure). These domains and associated protein subunits are illustrated with the gene context and orientation. (B) Illustration of conserved domains and cofactor binding residues in the 13 HdrA clusters defined here. All HdrA appeared to retain residues responsible for interaction with FAD; however, the presence of FeS-binding cysteine residues and entire domains as defined on the M. wolfeii structure are variably retained. Importantly, tandem or fused HdrA appear to have complementary presence/absence of C-terminal ferredoxin domains and Cys197, suggesting the formation of a heterodimeric complex. ANME, anaerobic methanotrophic; FAD, flavin adenine dinucleotide.
Fig 9
Fig 9. Overview of proposed EET pathways.
Comparison between EET systems known from gram-negative bacteria and proposed analogous systems in ANME archaea. (A) EET systems in gram-negative bacteria involve membrane-bound quinol:cytochrome c oxidoreductases (CbcL, ImcH, CymA, NetD), small soluble cytochromes apparently involved in electron transport through the periplasmic space (PpcA, Stc, PdsA), and a beta-barrel/decaheme cytochrome c protein complex (MtrCAB) that acts as an electron conduit by which electrons can transit through the outer membrane to the extracellular space filled with additional cytochrome c such as OmcZ and filaments of OmcS. (B) Analogous protein complexes found in ANME genomes that appear optimized for the challenges associated with EET in the archaeal cell architecture. MpH2:cytochrome c oxidoreductases are likely present in the form of gene clusters containing VhtC cytochrome b subunits together with large 7 or 11 heme-binding MHC proteins (Mco). Other potential options for this step could include the NapH homologs sporadically distributed through ANME genomes or through the action of the unique cytochrome b gene found in ANME Rnf clusters. Electron transfer through the outer proteinaceous S-layer requires a different mechanism than the beta-barrel/decaheme cytochrome strategy evolved in the EET-capable bacteria containing an outer membrane. This step is expected to be overcome by the giant ANME-specific MHC proteins containing S-layer domains allowing them to integrate into the S-layer structure. Very close homologs of OmcZ are found in ANME (see Fig 10). For details of S-layer MHC fusions, see Fig 11. ANME, anaerobic methanotrophic; EET, extracellular electron transfer; Mco, methanophenazine-cytochrome c oxidoreductase; MHC, multiheme c-type cytochrome; Rnf, Rhodobacter nitrogen fixation.
Fig 10
Fig 10. OmcZ homologs in ANME archaea.
Protein sequence alignment of OmcZ homologs from various Geobacter species and ANME genomes reported here using muscle 3.8.31 with default settings. The 8 CxxCH-binding motifs are highlighted in gray. Regions of significant sequence identity are present throughout the protein, not just associated with the CxxCH motifs, suggesting conserved function. Alignment file can be found in S1 Data. ANME, anaerobic methanotrophic.
Fig 11
Fig 11. Large multiheme cytochrome c proteins in ANME archaea.
Schematic of protein structure highlighting the position of heme-binding motifs and other conserved features of the large ANME-specific multiheme cytochromes. The ANME MHC were divided into 3 major groups based on sequence similarity and conserved domains structure. ANME MHC-A contains an S-layer domain and C-terminal transmembrane helix. In ANME-2a and ANME-2b, these proteins are extended by an additional transmembrane helix and more heme-binding motifs. ANME MHC-B contains an S-layer domain and C-terminal transmembrane helix as well, but an N-terminal region devoid of heme-binding domains has similarity to peptidase M6-like domains. ANME MHC-C do not contain S-layers or C-terminal transmembrane helices but instead contain a large N-terminal region with a predicted pectin lyase-type domain. Domains predicted with InterProScan and are displayed with colored boxes. Large MHC proteins from ANME-3 sp. HMMV2 and ANME-2c sp. ERB4 that do not clearly fit into these categories are also shown (Note: ANME-2c sp. ERB4 is a single-peptide split between 2 lines due to its size). ANME, anaerobic methanotrophic; MHC, multiheme c-type cytochrome.
Fig 12
Fig 12. Cytochrome maturation and CcmF duplication.
(A) Phylogenetic analysis of CcmF homologs from ANME and closely related archaea. CcmF1 cluster contains the CcmF found in the Methanosarcinaceae. CcmF2 is a closely related group of homologs found only in ANME and “Ca. Argoarchaeum” and in all cases is found next to the S-layer containing ANME MHC-B. CcmF3 comprises the larger of 2 encoded genes that appear to be a split CcmF and are found in ANME and Ferroglobus. (B) Example gene clusters from all groups that contain CcmF2 illustrating their position with respect to ANME MHC-B. Some genomes additionally contain a signal peptidase and a predicted membrane integral ANME-specific gene in this cluster (8x TMH). Horizontal red lines denote CxxCH heme-binding domains; teal represent S-layer domain (see Fig 11 for details of ANME-MHC structure). (C) Schematic of cytochrome maturation pathway. CcmA and CcmB comprise ABC transporter module that exports heme B, which is transferred to CcmE via CcmC’s tryptophan (W)-rich periplasmic loop. CcmE is expected to utilize CcmF1 to mature cytochrome c proteins found in both ANME and methanogens of the Methanosarcinaceae. CcmF2, found only next to ANME MHC-B, is expected to be involved in its maturation. The co-occurring signal peptidase is likely involved in cleavage of the N-terminal signal sequence. Closed circles represent branch support values between 80% and 100%. Tree scales represent substitutions per site. Tree construction parameters are found in the Materials and methods section. Alignment and tree files can be found in S1 Data. ANME, anaerobic methanotrophic; MHC, multiheme c-type cytochrome.
Fig 13
Fig 13. H4MPT vs H4F C1 metabolisms.
(A) Pathway of C1 transformations in ANME-2a, ANME-2b, ANME-2d, and ANME-3 based on presence of genes and precedent from M. barkeri. H4MPT is the catabolic C1 carrier, while the H4F C1 pool is derived from serine and is used for the biosynthesis of purine, thymidine, and, possibly, methionine. (B) Pathway of C1 transformations available to ANME-1 and ANME-2c, which lack the vast majority of the H4F-interacting enzymes in (A). H4F-CHO–specific enzymes in pyrimidine synthesis are replaced by free formate versions in ANME-2c. While present in these organisms, GlyA appears to be the type that interacts with H4MPT instead of H4F. Light gray pathways were not found. (C) Colored boxes represent presence of various H4F-interacting genes in ANME genomes. Missing genes are represented by gray boxes with diagonal line fill. Numbers in the second column represent genome completeness. When genes are together in a gene cluster, their boxes are displayed fused together. Gene accession numbers can be found in S2 Data. (D) Phylogenetic analysis of GlyA and ThyA homologs found in ANME genomes. Red and yellow stars indicate GlyA sequences shown to react with H4MPT and H4F, respectively. Closed circles represent branch support values of 100%, open circles >50%. Tree scales represent substitutions per site. Tree construction parameters are found in the Materials and methods section. Alignment and tree files can be found in S1 Data. ANME, anaerobic methanotrophic.
Fig 14
Fig 14. TCA cycle gene present in ANME archaea.
(A) Schematic of the enzymes and reactants in the partial oxidative and reductive TCA cycles in ANME that lead to 2-oxoglutarate for the purpose of producing anabolic intermediates for biosynthesis. Reductive pathway shown in blue; oxidative pathway shown in red. (B) Colored boxes represent presence of various TCA cycle genes in ANME genomes. Missing genes are represented by gray boxes with diagonal line fill. Numbers in the second column represent genome completeness. When genes are together in a gene cluster, their boxes are displayed fused together. Note: Some steps can be carried out by multiple different enzyme systems. Gene accession numbers can be found in S2 Data. ANME, anaerobic methanotrophic; TCA, tricarboxylic acid.
Fig 15
Fig 15. Methane seep group nitrogenase phylogeny and distribution.
(A) Maximum likelihood phylogenetic tree of NifD amino acid sequences from the “methane seep” group of nitrogenase, with close relatives. Closed circles represent branch support values of 80% to 100%; gray circles between 70% and 80%. Tree scales represent substitutions per site. Tree construction parameters are found in the Materials and methods section. Alignments and tree files can be found in S1 Data. (B) Presence of seep group nitrogenase in genomes presented here. Colored boxes represent presence of various nitrogenase related genes in ANME genomes. Missing genes are represented by gray boxes with diagonal line fill. Numbers in the second column represent genome completeness. When genes are together in a gene cluster, their boxes are displayed fused together. Gene accession numbers can be found in S2 Data. ANME, anaerobic methanotrophic.
Fig 16
Fig 16. Diversity of FrhB family proteins.
Phylogeny and distribution of the FrhB paralogs recovered in our ANME genomes. (A) Phylogenetic tree built from all FrhB paralogs in ANME and methanogenic archaea. Major groups have been collapsed (for full tree, see S16 Fig). Label in parenthesis describe conserved gene cluster; FdhB: F420-dependent formate dehydrogenase, FrhB: F420-dependent hydrogenase, FqoF: F420:quinone oxidoreductase, Fpo: F420:phenazine oxidoreductase, HdrA: in cluster with HdrA genes, NuoF-Trx: in cluster with NuoF and thioredoxin genes, Fsr: F420-dependent sulfite reductase, FGltS: F420-dependent glutamate synthase, Pfor: in cluster with pyruvate ferredoxin oxidoreductase genes, CODH: in cluster with carbon monoxide dehydrogenase alpha and epsilon subunits. Only branch support values >50% are displayed. Tree scales represent substitutions per site. Tree construction parameters are found in the Materials and methods section. Alignment and tree files can be found in S1 Data. (B) Presence of various FrhB paralogs in different ANME genomes. Colored boxes represent presence of various nitrogenase-related genes in ANME genomes. Missing genes are represented by gray boxes with diagonal line fill. Numbers in the second column represent genome completeness. When genes are together in a gene cluster, their boxes are displayed fused together. Gene accession numbers can be found in S2 Data. ANME, anaerobic methanotrophic.
Fig 17
Fig 17. Phage-like protein translocation structures.
(A) PLTS gene clusters in ANME genomes. (B) Alignment of PAAR domain spike proteins. PAAR motifs highlighted in blue. Alignments were made using muscle 3.8.31 with default settings, and alignment file can be found in S1 Data. (C) AAI of PAAR domain proteins highlighting 2 clear groupings. Note: Closely related ANME-2a and ANME-2b genomes contain PLTS structures belonging to different clusters. (D) Schematic of PLTS function. AAI, amino acid identity; ANME, anaerobic methanotrophic; PLTS, phage-like protein translocation structure.
Fig 18
Fig 18. Comparison between “Ca. Methanoalium” and other ANME-1 genera.
Phylogenomic tree based on concatenated marker proteins highlighting individual ANME-1 genera, 2 of which have been assigned “Candidatus” names. Estimated genome completeness and contamination are shown in the first and second columns. Comparison of the presence of hydrogenase, membrane-associated formate dehydrogenases, Rnf complexes, and cytochrome maturation machinery highlights important differences in electron flow between these genera. Genomes encoding MHC with more than 10 CxxCH heme-binding motifs are marked in the final column. Bar chart on the far right demonstrates the number of c-type cytochromes per genome. Only branch support values >50% are shown for clarity. Tree scales represent substitutions per site. Tree construction parameters are found in the Materials and methods section. Alignment and tree files can be found in S1 Data, and gene accession numbers can be found in S2 Data. ANME, anaerobic methanotrophic; MHC, multiheme c-type cytochrome; Rnf, Rhodobacter nitrogen fixation.
Fig 19
Fig 19. Energetics of mixed electron transfer.
Energy flow diagrams showing the redox potential (y-axis) of electrons as they travel from methane through the ANME energy metabolism to the SRB partner (x-axis is reaction progression). Width of paths correspond to number of electrons. Endergonic electron flow (uphill) shown in red, exergonic (downhill) in blue. Steps labeled with numbers are carried out by the following enzymes: 1: Mcr, 2: Mer/Mtd, 3: Fwd/Fmd, 4: Rnf, 5: Fpo/Fqo, 6: HdrDE, 7: Mco and ANME-MHC, 8: HdrABC and ANME-specific FrhB, FdhA, 9: uncatalyzed diffusion of electron carrier, 10: FdhAB, possibly confurcation through HdrA complexes. X/XH2 represent a hypothetical low-potential electron carrier that could be used as a diffusive electron shuttle. (A) Electron transfer based entirely on EET from the methanophenazine pool. (B) Electron transfer based entirely on soluble electron shuttle produced in the cytoplasmic space. (C) Mixed model with half of the electrons passing through each pathway. ANME, anaerobic methanotrophic; EET, extracellular electron transfer; Fpo, F420H2:methanophenazine oxidoreductase; Fqo, F420H2:quinone oxidoreductase complex; Mco, methanophenazine-cytochrome c oxidoreductase; Mcr, methyl-coenzyme M reductase; Mer, methylenetetrahydromethanopterin reductase; MHC, multiheme c-type cytochrome; Mtd, N5,N10-methylene-H4MPT dehydrogenase; Rnf, Rhodobacter nitrogen fixation; SRB, sulfate-reducing bacteria.

References

    1. Hinrichs KU, Hayes JM, Sylva SP, Brewer PG, DeLong EF. Methane-consuming archaebacteria in marine sediments. Nature. 1999;398:802–5. doi: 10.1038/19751 - DOI - PubMed
    1. Boetius A, Ravenschlag K, Schubert CJ, Rickert D, Widdel F, Gieseke A, et al.. A marine microbial consortium apparently mediating anaerobic oxidation of methane. Nature. 2000;407:623–6. doi: 10.1038/35036572 - DOI - PubMed
    1. Orphan VJ, House CH, Hinrichs K-U, McKeegan KD, DeLong EF. Methane-Consuming Archaea Revealed by Directly Coupled Isotopic and Phylogenetic Analysis. Science. 2001;293:484–7. doi: 10.1126/science.1061338 - DOI - PubMed
    1. Knittel K, Boetius A. Anaerobic oxidation of methane: progress with an unknown process. Annu Rev Microbiol. 2009;63:311–34. doi: 10.1146/annurev.micro.61.080706.093130 - DOI - PubMed
    1. Orphan VJ, Hinrichs K-U, Ussler W, Paull CK, Taylor LT, Sylva SP, et al.. Comparative Analysis of Methane-Oxidizing Archaea and Sulfate-Reducing Bacteria in Anoxic Marine Sediments. Appl Environ Microbiol. 2001;67:1922–34. doi: 10.1128/AEM.67.4.1922-1934.2001 - DOI - PMC - PubMed

Publication types