

Development of a Genomics-Based Approach To Identify Putative Hypervirulent Nontyphoidal Salmonella Isolates: Salmonella enterica Serovar Saintpaul as a Model
- PMID: 34986312
- PMCID: PMC8731237
- DOI: 10.1128/msphere.00730-21
Development of a Genomics-Based Approach To Identify Putative Hypervirulent Nontyphoidal Salmonella Isolates: Salmonella enterica Serovar Saintpaul as a Model
Abstract
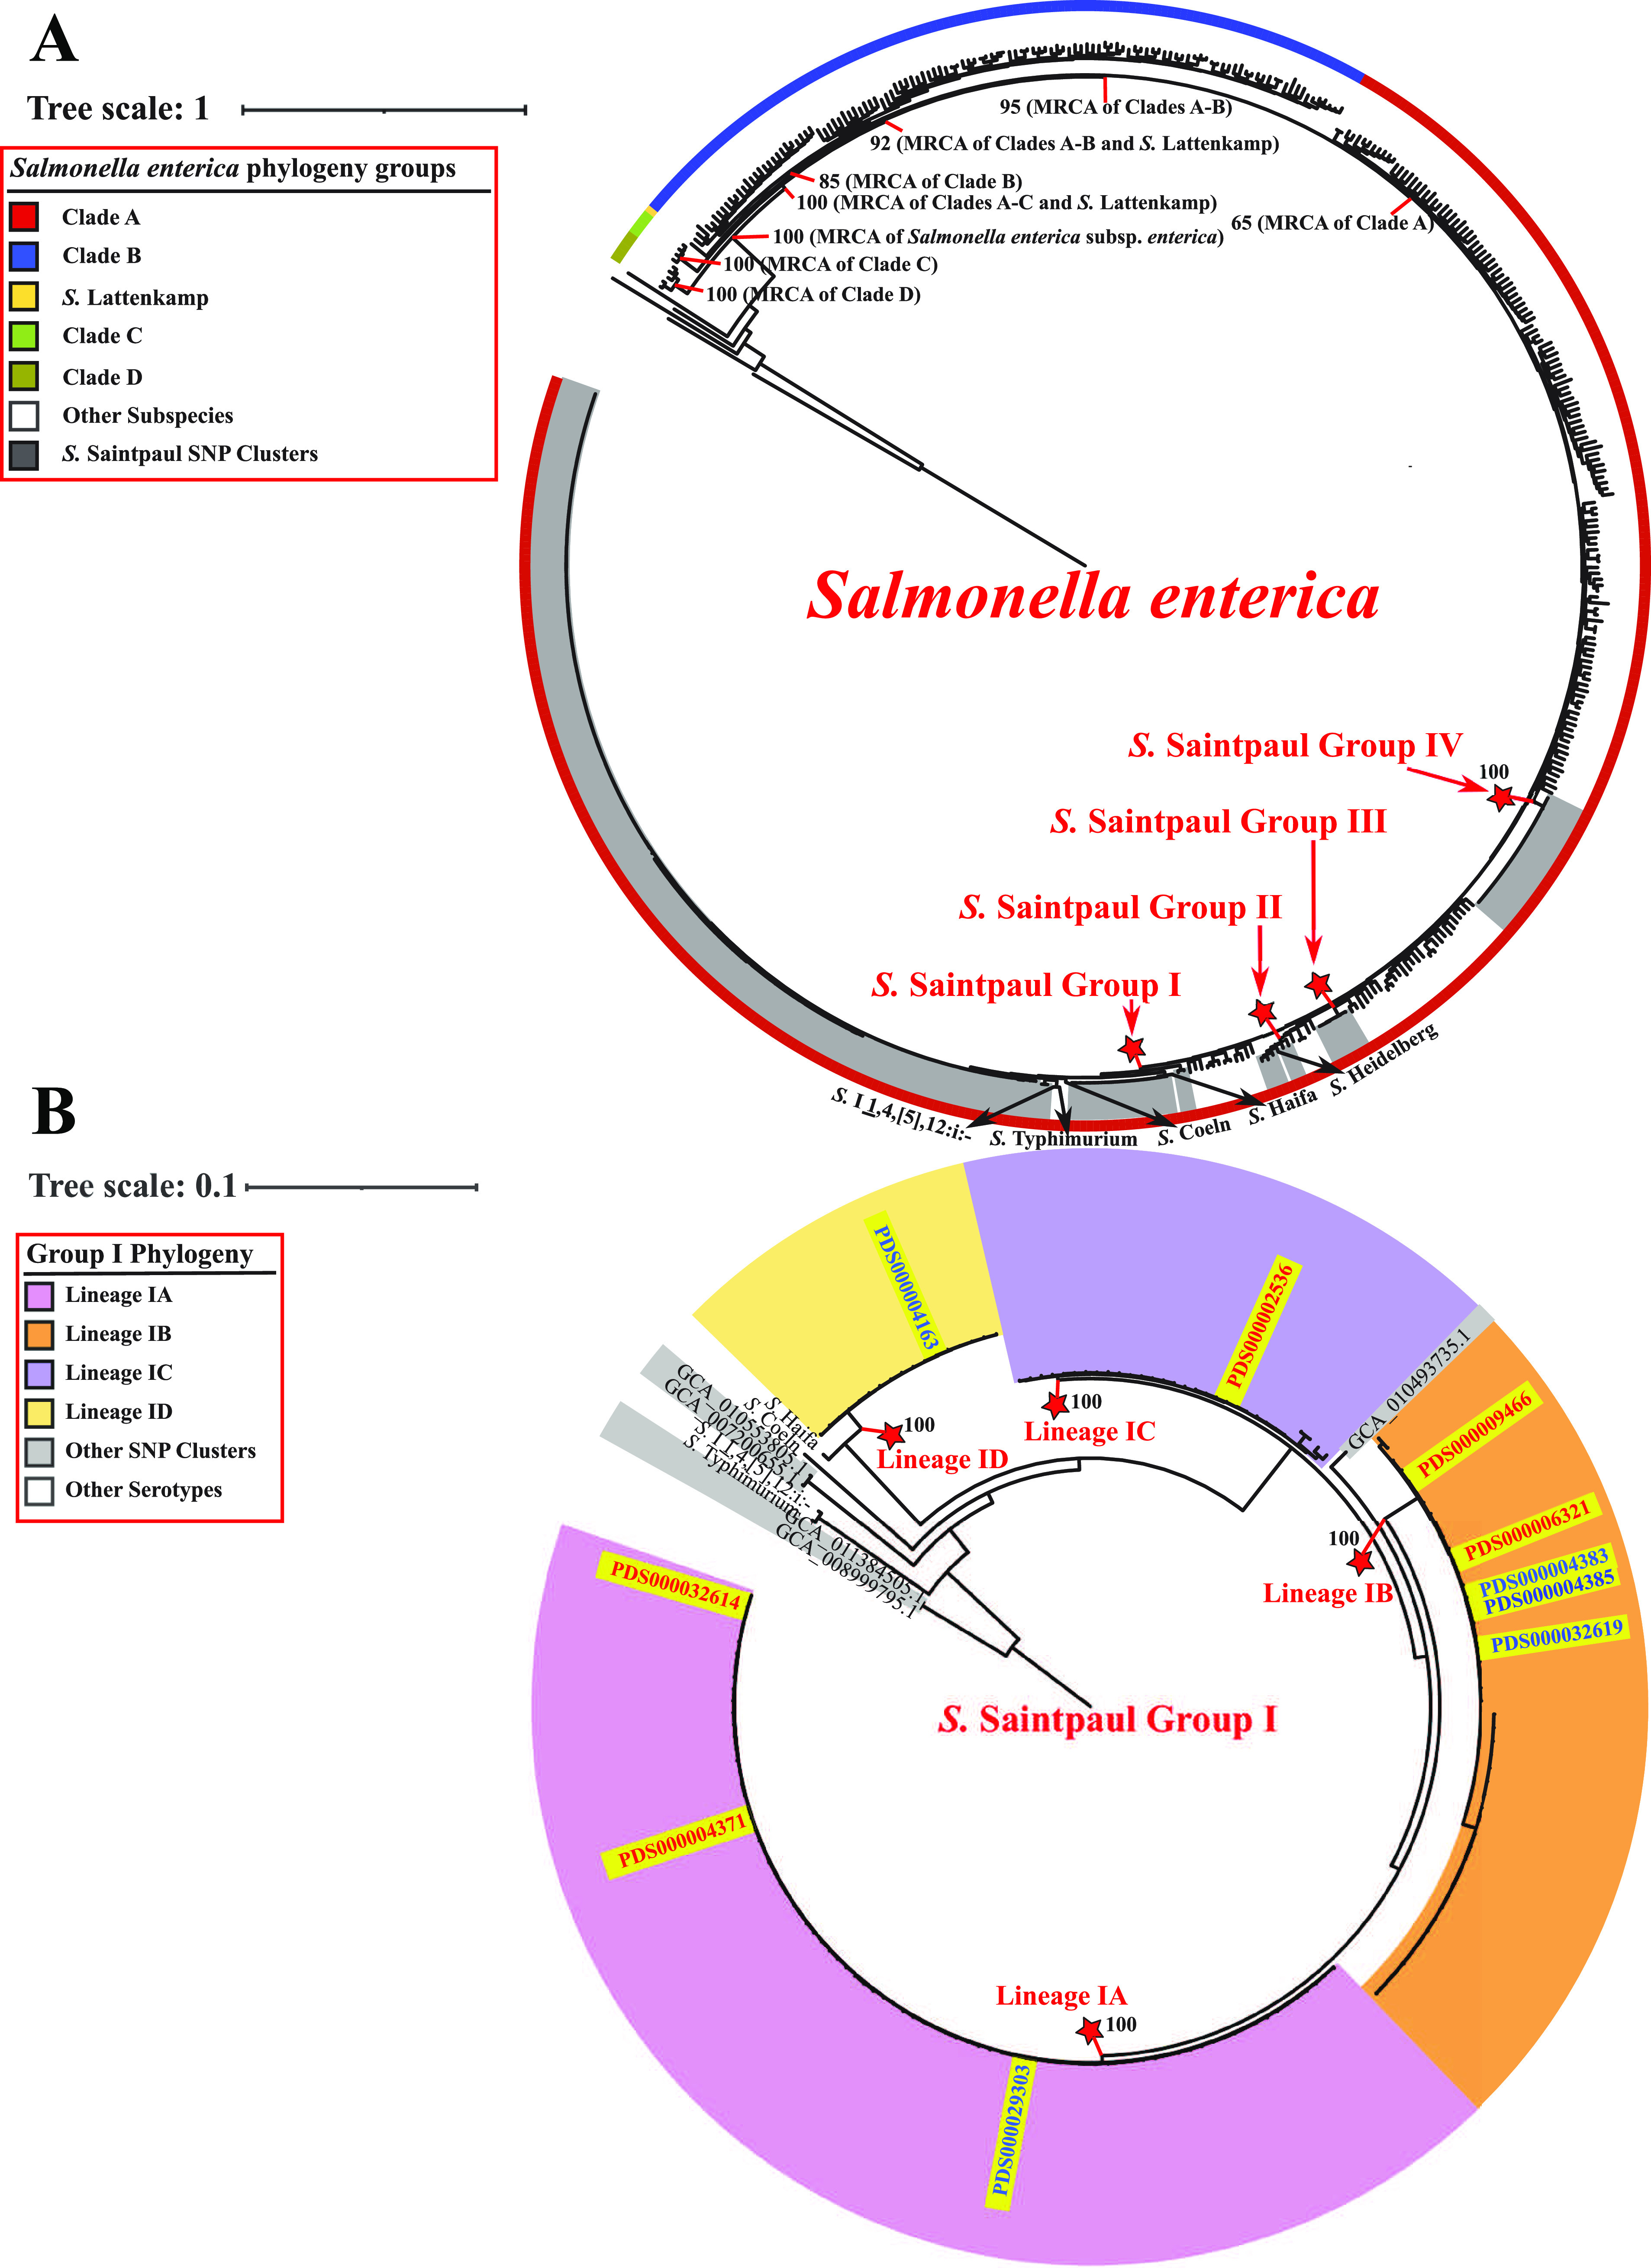
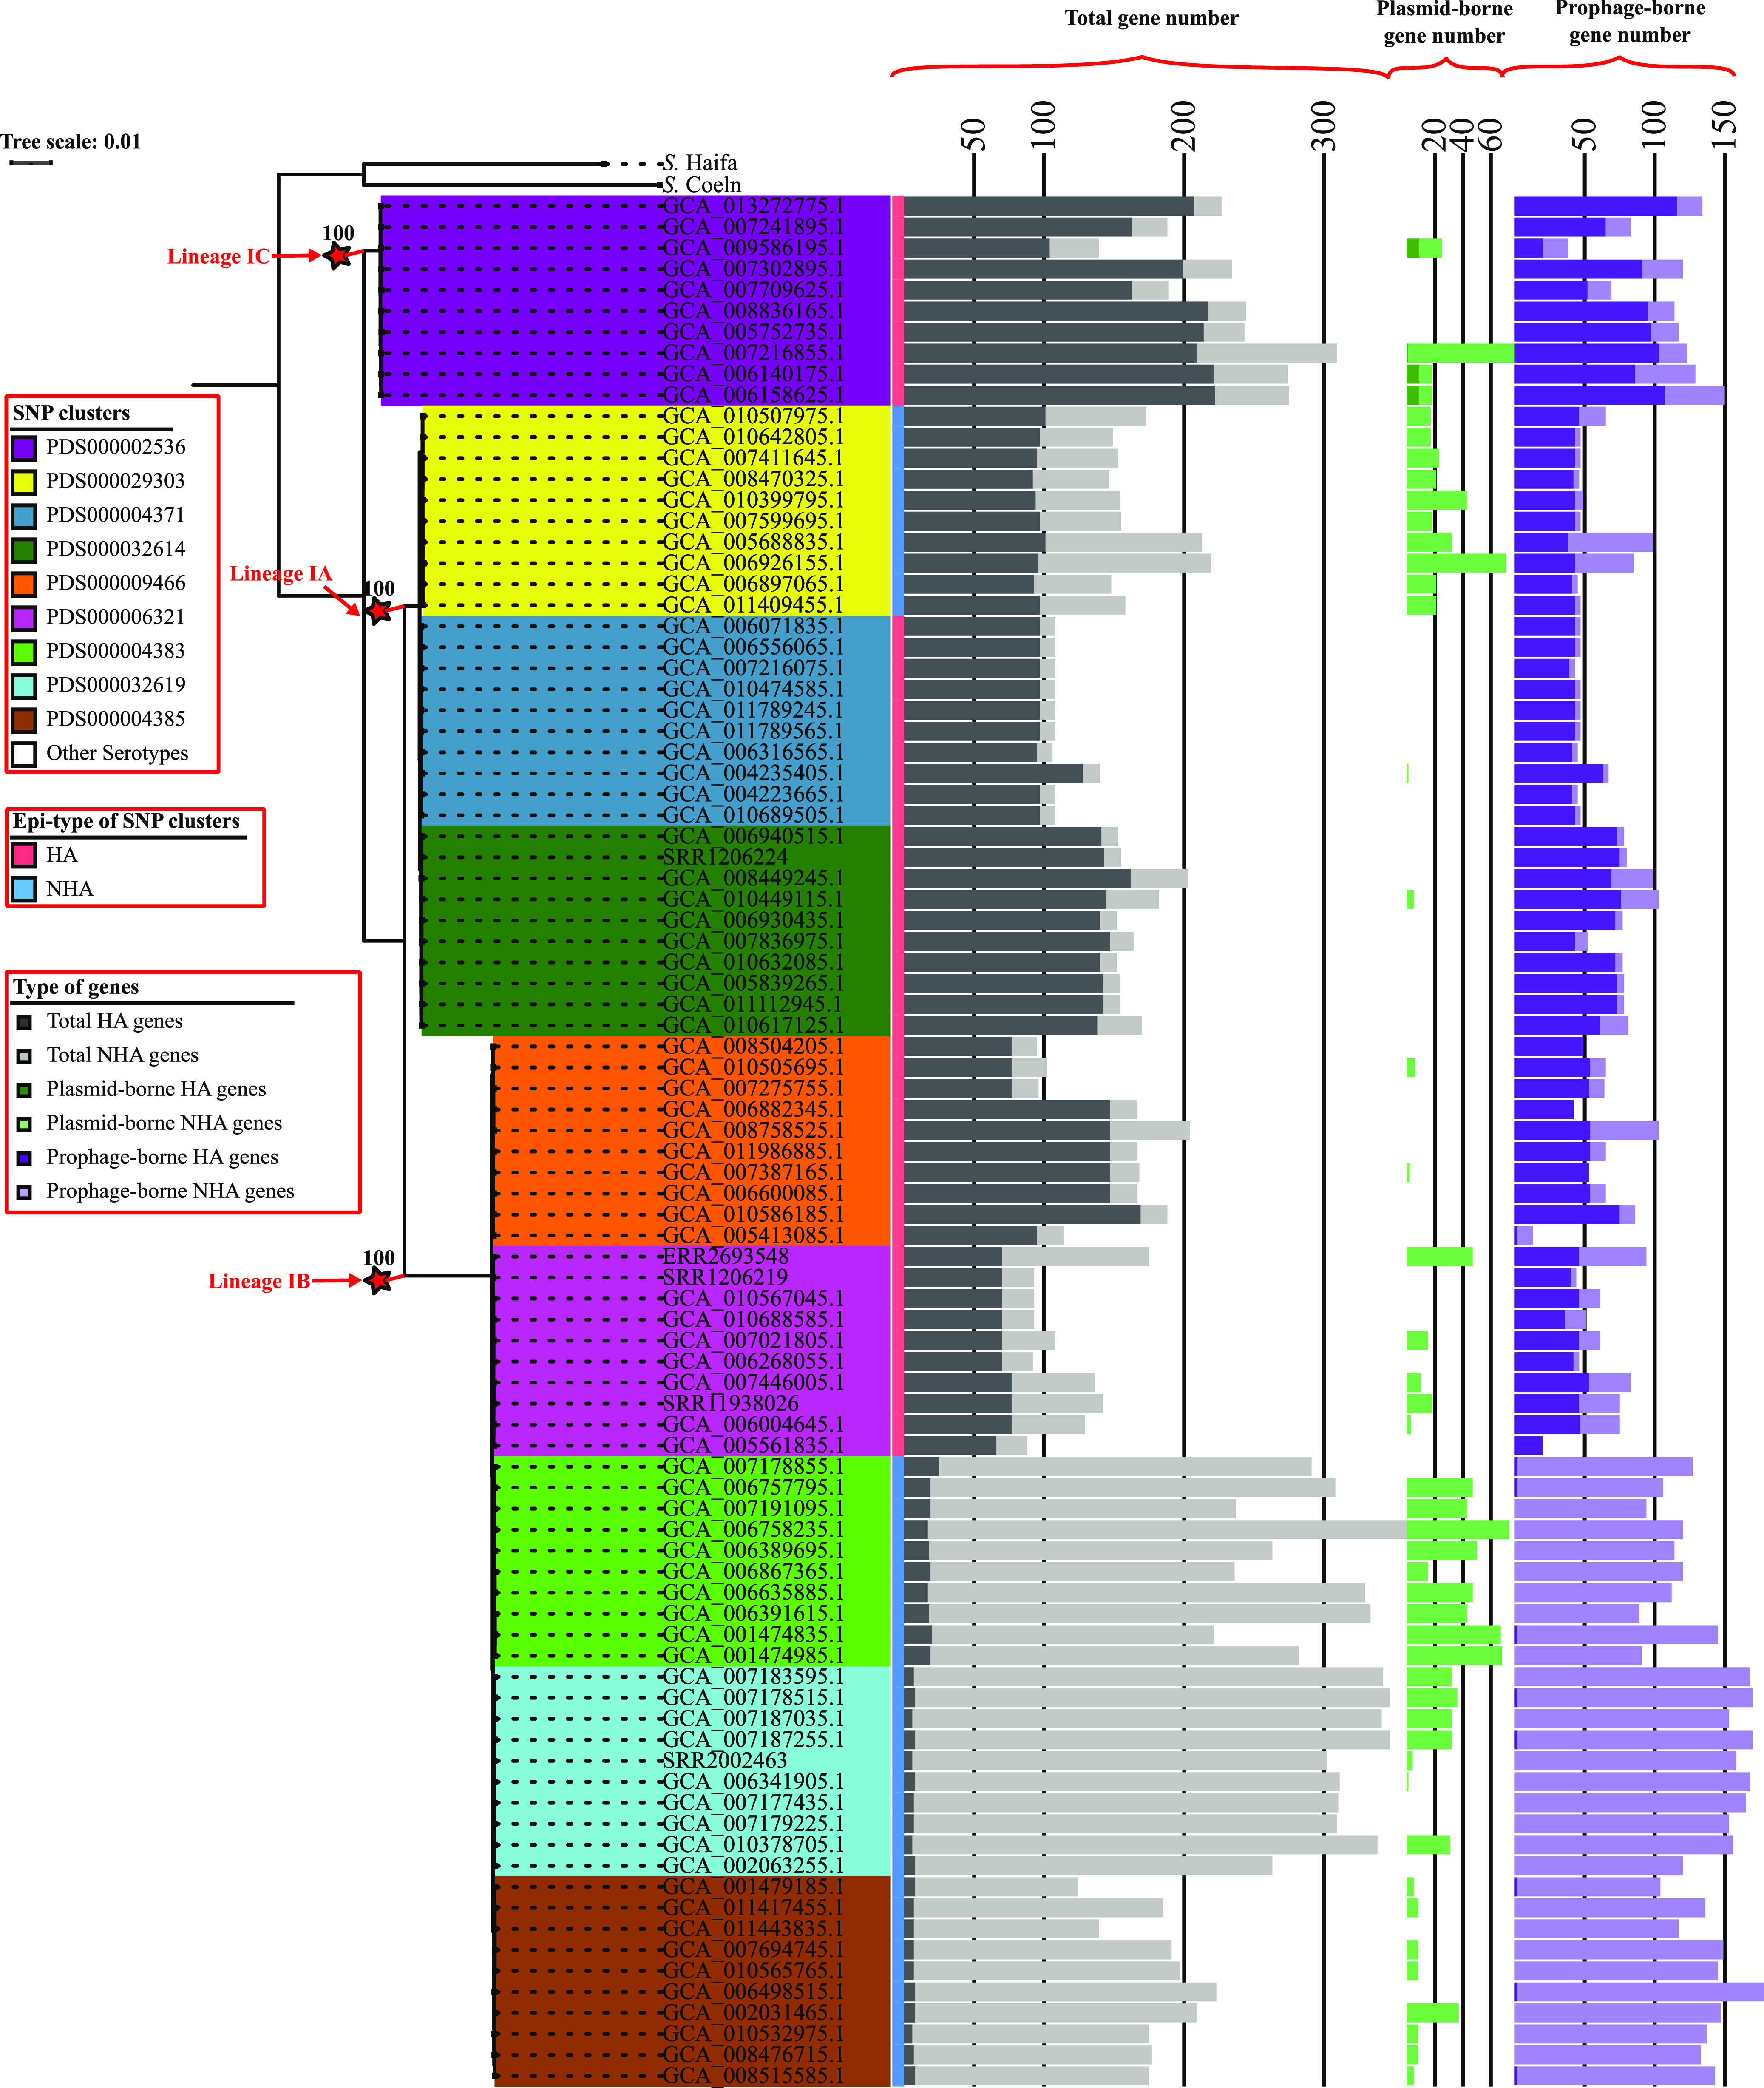
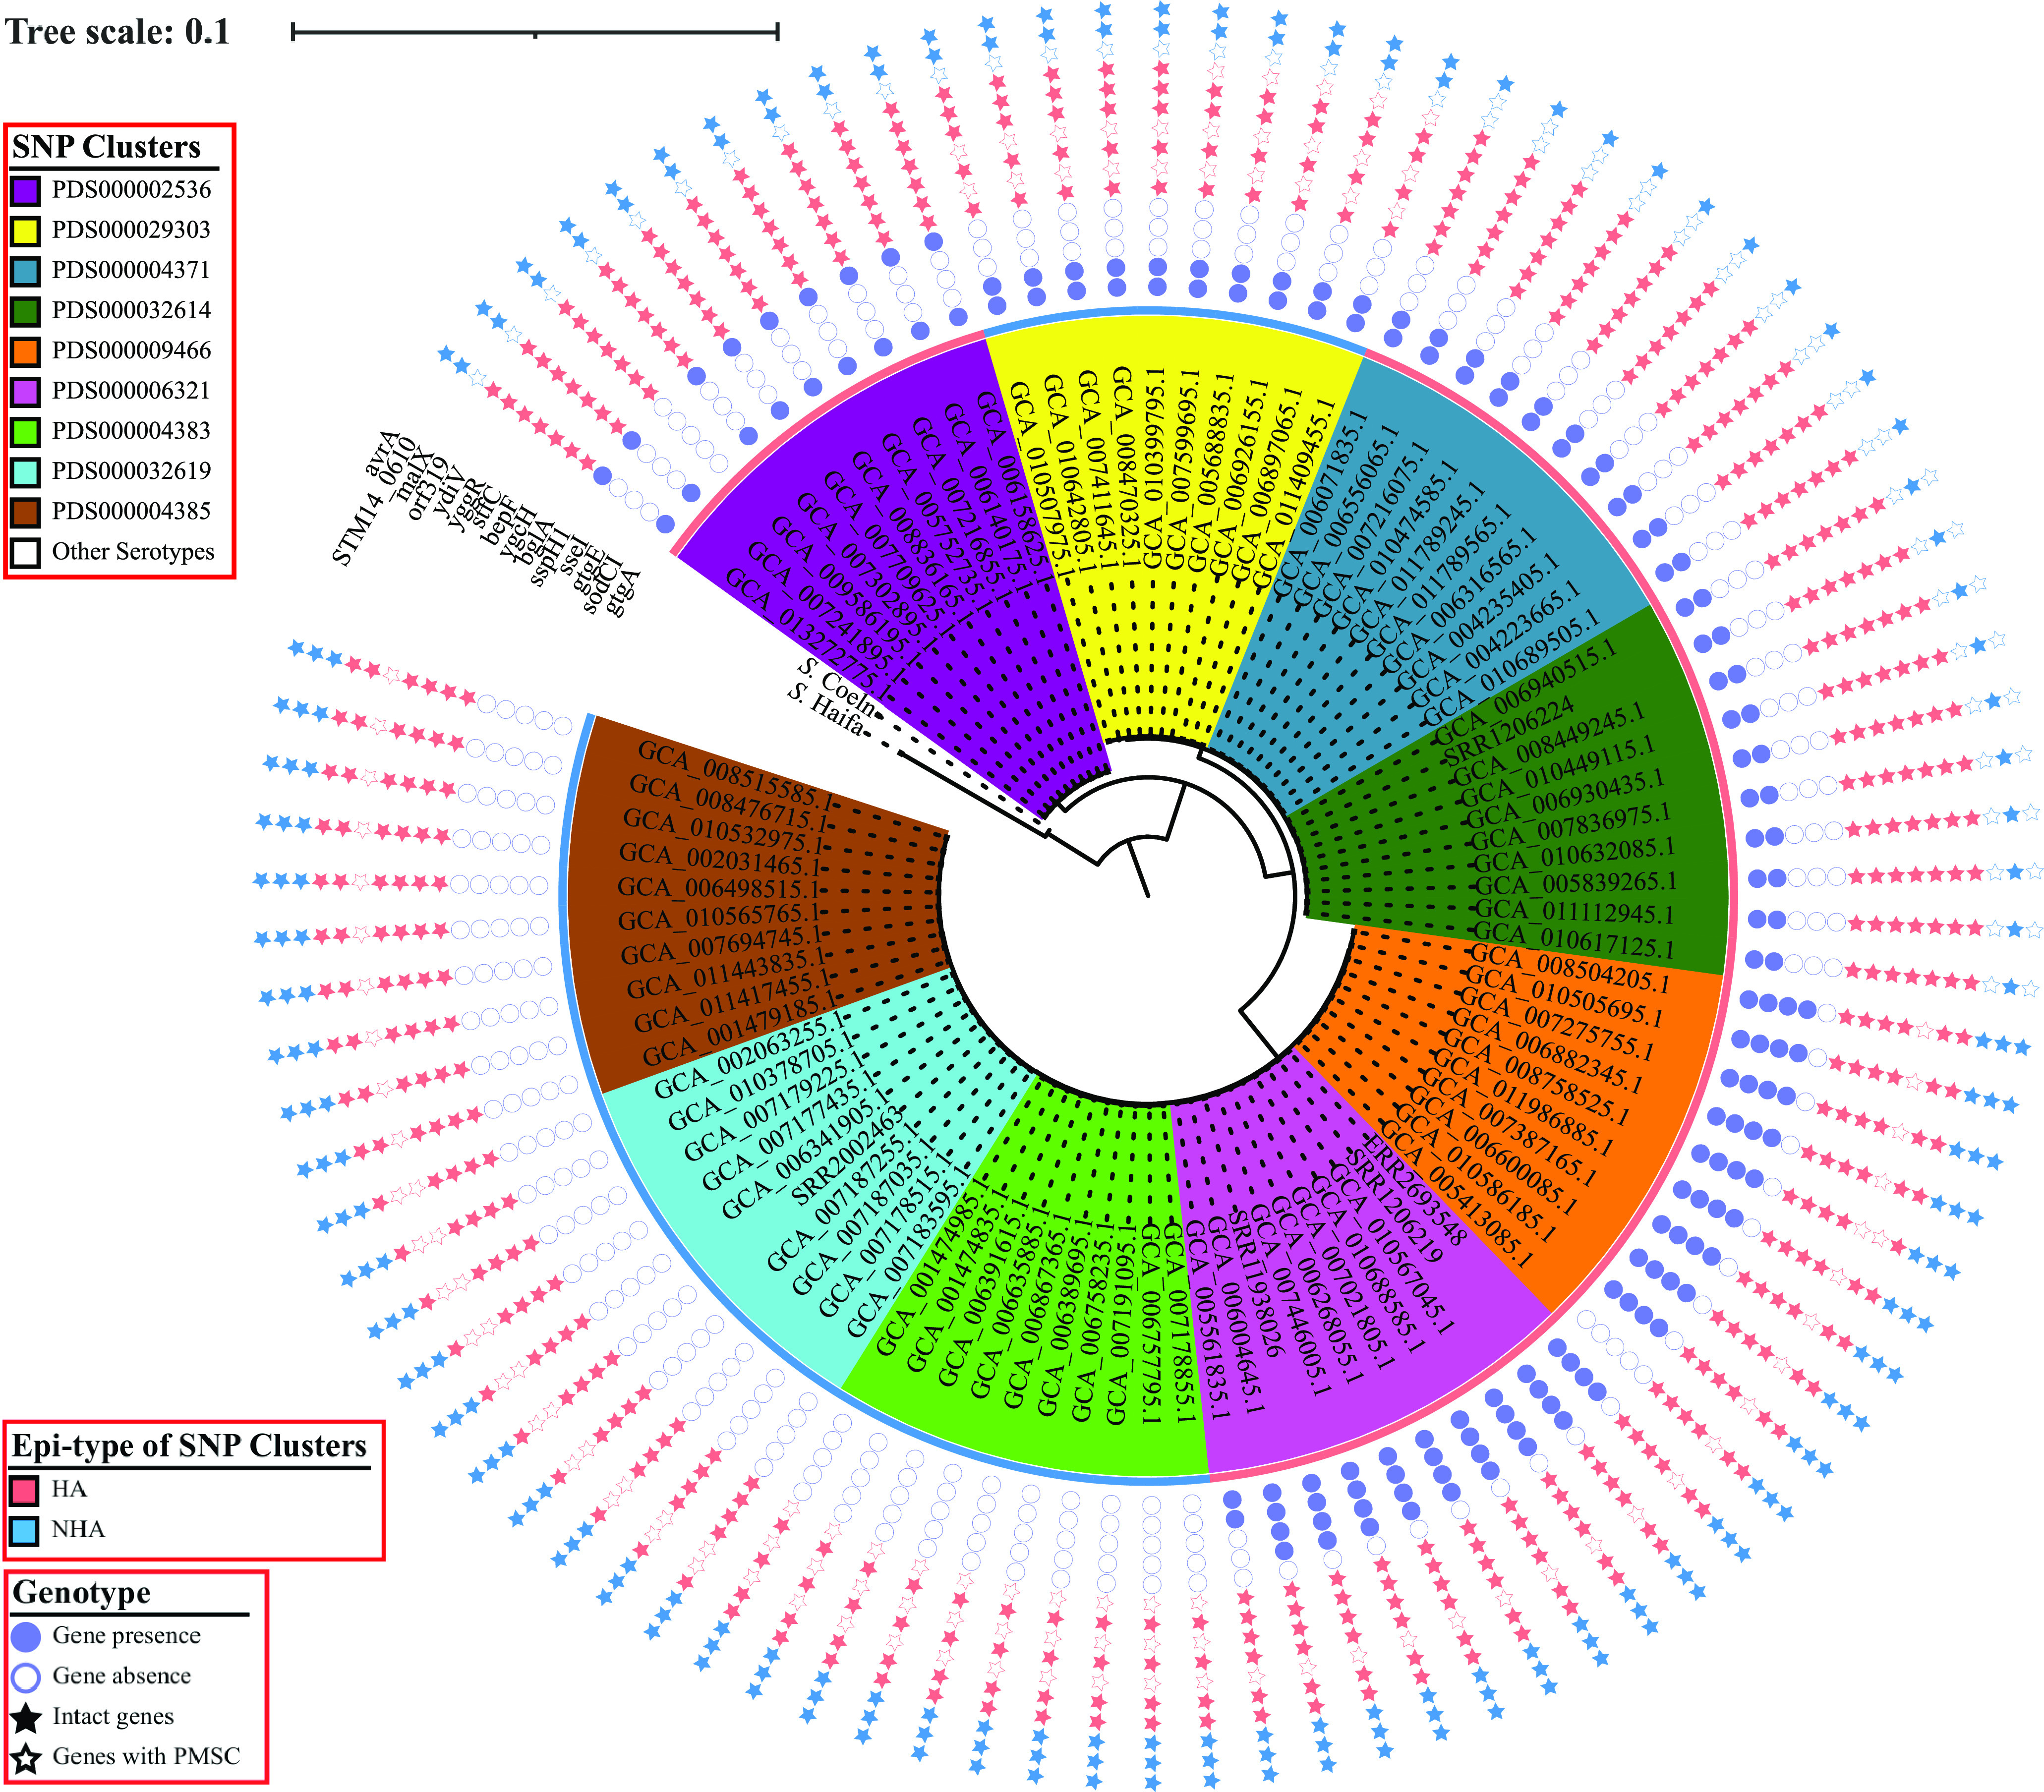
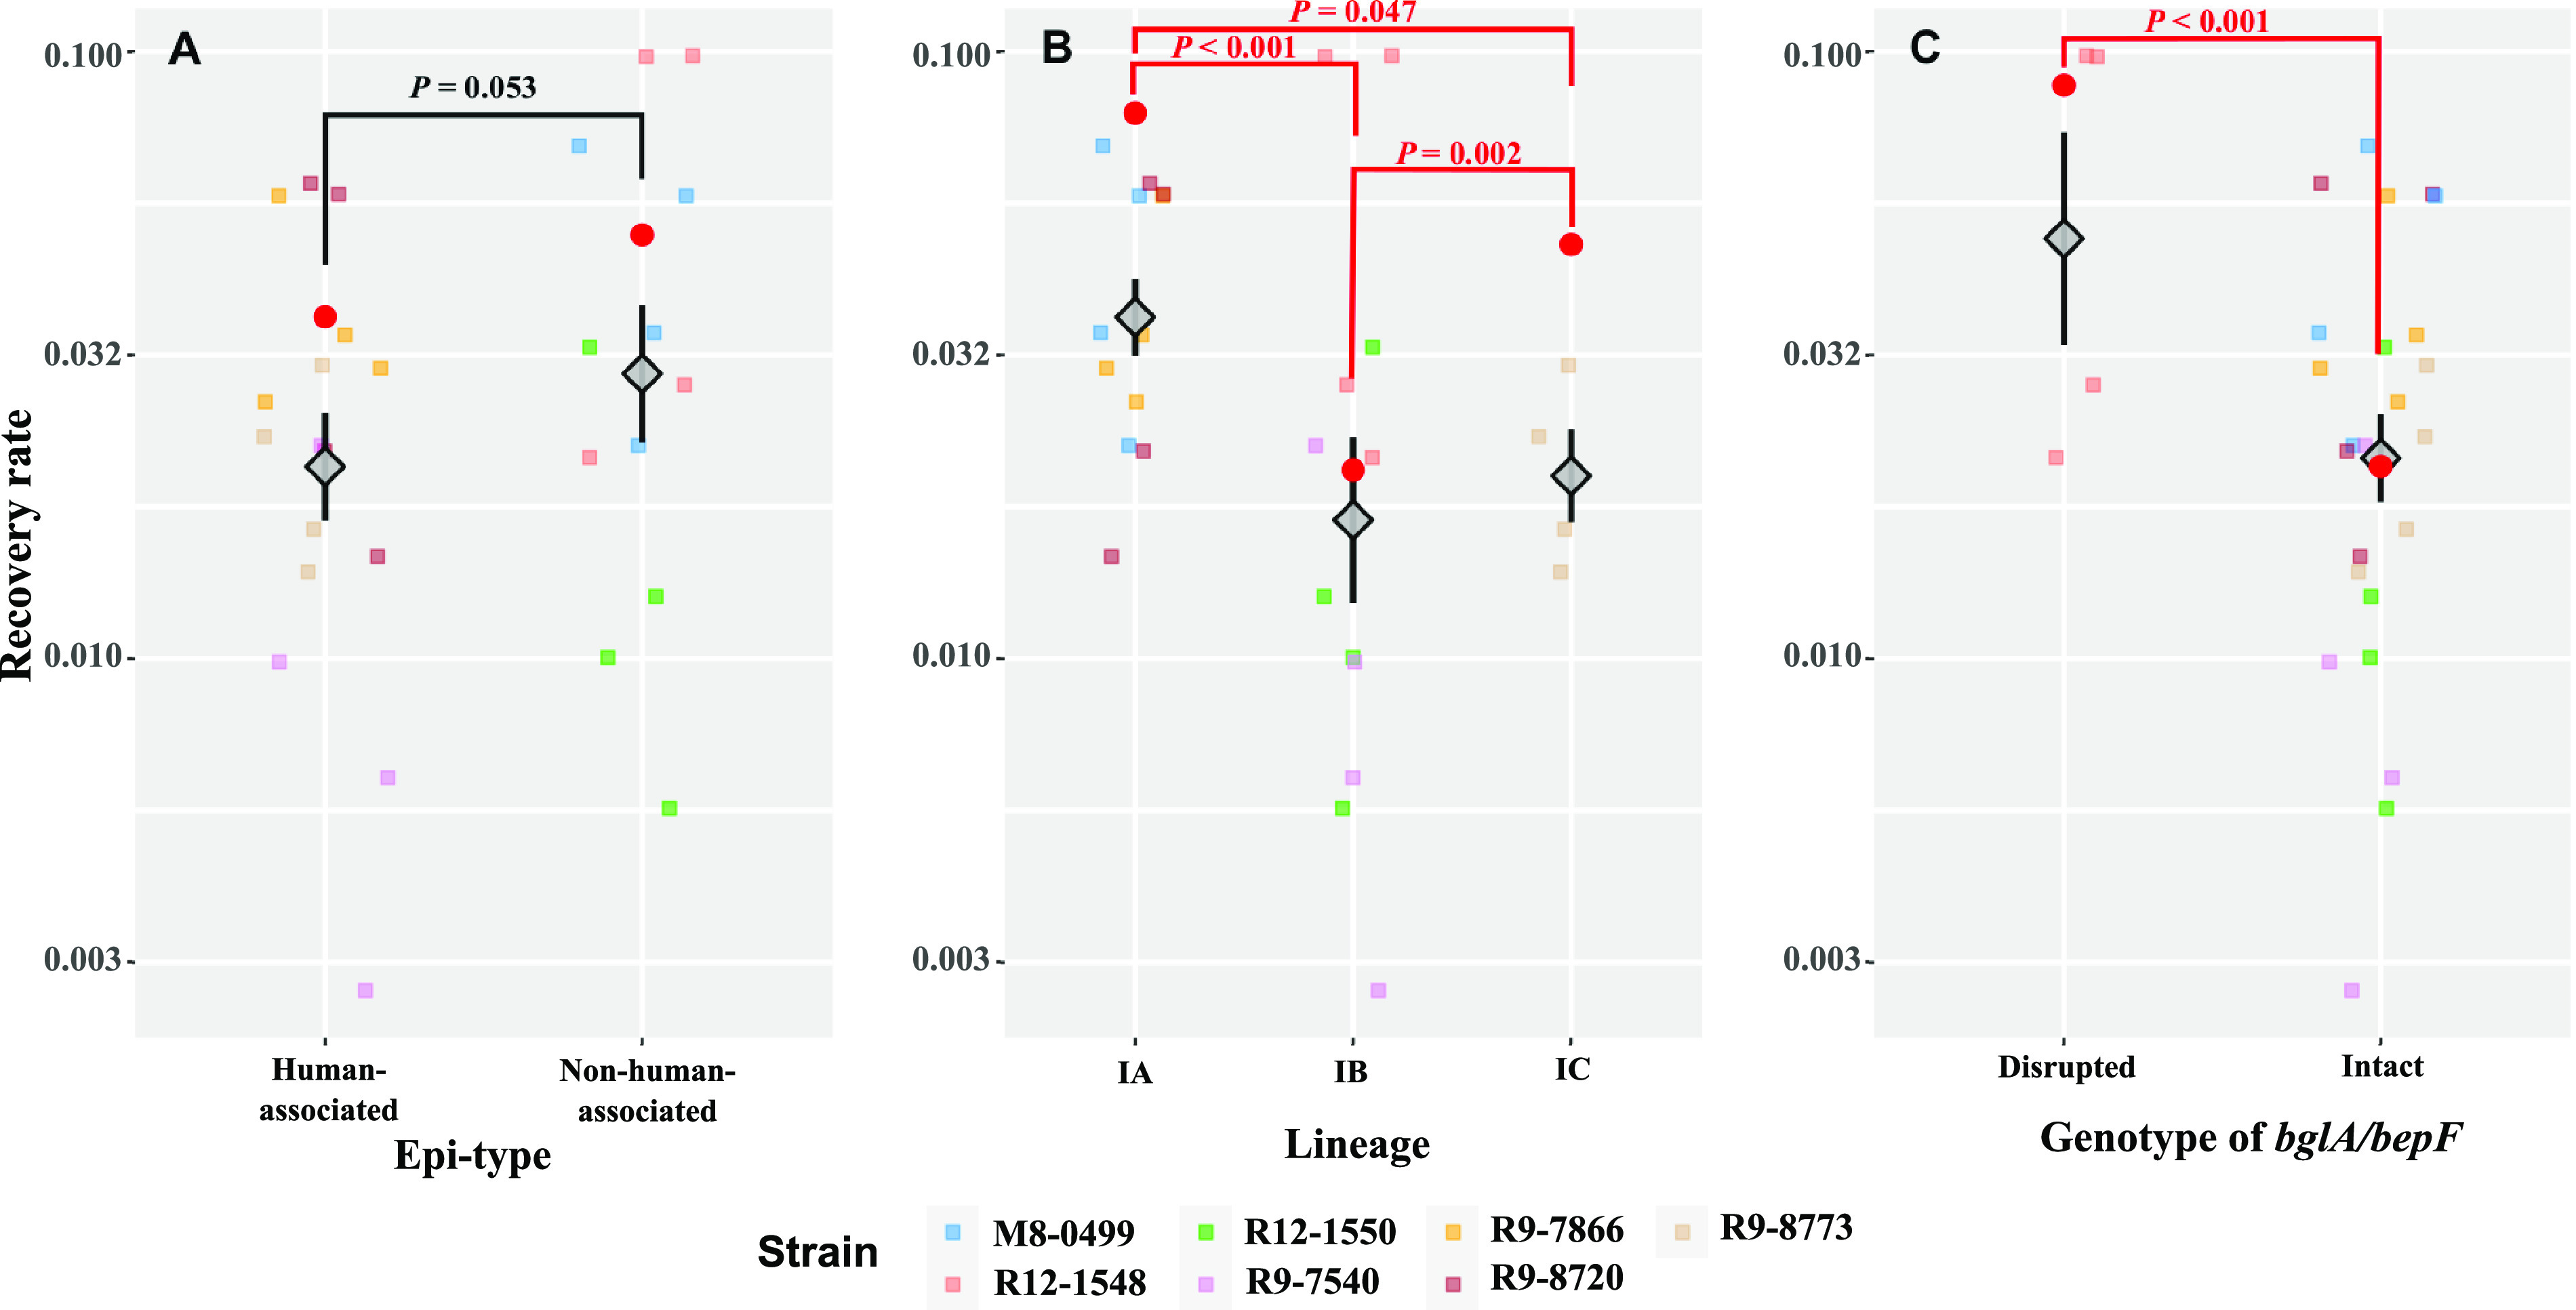
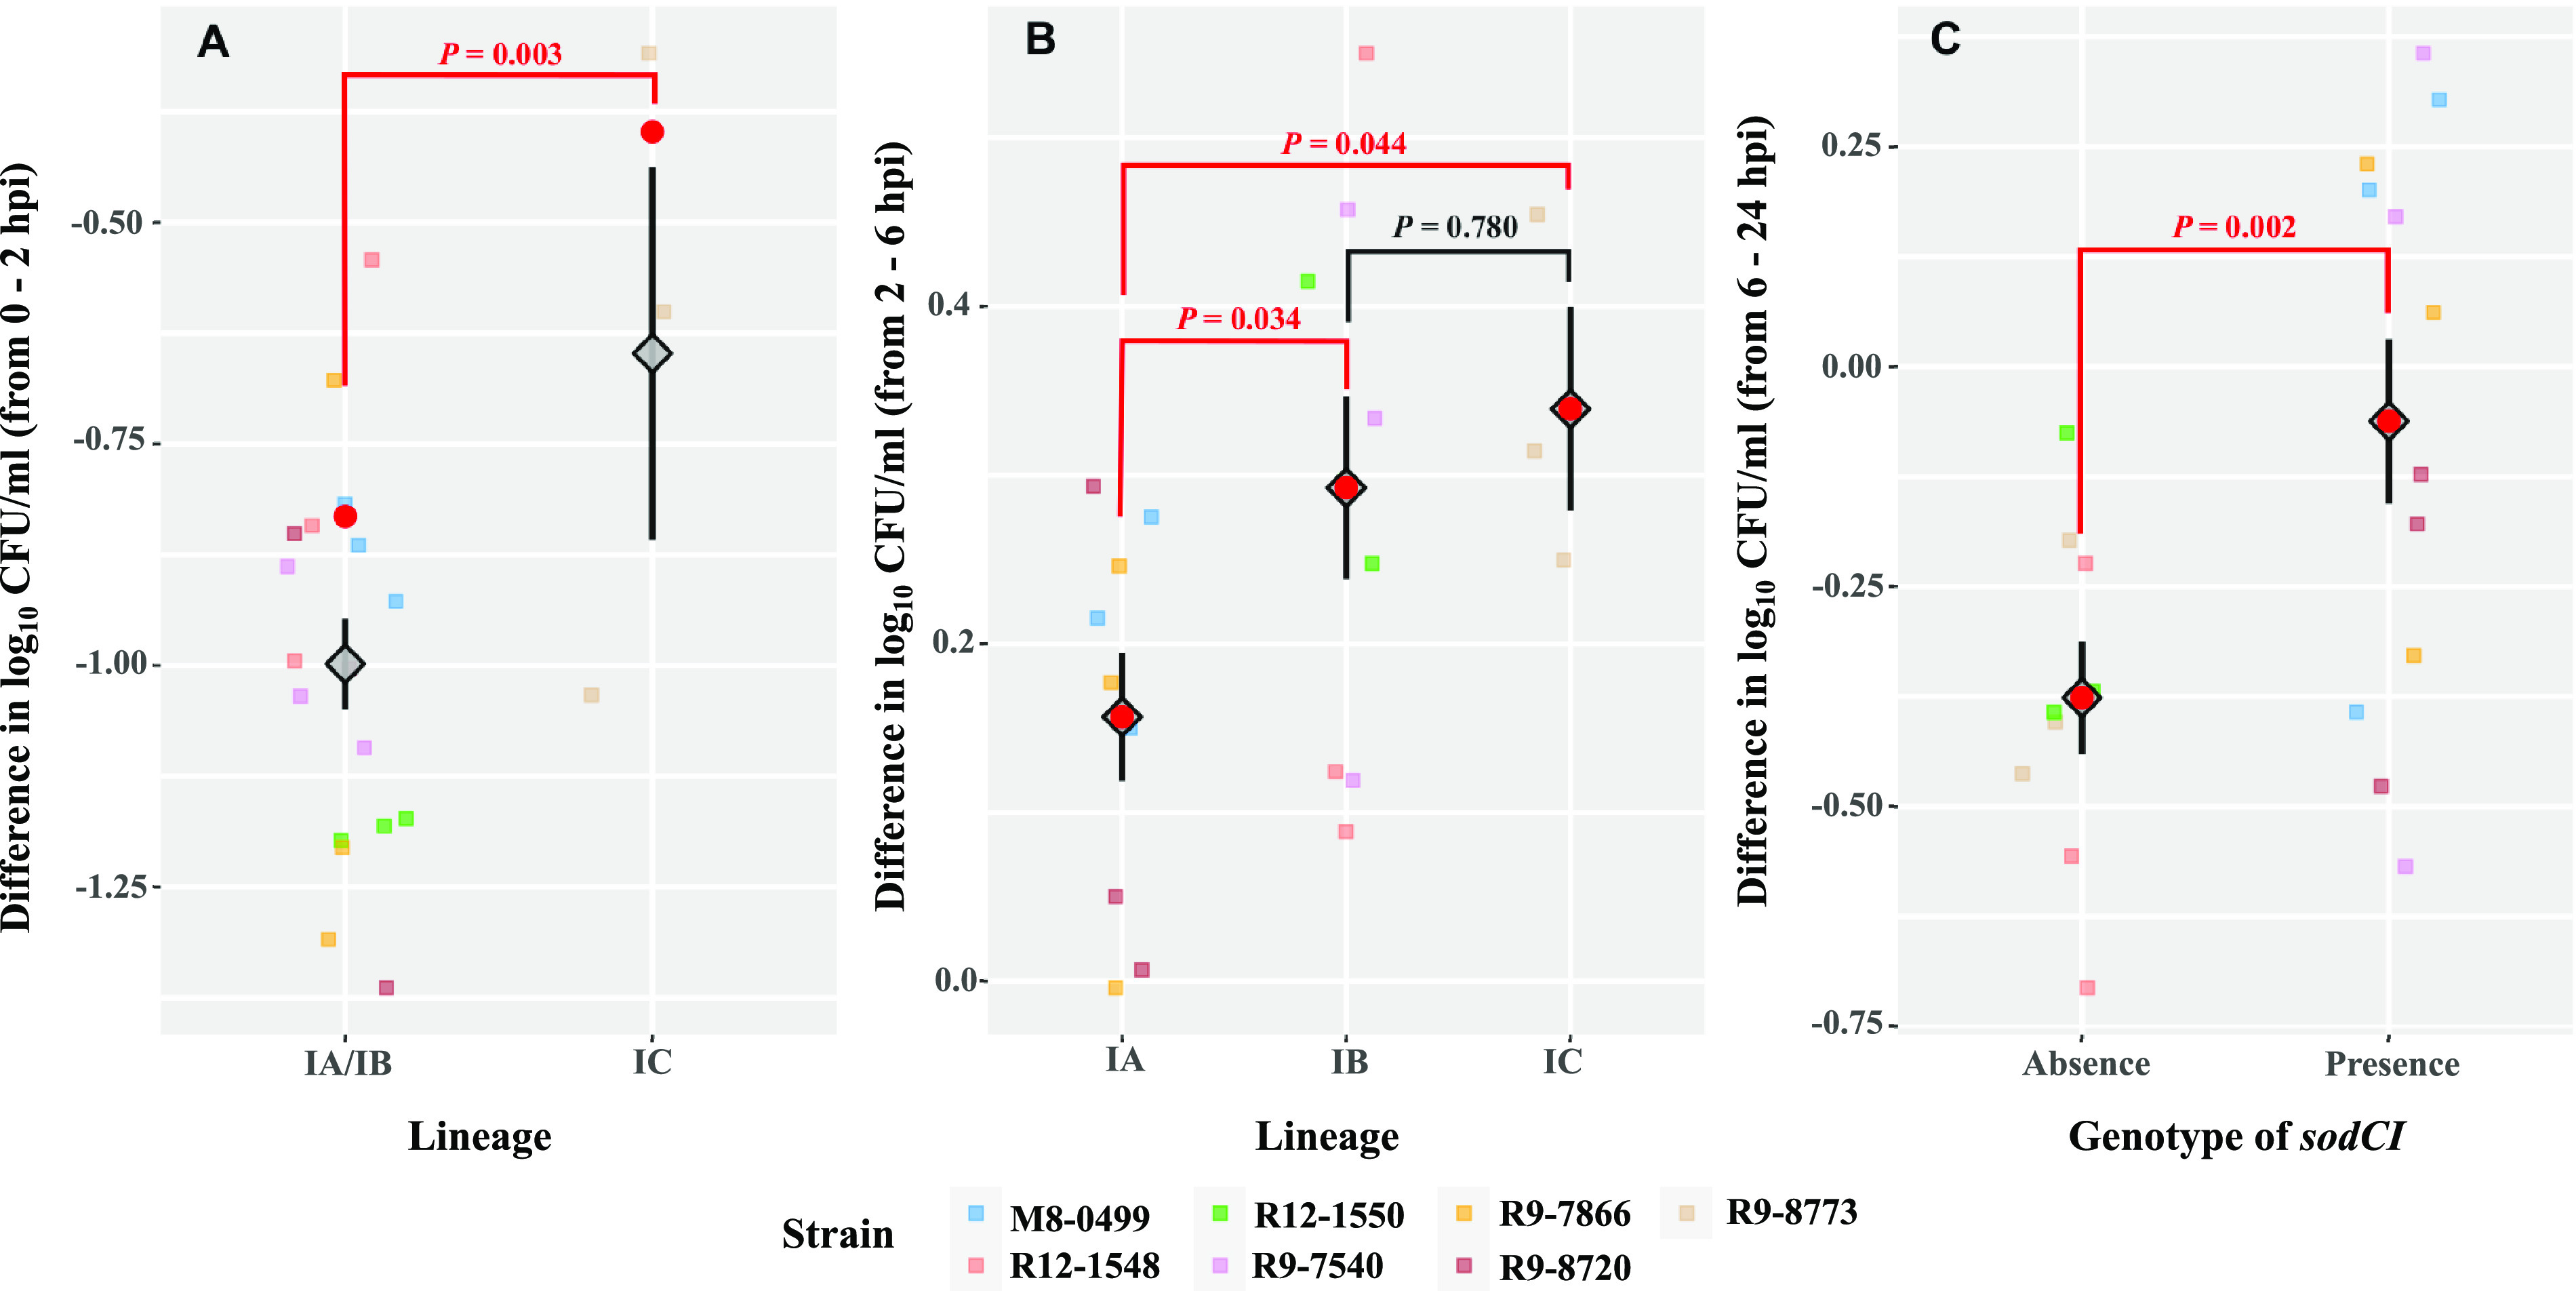
While differences in human virulence have been reported across nontyphoidal Salmonella (NTS) serovars and associated subtypes, a rational and scalable approach to identify Salmonella subtypes with differential ability to cause human diseases is not available. Here, we used NTS serovar Saintpaul (S. Saintpaul) as a model to determine if metadata and associated whole-genome sequence (WGS) data in the NCBI Pathogen Detection (PD) database can be used to identify (i) subtypes with differential likelihoods of causing human diseases and (ii) genes and single nucleotide polymorphisms (SNPs) potentially responsible for such differences. S. Saintpaul SNP clusters (n = 211) were assigned different epidemiology types (epi-types) based on statistically significant over- or underrepresentation of human clinical isolates, including human associated (HA; n = 29), non-human associated (NHA; n = 23), and other (n = 159). Comparative genomic analyses identified 384 and 619 genes overrepresented among isolates in 5 HA and 4 NHA SNP clusters most significantly associated with the respective isolation source. These genes included 5 HA-associated virulence genes previously reported to be present on Gifsy-1/Gifsy-2 prophages. Additionally, premature stop codons in 3 and 7 genes were overrepresented among the selected HA and NHA SNP clusters, respectively. Tissue culture experiments with strains representing 4 HA and 3 NHA SNP clusters did not reveal evidence for enhanced invasion or intracellular survival for HA strains. However, the presence of sodCI (encoding a superoxide dismutase), found in 4 HA and 1 NHA SNP clusters, was positively correlated with intracellular survival in macrophage-like cells. Post hoc analyses also suggested a possible difference in intracellular survival among S. Saintpaul lineages. IMPORTANCE Not all Salmonella isolates are equally likely to cause human disease, and Salmonella control strategies may unintentionally focus on serovars and subtypes with high prevalence in source populations but are rarely associated with human clinical illness. We describe a framework leveraging WGS data in the NCBI PD database to identify Salmonella subtypes over- and underrepresented among human clinical cases. While we identified genomic signatures associated with HA/NHA SNP clusters, tissue culture experiments failed to identify consistent phenotypic characteristics indicative of enhanced human virulence of HA strains. Our findings illustrate the challenges of defining hypo- and hypervirulent S. Saintpaul and potential limitations of phenotypic assays when evaluating human virulence, for which in vivo experiments are essential. Identification of sodCI, an HA-associated virulence gene associated with enhanced intracellular survival, however, illustrates the potential of the framework and is consistent with prior work identifying specific genomic features responsible for enhanced or reduced virulence of nontyphoidal Salmonella.
Keywords: SNP clusters; comparative genomic analyses; human virulence; intracellular survival; invasion; nontyphoidal Salmonella; pathogen detection; phenotypic characterization; regulatory policy; serovar Saintpaul.
Conflict of interest statement
The authors declare no conflict of interest.
Figures
Similar articles
-
Genomic characterization of endemic Salmonella enterica serovar Typhimurium and Salmonella enterica serovar I 4,[5],12:i:- isolated in Malaysia.Infect Genet Evol. 2018 Aug;62:109-121. doi: 10.1016/j.meegid.2018.04.027. Epub 2018 Apr 21. Infect Genet Evol. 2018. PMID: 29684710
-
Relationship and distribution of Salmonella enterica serovar I 4,[5],12:i:- strain sequences in the NCBI Pathogen Detection database.BMC Genomics. 2022 Apr 6;23(1):268. doi: 10.1186/s12864-022-08458-z. BMC Genomics. 2022. PMID: 35387579 Free PMC article.
-
The rare Salmonella enterica serovar Isangi: genomic characterization of the antimicrobial resistance, virulence potential and epidemiology of Brazilian strains in comparison to global isolates.J Med Microbiol. 2023 Jul;72(7). doi: 10.1099/jmm.0.001736. J Med Microbiol. 2023. PMID: 37462464
-
Embracing Diversity: Differences in Virulence Mechanisms, Disease Severity, and Host Adaptations Contribute to the Success of Nontyphoidal Salmonella as a Foodborne Pathogen.Front Microbiol. 2019 Jun 26;10:1368. doi: 10.3389/fmicb.2019.01368. eCollection 2019. Front Microbiol. 2019. PMID: 31316476 Free PMC article. Review.
-
Invasive Nontyphoidal Salmonella Infections Among Children in Mali, 2002-2014: Microbiological and Epidemiologic Features Guide Vaccine Development.Clin Infect Dis. 2015 Nov 1;61 Suppl 4(Suppl 4):S332-8. doi: 10.1093/cid/civ729. Clin Infect Dis. 2015. PMID: 26449949 Free PMC article. Review.
Cited by
-
Causal Mediation Analysis of Foodborne Salmonella Outbreaks in the United States: Serotypes and Food Vehicles.Pathogens. 2024 Dec 22;13(12):1134. doi: 10.3390/pathogens13121134. Pathogens. 2024. PMID: 39770393 Free PMC article.
-
Salmonella associated with agricultural animals exhibit diverse evolutionary rates and show evidence of recent clonal expansion.mBio. 2024 Oct 16;15(10):e0191324. doi: 10.1128/mbio.01913-24. Epub 2024 Sep 17. mBio. 2024. PMID: 39287448 Free PMC article.
-
Identifying a list of Salmonella serotypes of concern to target for reducing risk of salmonellosis.Front Microbiol. 2024 Feb 12;15:1307563. doi: 10.3389/fmicb.2024.1307563. eCollection 2024. Front Microbiol. 2024. PMID: 38410382 Free PMC article.
-
Salmonella enterica serovar Braenderup shows clade-specific source associations and a high proportion of molecular epidemiological clustering.Appl Environ Microbiol. 2025 Apr 23;91(4):e0259424. doi: 10.1128/aem.02594-24. Epub 2025 Mar 21. Appl Environ Microbiol. 2025. PMID: 40116507 Free PMC article.
-
What's on a prophage: analysis of Salmonella spp. prophages identifies a diverse range of cargo with multiple virulence- and metabolism-associated functions.mSphere. 2024 Jun 25;9(6):e0003124. doi: 10.1128/msphere.00031-24. Epub 2024 May 22. mSphere. 2024. PMID: 38775467 Free PMC article.
References
-
- Havelaar AH, Kirk MD, Torgerson PR, Gibb HJ, Hald T, Lake RJ, Praet N, Bellinger DC, de Silva NR, Gargouri N, Speybroeck N, Cawthorne A, Mathers C, Stein C, Angulo FJ, Devleesschauwer B, World Health Organization Foodborne Disease Burden Epidemiology Reference Group. 2015. World Health Organization global estimates and regional comparisons of the burden of foodborne disease in 2010. PLoS Med 12:e1001923. doi:10.1371/journal.pmed.1001923. - DOI - PMC - PubMed
-
- Stanaway JD, Reiner RC, Blacker BF, Goldberg EM, Khalil IA, Troeger CE, Andrews JR, Bhutta ZA, Crump JA, Im J, Marks F, Mintz E, Park SE, Zaidi AKM, Abebe Z, Abejie AN, Adedeji IA, Ali BA, Amare AT, Atalay HT, Avokpaho EFGA, Bacha U, Barac A, Bedi N, Berhane A, Browne AJ, Chirinos JL, Chitheer A, Dolecek C, El Sayed Zaki M, Eshrati B, Foreman KJ, Gemechu A, Gupta R, Hailu GB, Henok A, Hibstu DT, Hoang CL, Ilesanmi OS, Iyer VJ, Kahsay A, Kasaeian A, Kassa TD, Khan EA, Khang Y-H, Magdy Abd El Razek H, Melku M, Mengistu DT, Mohammad KA, Mohammed S, et al. . 2019. The global burden of typhoid and paratyphoid fevers: a systematic analysis for the Global Burden of Disease Study 2017. Lancet Infect Dis 19:369–381. doi:10.1016/S1473-3099(18)30685-6. - DOI - PMC - PubMed
-
- Voetsch AC, Van Gilder TJ, Angulo FJ, Farley MM, Shallow S, Marcus R, Cieslak PR, Deneen VC, Tauxe RV, Emerging Infections Program FoodNet Working Group. 2004. FoodNet estimate of the burden of illness caused by nontyphoidal Salmonella infections in the United States. Clin Infect Dis 38:S127–S134. doi:10.1086/381578. - DOI - PubMed
Publication types
MeSH terms
Supplementary concepts
LinkOut - more resources
Full Text Sources
