. 2022 Mar 2;110(5):809-823.e5.
doi: 10.1016/j.neuron.2021.12.007. Epub 2022 Jan 4.

Glutamate in primary afferents is required for itch transmission

Affiliations

Glutamate in primary afferents is required for itch transmission

Lian Cui et al. Neuron. .

Abstract

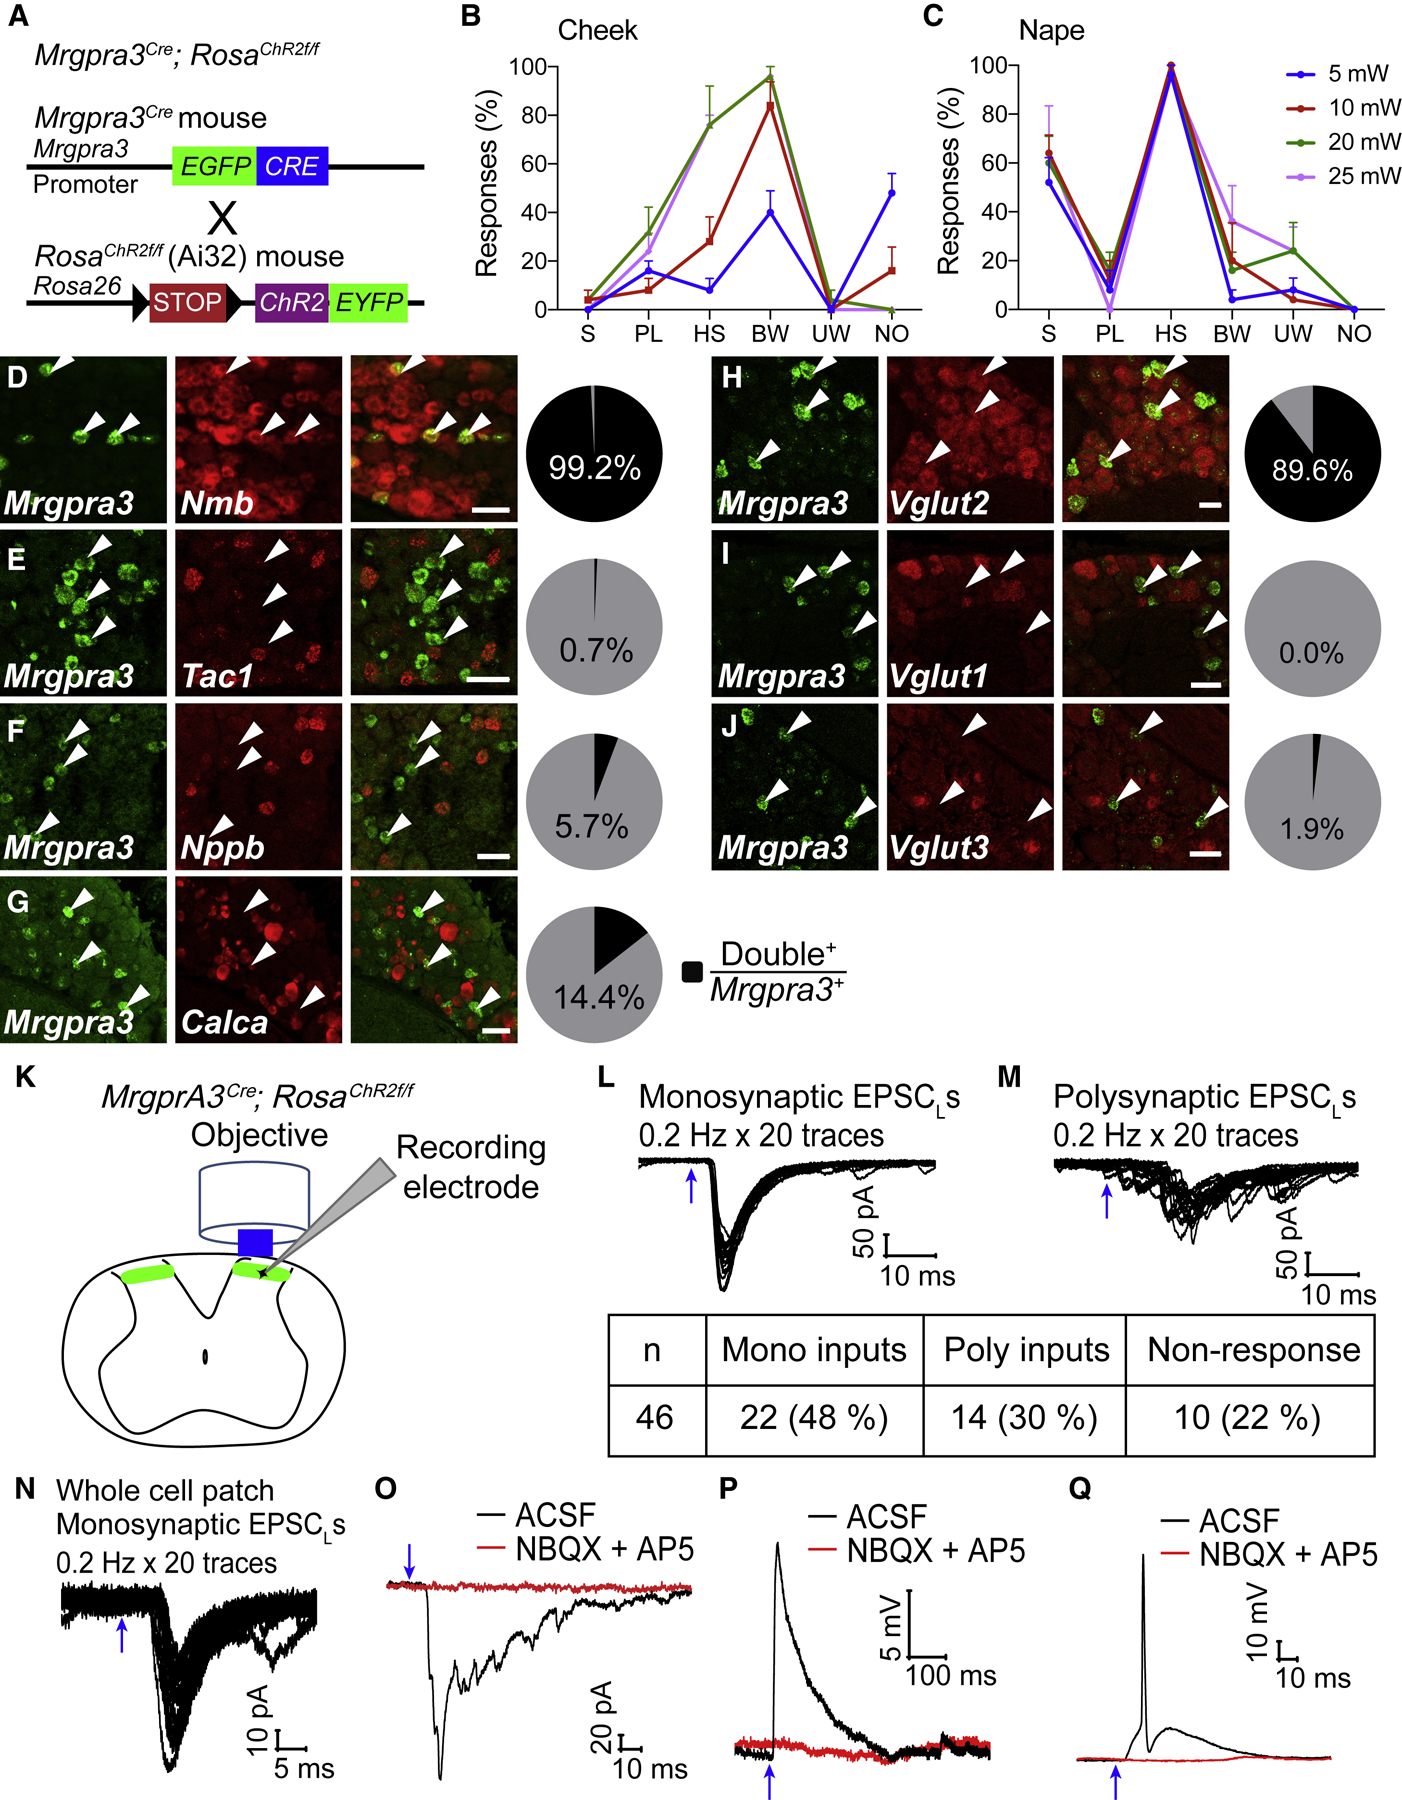
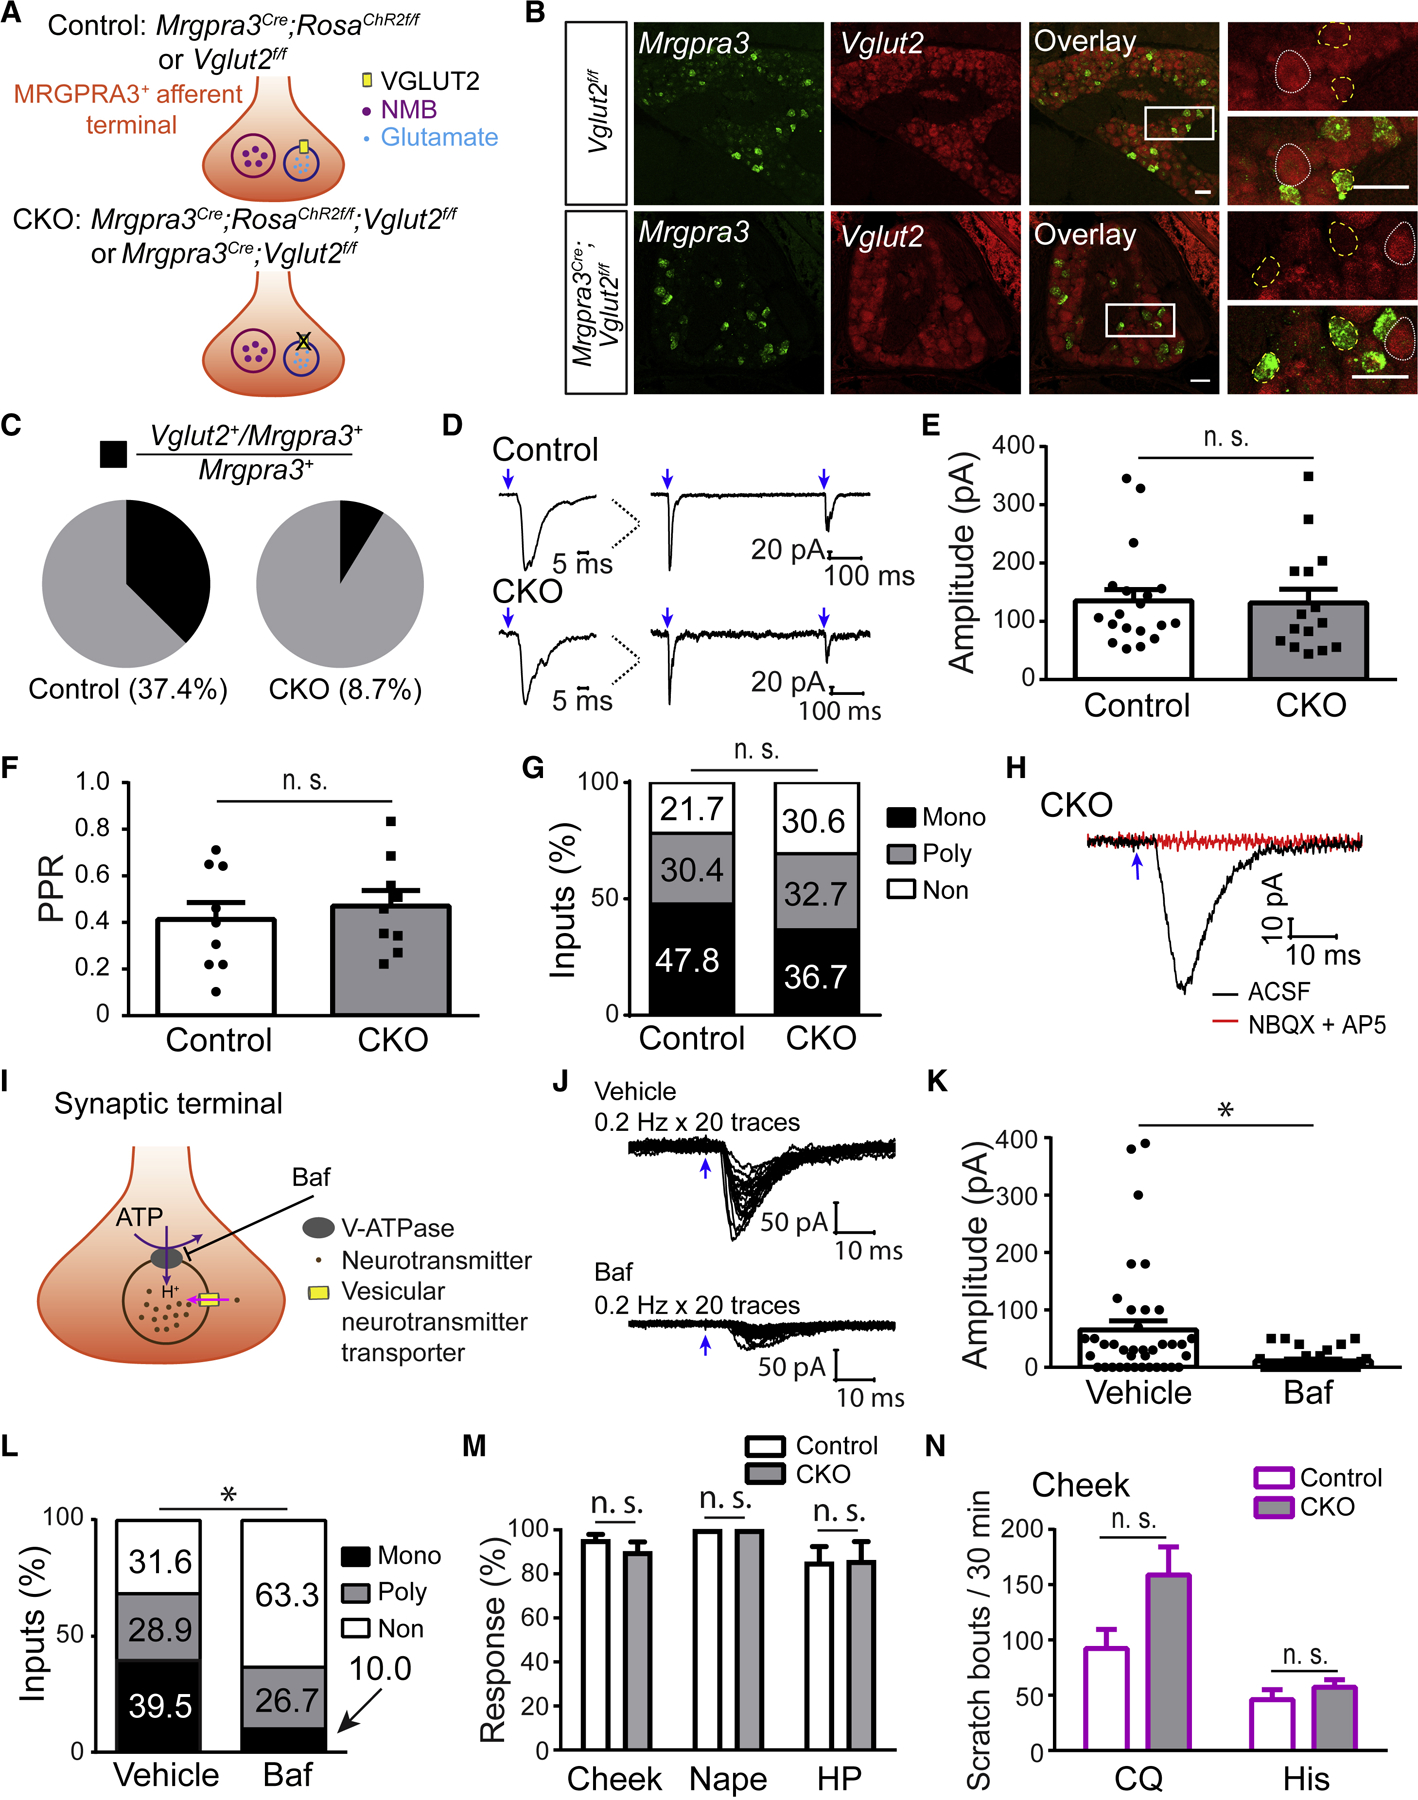
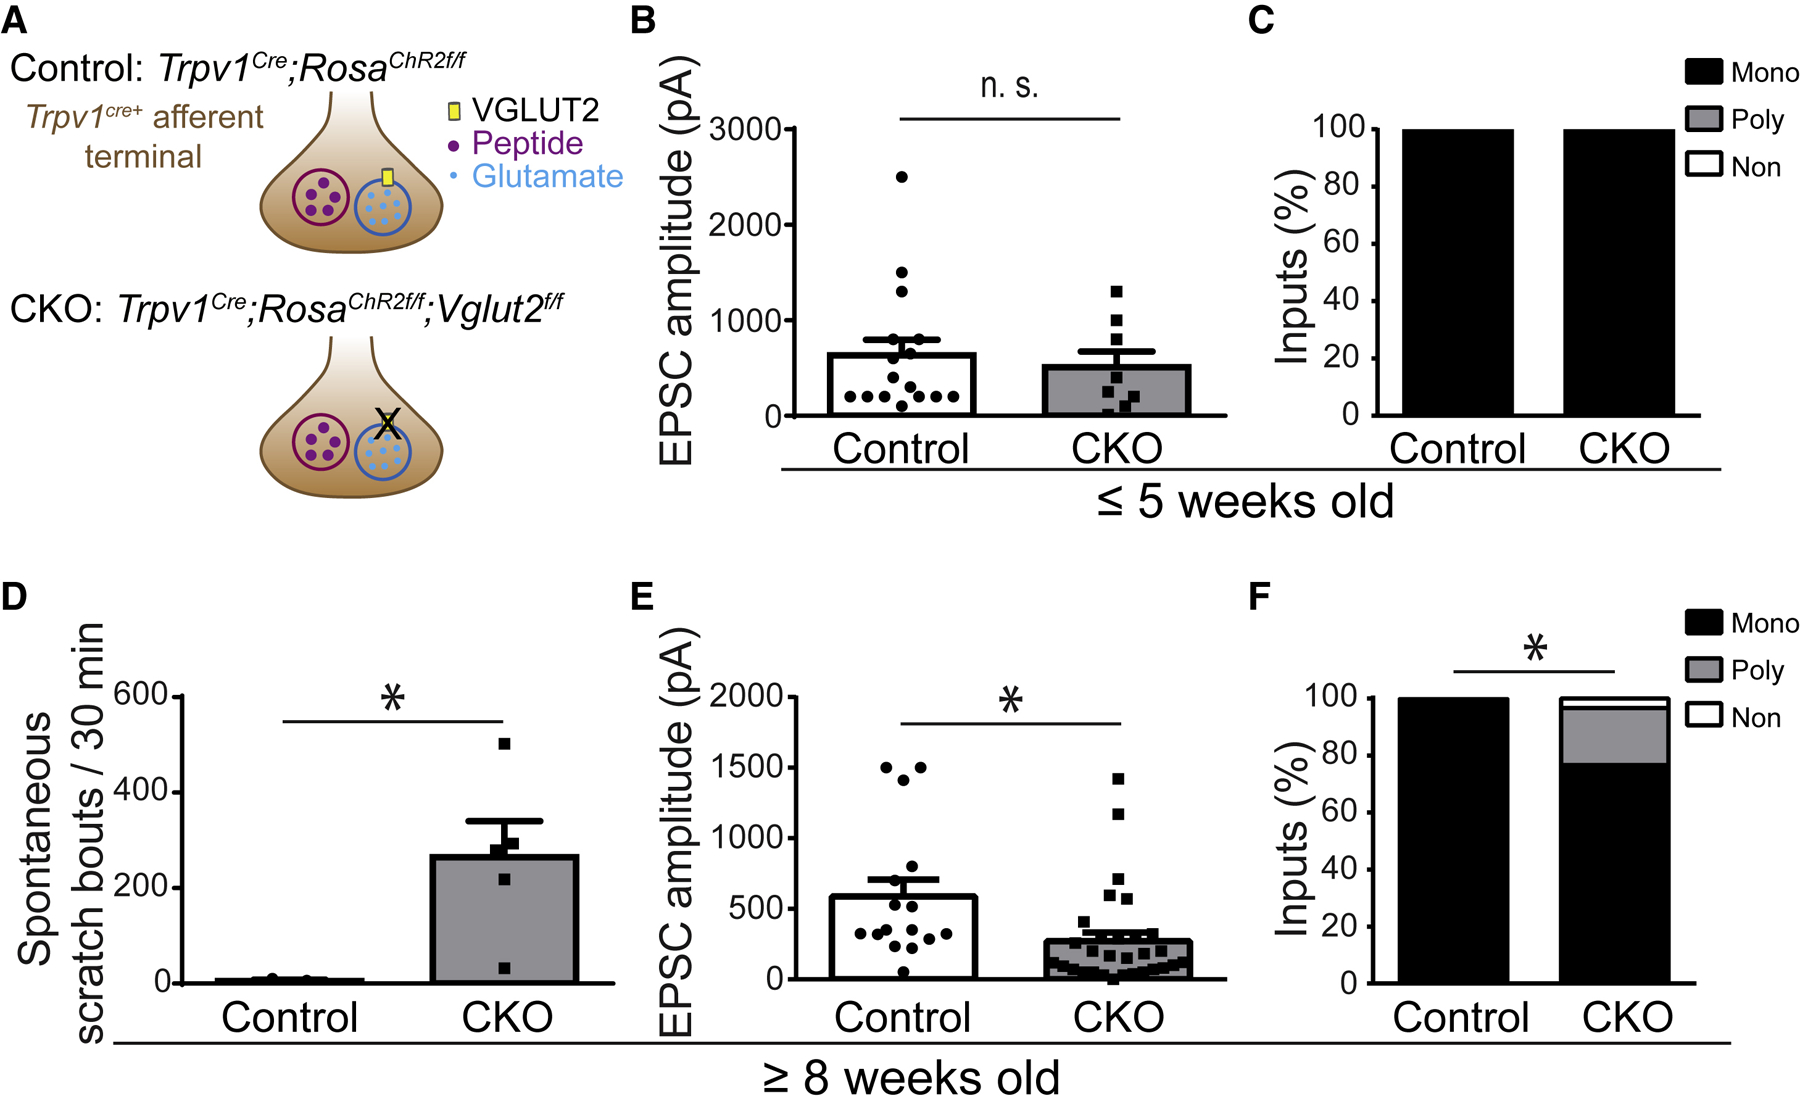
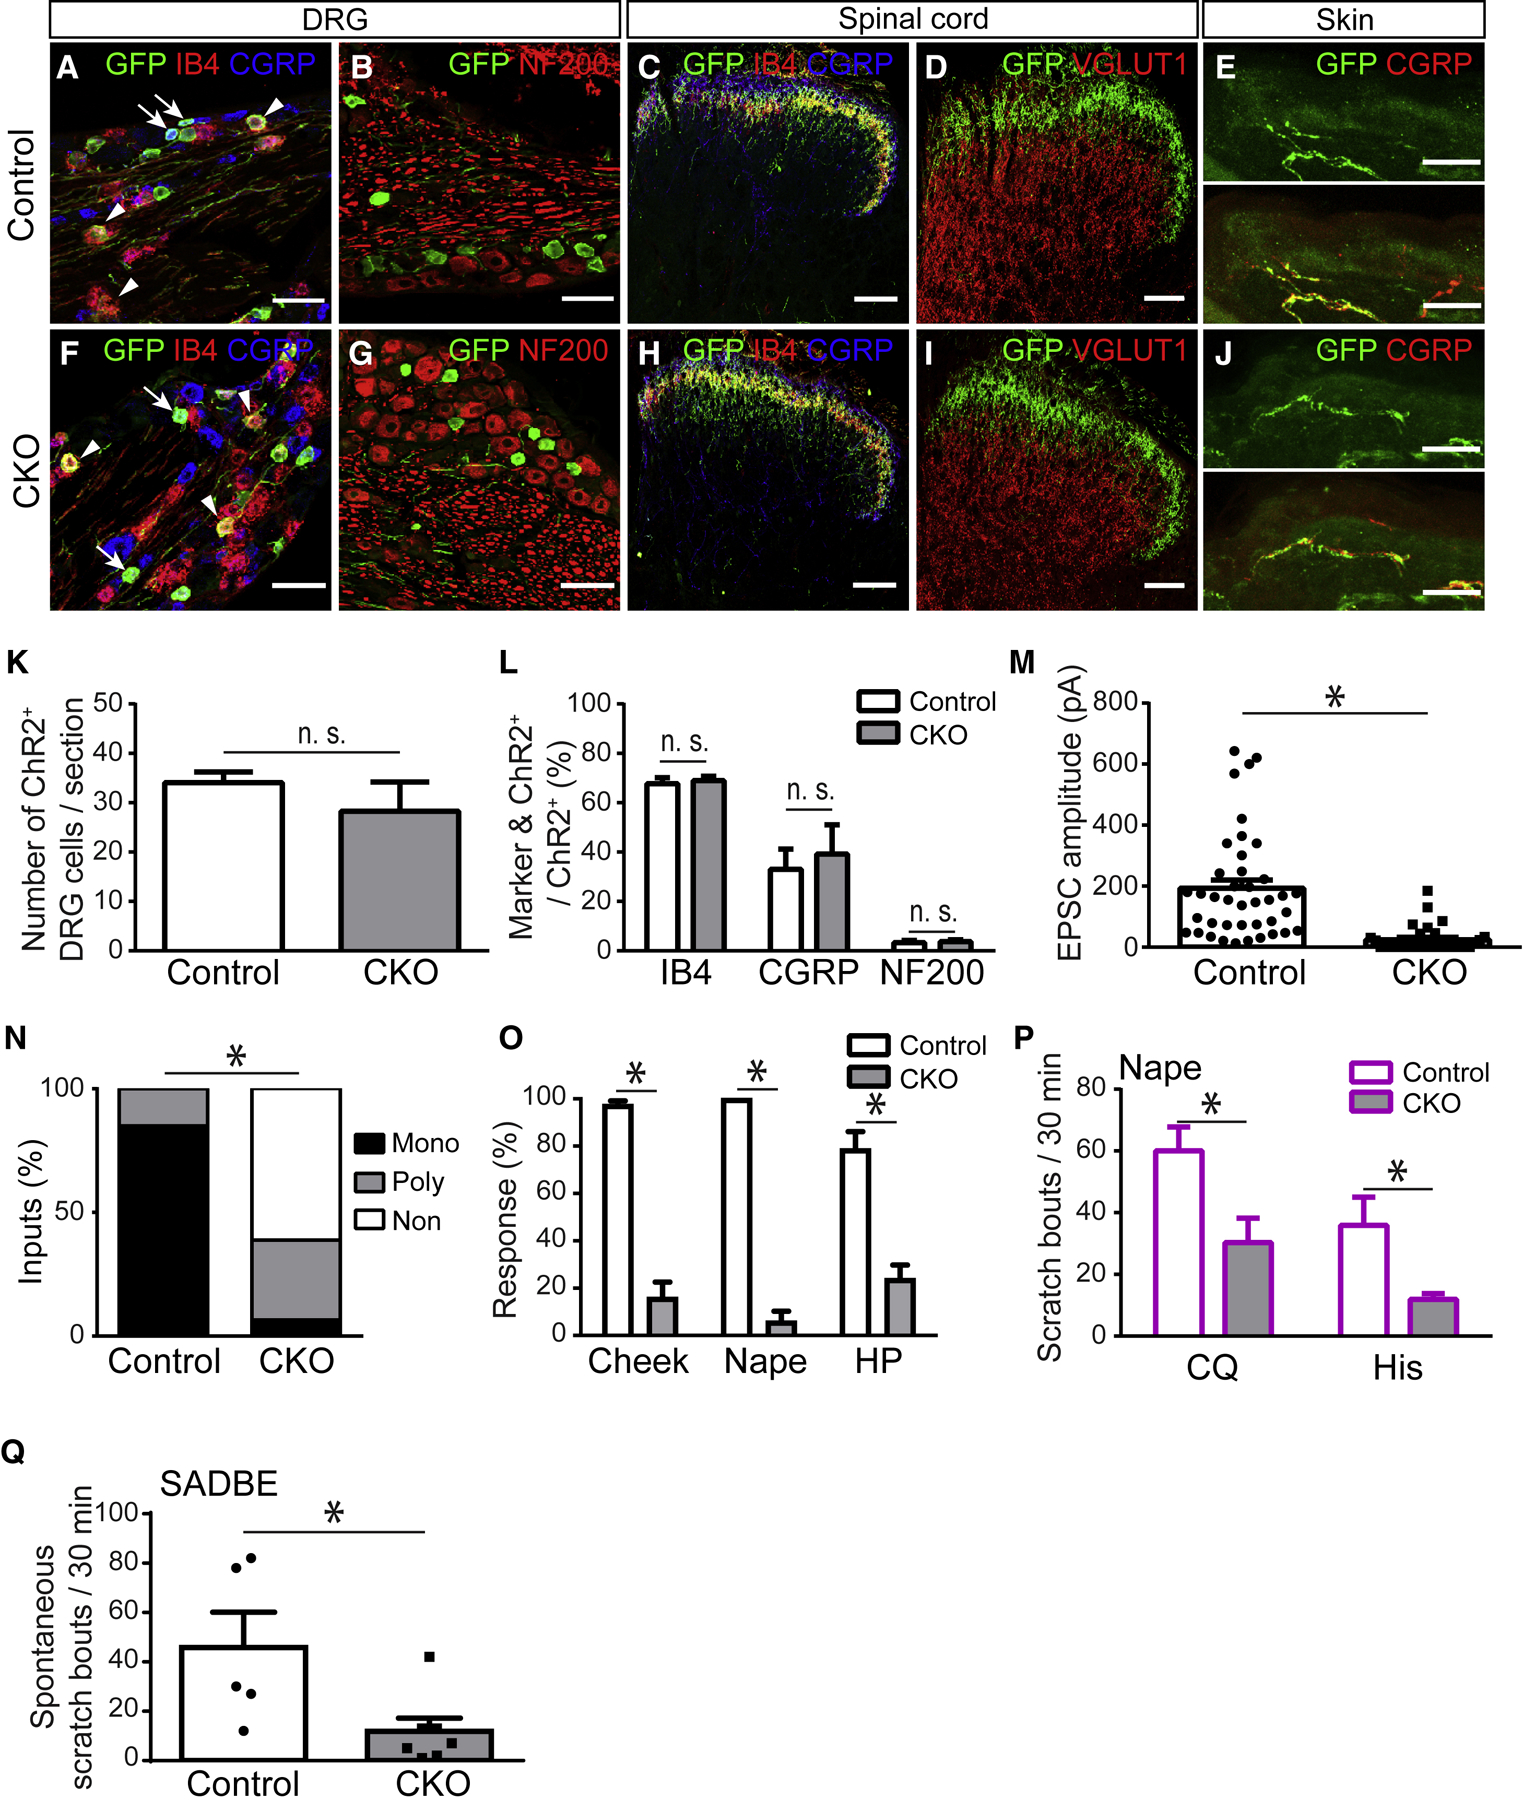
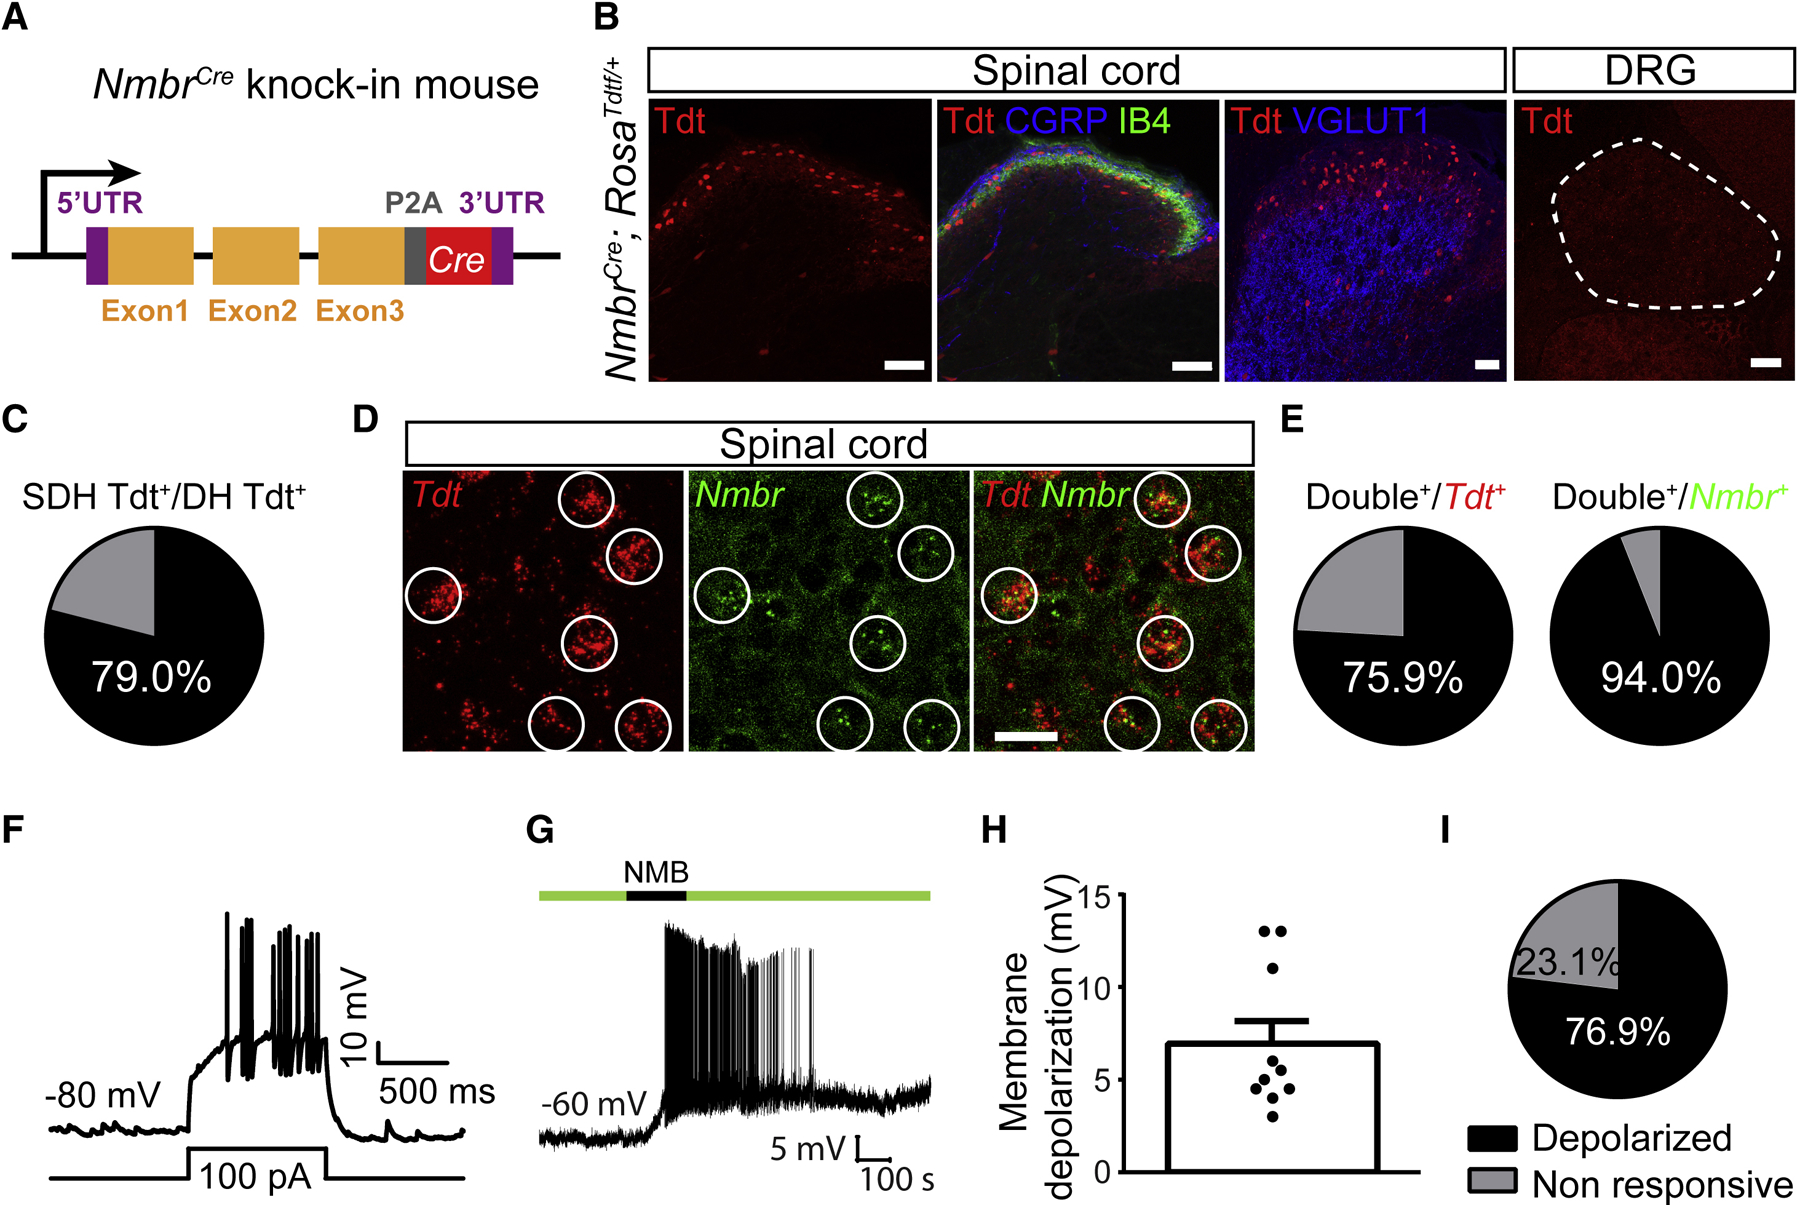
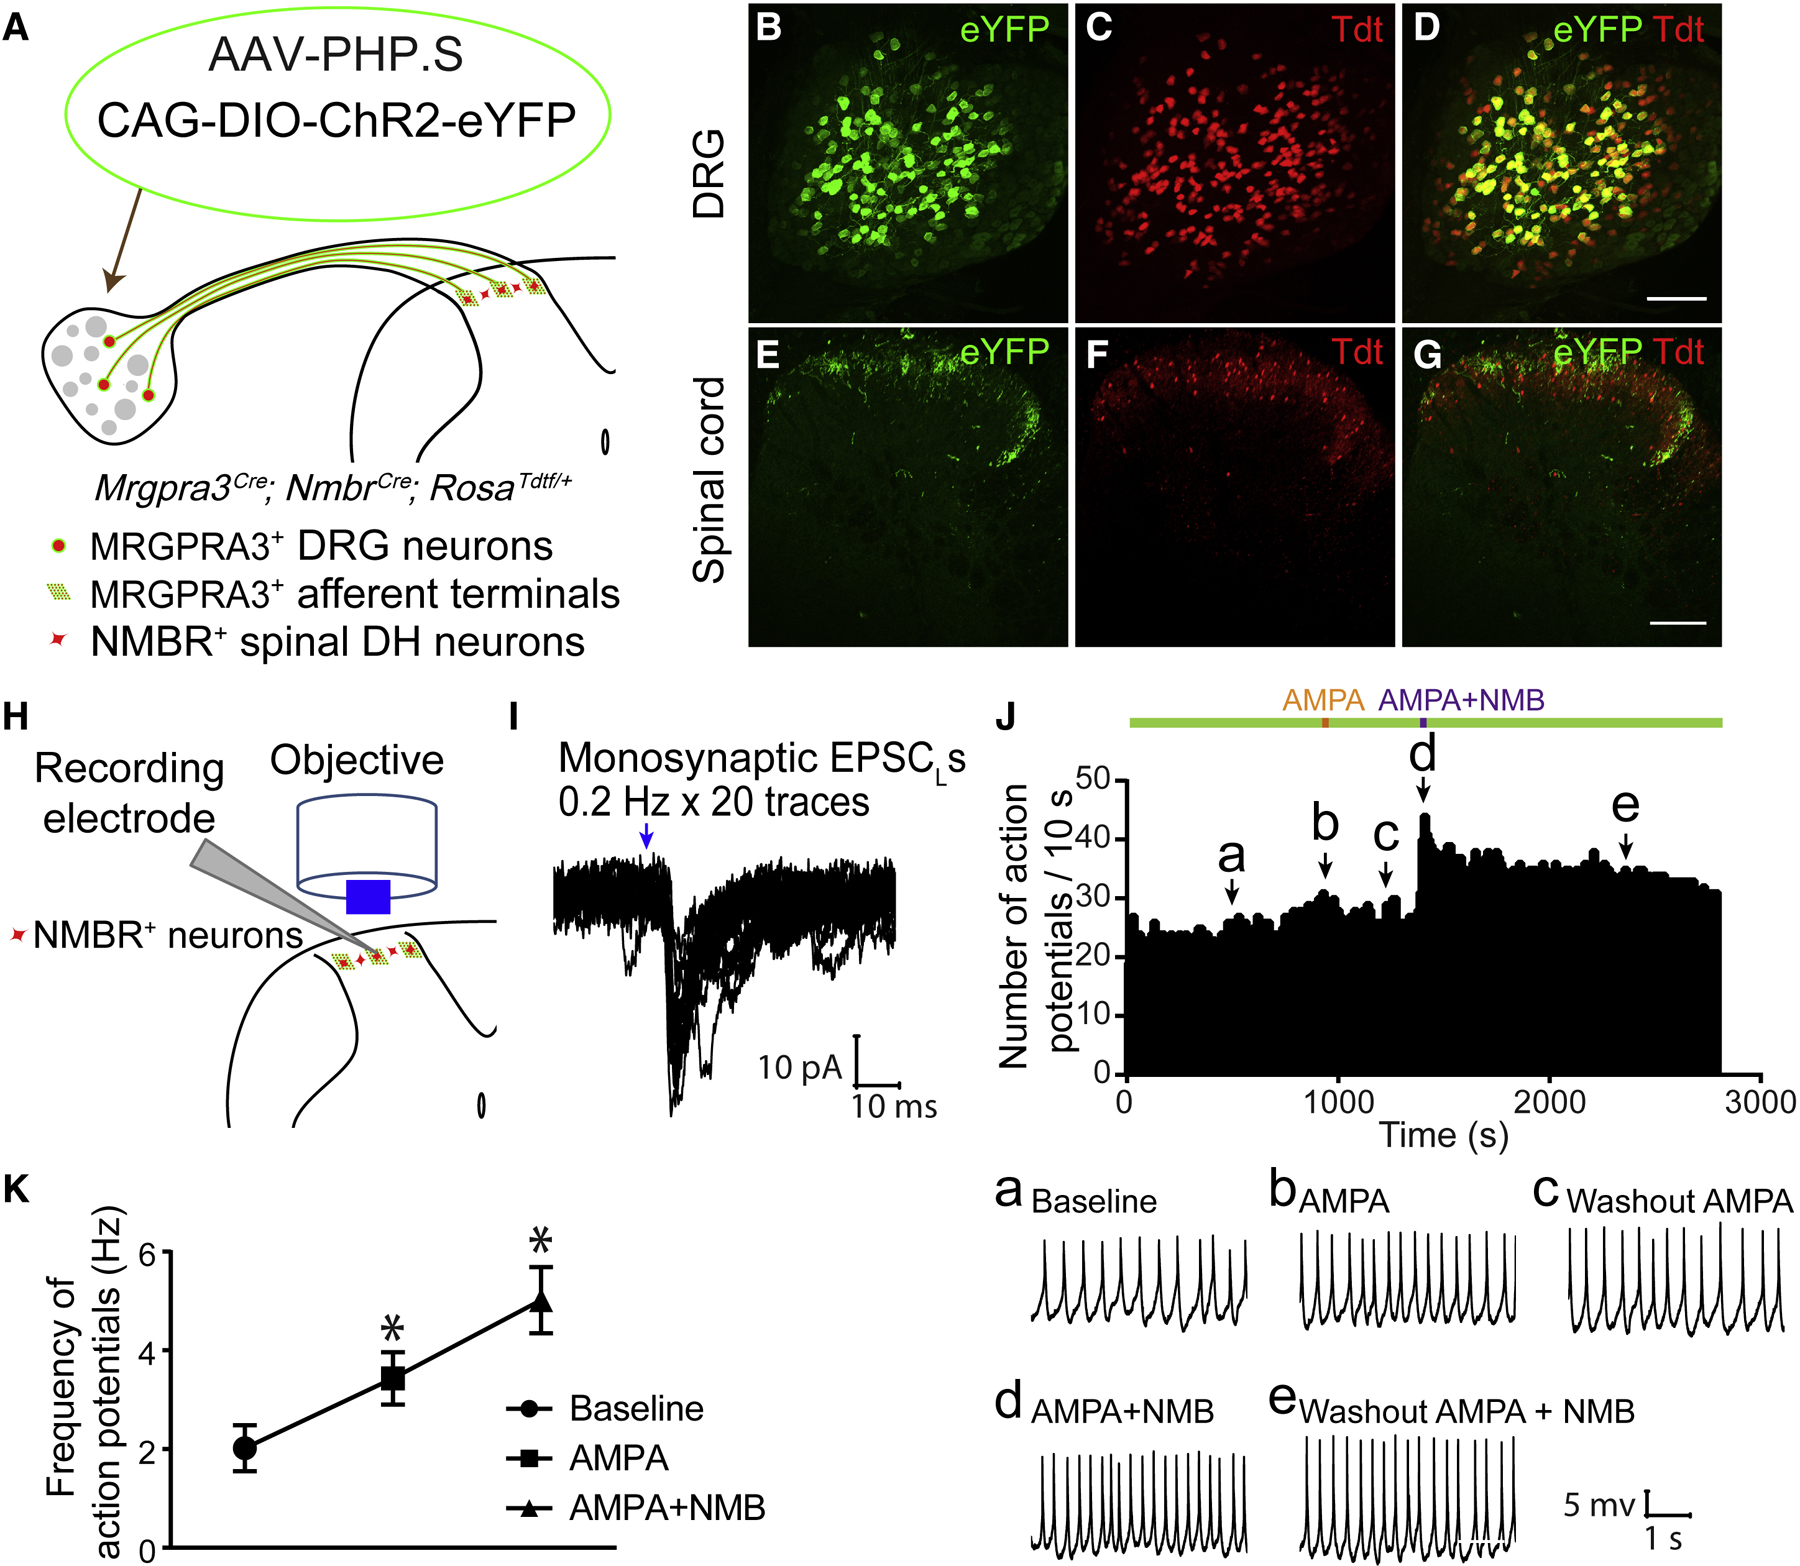
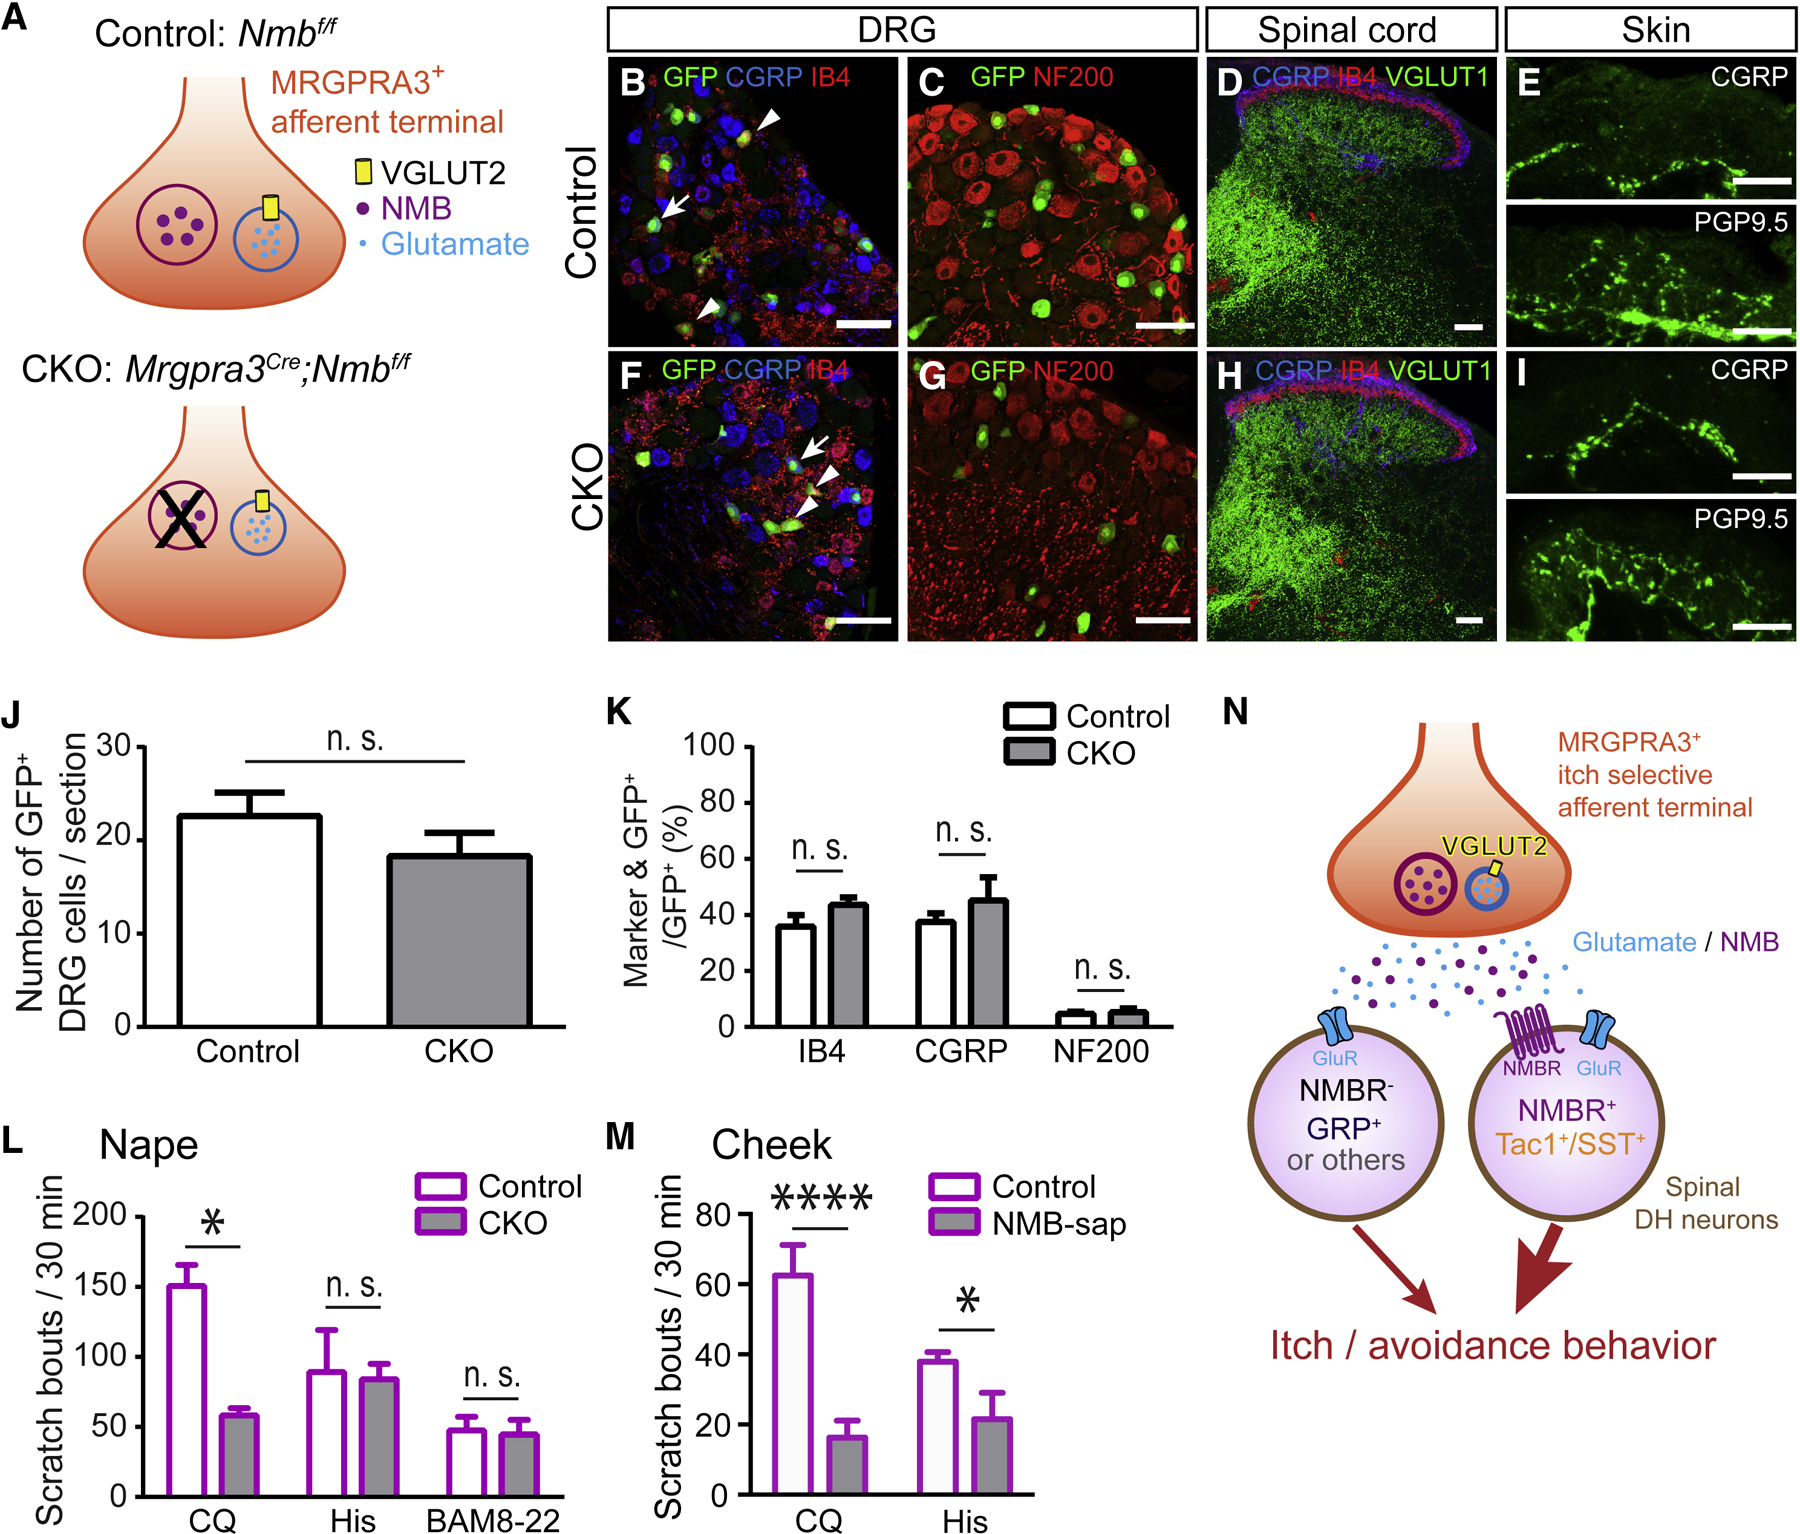
Whether glutamate or itch-selective neurotransmitters are used to confer itch specificity is still under debate. We focused on an itch-selective population of primary afferents expressing MRGPRA3, which highly expresses Vglut2 and the neuropeptide neuromedin B (Nmb), to investigate this question. Optogenetic stimulation of MRGPRA3+ afferents triggers scratching and other itch-related avoidance behaviors. Using a combination of optogenetics, spinal cord slice recordings, Vglut2 conditional knockout mice, and behavior assays, we showed that glutamate is essential for MRGPRA3+ afferents to transmit itch. We further demonstrated that MRGPRA3+ afferents form monosynaptic connections with both NMBR+ and NMBR- neurons and that NMB and glutamate together can enhance the activity of NMBR+ spinal DH neurons. Moreover, Nmb in MRGPRA3+ afferents and NMBR+ DH neurons are required for chloroquine-induced scratching. Together, our results establish a new model in which glutamate is an essential neurotransmitter in primary afferents for itch transmission, whereas NMB signaling enhances its activities.

Keywords: MRGPRA3+ afferents; NMB; VGLUT2; behavior assays; glutamate; high-speed imaging; itch-selective neurotransmitter; optogenetic stimulation; spinal cord slice recordings.


Conflict of interest statement

Declaration of interests V.G. is a member of the Neuron Advisory Board. V.G. is also a cofounder and board member of Capsida Biotherapeutics, a fully integrated AAV engineering and gene therapy company. The other authors declare no competing interests.

Figures

Figure 1.
Figure 1.. Optical stimulation of Mrgpra3-ChR2 mice triggers itch-related behaviors and Nmb and Vglut2 are highly expressed in Mrgpra3+ DRG neurons.
(A) Diagram showing genomic structure of Mrgpra3cre; RosaChR2f/f mice. (B and C) The percentage of Mrgpra3-ChR2 mouse behaviors in response to different intensities of blue laser stimuli at the cheek or nape of the neck, including scratching (S), ipsilateral paw lifting (PL), head shaking (HS), grooming (G), wiping (W) or no response (NO). Each dot indicates one animal. 10 trials per six-month-old mouse, n=5. (D-J) Double fluorescent in situ hybridization of Mrgpra3 (green) and Nmb, Tac1, Nppb, Calca, and vesicular glutamate transporters Vglut1, Vglut2, and Vglut3 (red) using lumbar DRG sections of three-week-old wild-type mice. Arrowheads indicate some Mrgpra3+ neurons. Pie charts show the quantification. Scale bars, 50 µm. 6–8 sections/mouse, n=3. (K) Schematic of recording from superficial DH neurons using spinal cord slices of four- to six-week-old Mrgpra3Cre; RosaChR2f/f mice. (L and M) Representative traces of repetitive blue laser-induced EPSCs (EPSCLs). Monosynaptic or polysynaptic EPSCLs were differentiated by 0.2 Hz, 20 times blue laser stimuli (blue arrows). Quantification of monosynaptic, polysynaptic, and non-response types is shown in the table. (N-Q) In neurons with light stimulation-induced monosynaptic responses (N), monosynaptic EPSCLs (O, black trace), EPSPLs (P, black trace), and action potentials (Q, black trace) were completely blocked by glutamate receptor antagonists, NBQX (20 µM) and AP5 (50 µM) (red traces). Data are presented as mean ± SEM. See also Figure S1, S2, Table S1, and Videos 1 and 2.
Figure 2.
Figure 2.. Light-induced synaptic responses and behaviors are retained in juvenile and young adult Mrgpra3-Vglut2 CKO mice.
(A) Illustration showing MRGPRA3+ afferent terminal of Mrgpra3Cre; RosaChR2f/f (control) and Mrgpra3Cre; RosaChR2f/f; Vglut2f/f (Mrgpra3-Vglut2 CKO) mice. (B) Double fluorescent in situ hybridization of Mrgpra3 (green) and Vglut2 (red) in DRG sections of Vglut2f/f and CKO mice at three weeks of age. Images in the rectangles are enlarged. White circles indicate Vglut2+Mrgpra3- neurons. Yellow circles indicate Mrgpra3+ neurons. Scale bars, 50 µm. 6–8 sections/mouse, n=3. (C) Quantification of Vglut2+Mrgpra3+ cells in lumbar and thoracic DRG of three-week-old control and CKO mice. 1–6 sections/mouse, n=2–3. (D) Representative paired light stimulation-induced monosynaptic EPSC traces recorded from superficial DH neurons of four- to six-week-old control and CKO mouse spinal cord slices. (E and F) Quantification of monosynaptic EPSCL amplitude and PPR in control and CKO groups. (G) Quantification of response-type proportion in control and CKO mice. (H) A representative trace of a monosynaptic EPSCL (black trace) recorded from a superficial DH neuron in a CKO mouse spinal cord slice, which is completely blocked by glutamate receptor antagonists, NBQX and AP5 (red trace). (I) Representative traces of monosynaptic EPSCLs recorded from superficial DH neurons of CKO mouse spinal cord slices after vehicle or bafilomycin A1 treatments. (J and K) Quantification of EPSCL amplitude and response-type proportion in bafilomycin A1- or vehicle-treated groups in CKO mice. (M) The percentage of responses induced by light stimulation of the cheek, nape, or hind paw (HP) were not significantly different between control and CKO mice around two months of age. (N) CQ- or histamine-induced scratch bouts after cheek injections were not significantly different between control and CKO mice. Data are presented as mean ± SEM. Unpaired Student’s t-test in E, F, K, M, and N; chi-square test in G and L. * p<0.05; n.s., not significant. See also Figure S3, S4, Table S2, and Video 3.
Figure 3.
Figure 3.. Age-dependent deficits in synaptic transmission and itch behaviors of Trpv1-Vglut2 CKO mice.
(A) Illustration showing afferent terminals of Trpv1Cre; RosaChR2f/f (control) and Trpv1Cre; RosaChR2f/f; Vglut2f/f (Trpv1-Vglut2 CKO) mice. (B and C) Quantification of amplitude of EPSCLs and input proportion of recorded superficial DH neurons in spinal cord slices of ≤five-week-old control and CKO mice. (D) Quantification of spontaneous scratching in ≥eight-week-old control and CKO mice. (E and F) Quantification of amplitude of EPSCLs and response-type proportion of recorded superficial DH neurons in spinal cord slices in ≥eight-week-old control and CKO mice. Data are presented as mean ± SEM. Unpaired Student’s t-test in B, D and E; chi-square test in C and F. * p<0.05; n.s., not significant.
Figure 4.
Figure 4.. Mrgpra3-Vglut2 CKO mice display deficits in synaptic transmission and itch behaviors at six months and older.
(A-J) Immunostaining of molecular markers with sections from lumbar (L4 and L5) DRG, lumbar spinal cord, and hairy skin of ≥six-month-old control and Mrgpra3-Vglut2 CKO mice. Scale bars: DRG 50 µm, spinal cord 50 µm, skin 10 µm. (K and L) Quantification of number of ChR2+ neurons in DRG sections or percentage of ChR2+ neurons expressing different molecular markers. 6–8 sections/mouse, n=3. (M and N) Quantification of amplitude of EPSCLs and response-type proportions of recorded superficial DH neurons in spinal cord slices of ≥six-month-old control and CKO mice. (O) Quantification of the responses induced by cheek, nape, or hind paw (HP) light stimulation in control and CKO mice. (P) Quantification of scratch bouts in response to the nape of neck injections of CQ or histamine in control and CKO mice. (Q) Quantification of SADBE-induced spontaneous scratch bouts in control and CKO mice. Data are presented as mean ± SEM. Unpaired Student’s t-test in K, L, M, O, P and Q; chi-square test in N. * p<0.05; n.s., not significant. See also Figure S5 and Video 4.
Figure 5.
Figure 5.. NMB depolarizes the membrane potential of NMBR+ spinal DH neurons.
(A) Diagram showing genomic structure of Nmbrcre knock-in mouse line. (B) Co-staining of Tdt and molecular markers with lumbar spinal cord and DRG (L4 and L5) sections from three-week-old Nmbr-Tdt mice. There is no Tdt expression in DRG neurons. Scale bars: 50 µm. (C) Quantification of Tdt+ cell distribution in the spinal cord DH. 6–8 sections/mouse, n=3. (D) RNAscope in situ hybridization of Tdt and Nmbr with lumbar spinal DH sections of three-week-old Nmbr-Tdt mice. Scale bars: 10 µm. (E) Quantification of double-positive cells among Tdt+ cells or Nmbr+ cells in the spinal cord DH superficial layers. 6–8 sections/mouse, n=3. (F) A representative firing pattern trace of Tdt+ cells in response to rectangular current injection in current clamp mode with spinal cord slices of five- to six-week-old Nmbr-Tdt mice. All recorded Tdt+ neurons showed a delayed firing pattern. (G) A representative trace of NMB (2 µM) perfusion induced membrane depolarization and action potential firing in Tdt+ cells using perforated patch clamp recording with pretreatment of ionotropic receptor antagonists. (H and I) Quantification of NMB perfusion-induced membrane depolarization and the percentage of Tdt+ cells responsive to NMB application (n = 13 neurons). Each dot indicates one responsive Tdt+ neuron. See also Figure S6.
Figure 6.
Figure 6.. NMBR+ DH neurons receive monosynaptic inputs from MRGPRA3+ primary afferents and NMB enhances the activity of NMBR+ DH neurons through synergy with glutamate.
(A) Diagram showing the genetic and viral strategies to specifically express ChR2 in MRGPRA3+ afferents and genetically label NMBR+ DH neurons with Tdt. (B-G) Expression of ChR2 and Tdt in a whole mount lumbar DRG (B-D) and spinal cord sections (E-G). Scale bars: 100 µm. (H) Diagram showing targeted recordings of Nmbr-Tdt DH neurons while specifically stimulating MRGPRA3+ primary afferents by blue laser. (I) Representative traces of light induced monosynaptic EPSCLs in response to 0.2 Hz, 20 times stimuli. (J) A representative plot of the action potentials recorded from a Tdt+ neuron in response to sequential perfusions of AMPA (1 µM), and combination of AMPA (1 µM) and NMB (2 µM) under perforated patch clamp configuration. Raw traces are shown recording at a, b, c, d, and e time points. (K) Quantification of the frequency of action potentials during baseline, AMPA-only perfusion, and AMPA and NMB perfusion together. Data are presented as mean ± SEM. Unpaired Student’s t-test in K. * p<0.05.
Figure 7.
Figure 7.. NMB is required in MRGPRA3+ afferents for CQ-induced itch behavior
(A) Illustration showing MRGPRA3+ afferent terminals of Nmbf/f (control) and Mrgpra3Cre; Nmbf/f (Mrgpra3-Nmb CKO) mice. (B-I) Immunostaining of molecular markers with sections from lumbar (L4 and L5) DRG, lumbar spinal cord, and hairy skin of around two-month-old control and CKO mice. Scale bars: DRG 50 µm, spinal cord 50 µm, skin 10 µm. (J and K) Quantification of MRGPRA3-GFP+ neurons per sections and percentage of MRGPRA3-GFP+ neurons expressing different molecular markers. 6–8 sections/mouse, n=3. (L) Quantification of scratch bouts in response to the nape of neck intradermal injections of CQ or histamine or BAM8–22 into two-month-old control and Mrgpra3-Nmb CKO mice. (M) Quantification of scratch bouts in response to cheek intradermal injections of CQ or histamine into two-month-old blank-saporin (control) and NMB-saporin (NMB-sap) mice. (N) Illustration of the proposed model. See also Figure S7. Unpaired Student’s t-test in J, K, L, and M. ****p<0.001, *p<0.05; n.s., not significant.

Similar articles

Cited by

References

    1. Abdus-Saboor I, Fried NT, Lay M, Burdge J, Swanson K, Fischer R, Jones J, Dong P, Cai W, Guo X, Tao YX, Bethea J, Ma M, Dong X, Ding L, and Luo W (2019). Development of a Mouse Pain Scale Using Sub-second Behavioral Mapping and Statistical Modeling. Cell Rep 28, 1623–1634 e1624. - PMC - PubMed
    1. Albisetti GW, Pagani M, Platonova E, Hosli L, Johannssen HC, Fritschy JM, Wildner H, and Zeilhofer HU (2019). Dorsal Horn Gastrin-Releasing Peptide Expressing Neurons Transmit Spinal Itch But Not Pain Signals. J. Neurosci 39, 2238–2250. - PMC - PubMed
    1. Alshahrani S, Fernandez-Conti F, Araujo A, and DiFulvio M (2012). Rapid determination of the thermal nociceptive threshold in diabetic rats. J. Vis. Exp, e3785. - PMC - PubMed
    1. Bautista DM, Wilson SR, and Hoon MA (2014). Why we scratch an itch: the molecules, cells and circuits of itch. Nat. Neurosci 17, 175–182. - PMC - PubMed
    1. Barry DM, Liu X-T, Liu B, Liu X-Y, Gao F, Zeng X, Liu J, Yang Q, Wilhelm S, Yin J, Tao A, and Chen ZF (2020). Exploration of sensory and spinal neurons expressing gastrin-releasing peptide in itch and pain related behaviors. Nat. Commun 11, 1397. - PMC - PubMed

Publication types