Multicenter Study
. 2022 Jan 4;38(1):110190.
doi: 10.1016/j.celrep.2021.110190.

Integrative clinical and molecular characterization of translocation renal cell carcinoma

Affiliations
Multicenter Study

Integrative clinical and molecular characterization of translocation renal cell carcinoma

Ziad Bakouny et al. Cell Rep. .

Abstract

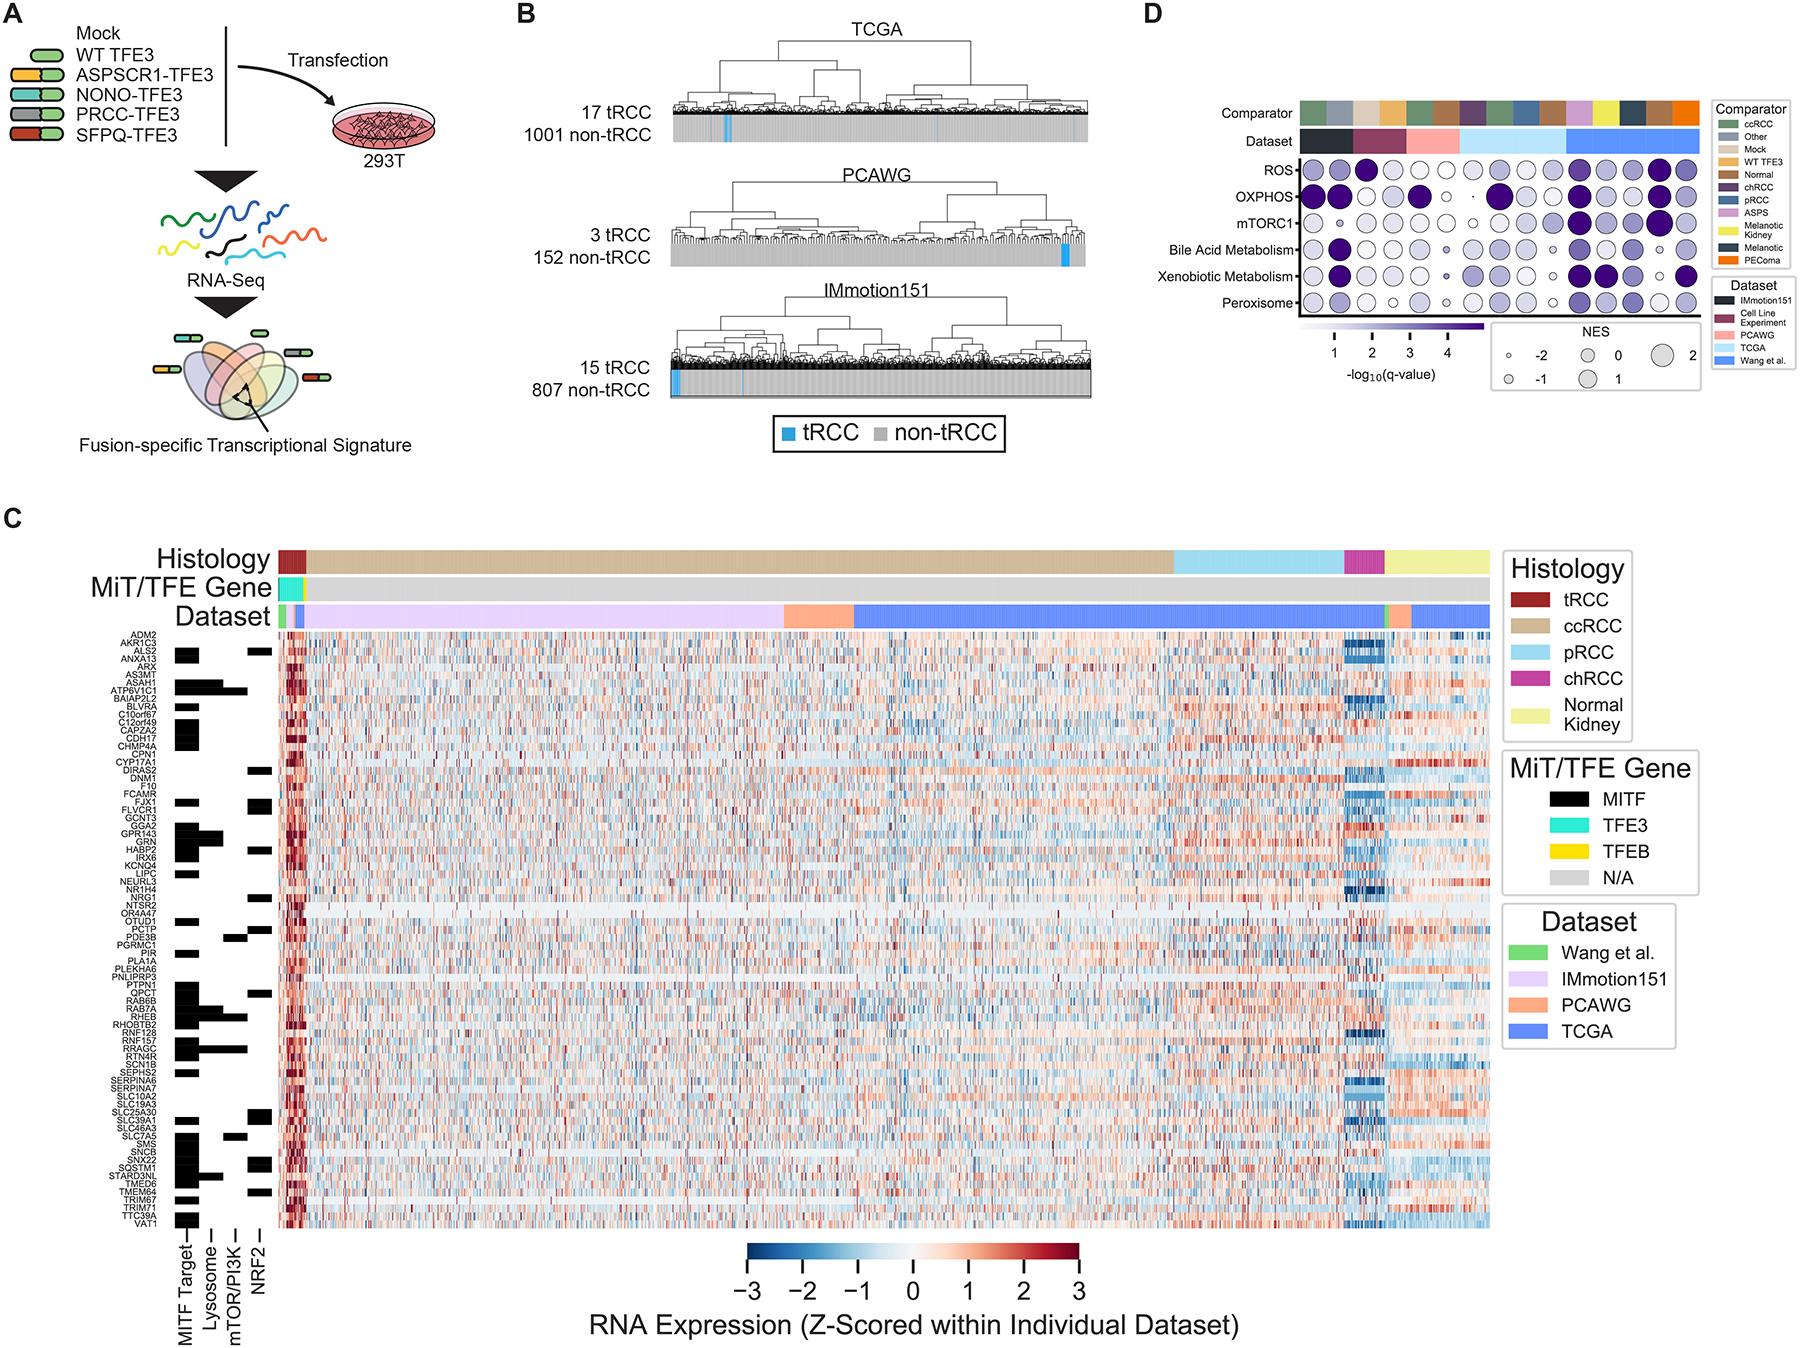
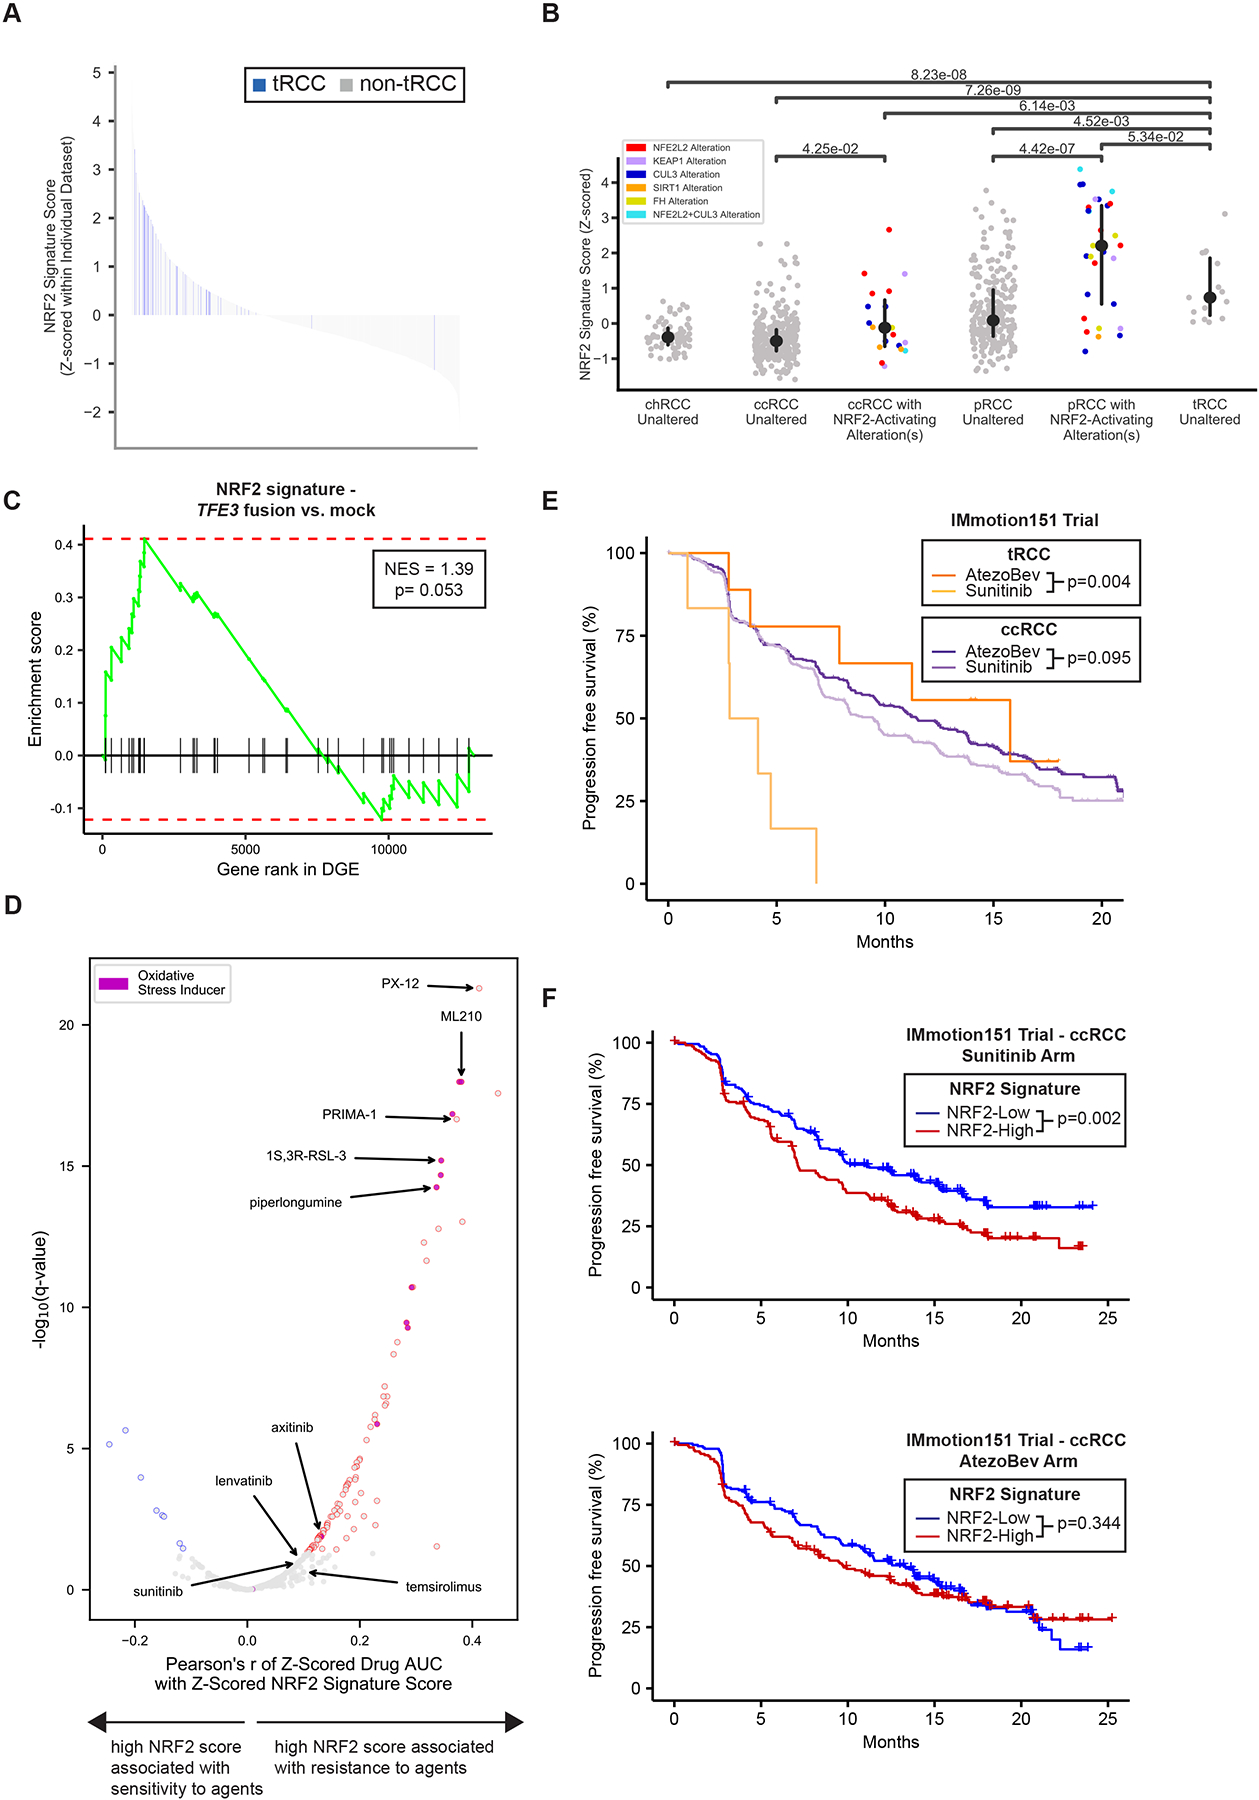
Translocation renal cell carcinoma (tRCC) is a poorly characterized subtype of kidney cancer driven by MiT/TFE gene fusions. Here, we define the landmarks of tRCC through an integrative analysis of 152 patients with tRCC identified across genomic, clinical trial, and retrospective cohorts. Most tRCCs harbor few somatic alterations apart from MiT/TFE fusions and homozygous deletions at chromosome 9p21.3 (19.2% of cases). Transcriptionally, tRCCs display a heightened NRF2-driven antioxidant response that is associated with resistance to targeted therapies. Consistently, we find that outcomes for patients with tRCC treated with vascular endothelial growth factor receptor inhibitors (VEGFR-TKIs) are worse than those treated with immune checkpoint inhibitors (ICI). Using multiparametric immunofluorescence, we find that the tumors are infiltrated with CD8+ T cells, though the T cells harbor an exhaustion immunophenotype distinct from that of clear cell RCC. Our findings comprehensively define the clinical and molecular features of tRCC and may inspire new therapeutic hypotheses.

Keywords: MITF; NRF2; TFE3; TFEB; VEGFR; genomics; immune checkpoint inhibition; immunotherapy; oxidative stress; translocation renal cell carcinoma.


Conflict of interest statement

Declaration of interests Z.B.: research funding from Bristol-Myers Squibb & Genentech/imCORE; honoraria from UpToDate. X.G.: advisory board for Exelixis, Bayer and Guardant Health. D.A.B.: non-financial support from Bristol Myers Squibb, honoraria from LM Education/Exchange Services, advisory board fees from Exelixis and Aveo, and consulting/personal fees from Octane Global, Defined Health, Dedham Group, Adept Field Solutions, Slingshot Insights, Blueprint Partnerships, Charles River Associates, Trinity Group, and Insight Strategy outside of the submitted work. N.I.V.: advisory board to Sanofi/Genzyme, Oncocyte, and Lilly. M.S.H.: consultant, Janssen Pharmaceuticals and UpToDate. R.H.: research funding from Novartis. B.A.M.: consultant for Bayer, Astellas, AstraZeneca, Seattle Genetics, Exelixis, Nektar, Pfizer, Janssen, Genentech, Eisai, Dendreon, Bristol Myers Squibb, Calithera, and EMD Serono; research funding to the institution from Bristol Myers Squibb, Calithera, Exelixis, and Seattle Genetics. A.S.F.: consultant, Olympus America, Inc.; honoraria, Roche, Janssen; advisory board, Vessi Medical. C.J.W.: equity holder of BioNTech, Inc; research funding from Pharmacyclics. D.F.M.: honoraria from BMS, Pfizer, Merck, Alkermes, Inc., EMD Serono, Eli Lilly and Company, Iovance, Eisai, Inc., Werewolf Therapeutics, and Calithera Biosciences; research support from BMS, Merck, Genentech, Pfizer, Exelixis, X4 Pharma, and Alkermes, Inc. D.Y.C.H.: consultancies and research funding from Pfizer, Novartis, BMS, Merck, Eisai, Ipsen, and Exelixis. S.S.: grants from Exelixis, grants from Bristol-Myers Squibb, personal fees from Merck, grants and personal fees from AstraZeneca, personal fees from CRISPR Therapeutics, personal fees from NCI, and personal fees from AACR; a patent for Biogenex with royalties paid. E.M.V.A.: advisory/consulting, Tango Therapeutics, Genome Medical, Invitae, Enara Bio, Janssen, Manifold Bio, Monte Rosa; research support, Novartis, BMS; equity, Tango Therapeutics, Genome Medical, Syapse, Enara Bio, Manifold Bio, Microsoft, Monte Rosa; patents, institutional patents filed on chromatin mutations and immunotherapy response and methods for clinical interpretation. T.K.C.: research (institutional and personal), Alexion, Analysis Group, AstraZeneca, Aveo, Bayer, Bristol Myers-Squibb/ER Squibb and Sons, LLC, Calithera, Cerulean, Corvus, Eisai, Exelixis, F. Hoffmann-La Roche, Foundation Medicine, Inc., Genentech, GlaxoSmithKline, Ipsen, Lilly, Merck, Novartis, Peloton, Pfizer, Prometheus Labs, Roche, Roche Products Limited, Sanofi/Aventis, Takeda, and Tracon; consulting/honoraria or advisory role, Alexion, Analysis Group, AstraZeneca, Aveo, Bayer, Bristol Myers-Squibb/ER Squibb and Sons, LLC, Cerulean, Corvus, Eisai, EMD Serono, Exelixis, Foundation Medicine, Inc., Genentech, GlaxoSmithKline, Heron Therapeutics, Infinity Pharma, Ipsen, Jansen Oncology, IQVIA, Lilly, Merck, NCCN, Novartis, Nuscan, Peloton, Pfizer, Pionyr, Prometheus Labs, Roche, Sanofi/Aventis, Surface Oncology, Tempest, and Up-to-Date; CME-related events (e.g., OncLIve, PVI, MJH Life Sciences); NCI GU Steering Committee; stock ownership, Pionyr and Tempest; patents filed, royalties, or other intellectual properties, related to biomarkers of immune checkpoint blockers and ctDNA; travel, accommodations, expenses, medical writing in relation to consulting, advisory roles, or honoraria; no speaker’s bureau. S.R.V.: consulting, MPM Capital and Vida Ventures; spouse is an employee of and holds equity in Kojin Therapeutics. All other authors report no competing interests.

Figures

Figure 1 |
Figure 1 |. Identification of tRCC cases in multiple clinical and molecular datasets.
A,Top, Kaplan-Meier curves for time-to-treatment failure in metastatic ccRCC, pRCC, chrRCC, or tRCC (Harvard cohort). Bottom, Kaplan-Meier curves for progression-free interval for localized ccRCC, pRCC, chrRCC, or tRCC (TCGA cohort). P-values were calculated by pairwise log-rank test. B, Representative H&E micrographs (x10) of cases originally included in the TCGA ccRCC or pRCC sequencing cohorts. The right case in each pair was subsequently found to have a TFE3 gene fusion on RNA-Seq. Scale bar: 100 μm. C, Aggregation of tRCC cases from across 9 independent NGS datasets. The data type(s) analyzed are indicated for each dataset. tRCC cases were identified based on the presence of a fusion involving an MiT/TFE family member (see STAR Methods). The number and proportion of tRCC samples as well as number of total RCC samples is indicated for each dataset.
Figure 2 |
Figure 2 |. Landscape of genomic alterations in tRCC.
CoMut plot of mutational and copy number alterations in tRCC across all datasets. Genes listed are those previously reported as significantly mutated in ccRCC, pRCC, and chrRCC (Ricketts et al., 2018a) (indicated in the left track). Greyed out squares indicate genes were not assessed in the bait set of the version of the panel used for that sample (see STAR Methods). Gray annotations for sample type and MiT/TFE indicate missing values.
Figure 3 |
Figure 3 |. Structure of MiT/TFE fusions in tRCC.
A, Number and percentage of tRCC cases displaying gene fusions involving TFE3, TFEB, or MITF across all datasets analyzed. B, Genomic location of MiT/TFE fusion partners. Stroke thickness is proportional to the number of times a given gene was observed to be an MiT/TFE fusion partner across all datasets analyzed. C, Gene ontology terms (GO Biological Process) enriched amongst MiT/TFE fusion partners. P-values computed using Fisher’s exact test using Enrichr (Xie et al., 2021). D, Breakpoints observed within TFE3, TFEB, or MITF across all samples analyzed. Solid portion represents the portion of the MiT/TFE gene retained within the oncogenic fusion product. Fusion partner genes observed to join at a given breakpoint are listed. Functional domains within each MiT/TFE gene are indicated (legend in Table S2). E, Breakpoints observed within MiT/TFE partner genes. Solid portion represents the portion of each partner gene retained within the oncogenic fusion product. Genes are grouped by whether they were observed to fuse with TFE3 (top), TFEB (middle), or MITF (bottom). Functional domains within each MiT/TFE partner gene are indicated (legend in Table S2).
Figure 4 |
Figure 4 |. Distinctive transcriptional features of tRCC.
A, Schematic of in vitro experiment used to derive TFE3-fusion-specific transcriptional signature. B, Transcriptome sequencing data from three independent datasets (TCGA, PCAWG, IMmotion151) were subjected to unsupervised hierarchical clustering using the fusion-specific signature derived in (A). Blue bars indicate MiT/TFE-fusion-positive cases within each dataset. Gray bars indicate other RCC histologic subtypes or normal kidney. C, Heatmap of genes overexpressed in tRCC as compared with other RCC subtypes or normal kidney, across all datasets (see Figure S4). Membership of genes in key pathways related to tRCC pathogenesis is indicated in the track at left. D, Gene set enrichment analysis showing top enriched Hallmark pathways in tRCC samples versus comparators across all datasets analyzed. Dataset and pairwise comparison across which the GSEA was performed is indicated in the track at the top of each column. Dot size is proportional to normalized enrichment score (NES) in tRCC versus comparator; dot color reflects -log10(q-value) for the enrichment. The q-value was calculated using the false-discovery rate correction of the phenotype permutation-based two-sided test p-value used with GSEA.
Figure 5 |
Figure 5 |. tRCC displays activated NRF2 pathway signaling and a relative resistance to targeted therapies.
A, Waterfall plot showing NRF2 signature score for all RCC samples across all datasets analyzed. tRCC samples are depicted in blue (n=46); other samples (ccRCC, pRCC, chRCC, normal kidney, or other tumors) are shown in gray (n=1999). B, NRF2 signature score for TCGA RCC samples of the indicated histologies. For each histology, samples with somatic alterations in the NRF2 pathway are shown separately. No chRCC or tRCC samples displayed somatic alterations in the NRF2 pathway P-values are reported and are derived using a Wilcoxon rank-sum test. C, Gene set enrichment analysis showing enrichment of NRF2 gene signature in 293T cells expressing TFE3 fusions (4 conditions with 3 replicates each) versus mock (untransfected, 3 replicates) control condition. D, Volcano plot showing correlation of NRF2 signature score with drug sensitivity in the Broad Institute Cancer Therapeutics Response Portal dataset (Rees et al., 2016). A high NRF2 signature score is significantly associated with resistance to the agents shown in red. Agents annotated to act through the induction of oxidative stress or ferroptosis are colored in purple. Selected targeted agents used in the treatment of kidney cancer are labeled. The q-values represent Benjamini-Hochberg corrected p-values which were generated as reported in STAR Methods. E, Progression-free survival curves for patients with tRCC (dark and light orange) or ccRCC (dark and light purple) treated with either atezolizumab and bevacizumab (AtezoBev) or sunitinib in the randomized Phase III IMmotion151 trial. P-values were calculated by log-rank test. F, Progression-free survival curves for patients with ccRCC with high (red) or low (blue) NRF2 signature score treated with either sunitinib (top) or atezolizumab + bevacizumab (AtezoBev, bottom) on the IMmotion151 trial. P-values were calculated by log-rank test. For E-F, NRF2 signature score was dichotomized at the median in each arm.
Figure 6 |
Figure 6 |. Immunogenomic features of tRCC associated with responses to immune checkpoint inhibition.
A, Percentage of patients with tRCC showing clinical benefit (CB), intermediate clinical benefit (ICB), or no clinical benefit (NCB) to either AtezoBev or sunitinib on the IMmotion151 trial. P-values were calculated by pairwise Fisher’s exact test. B, Swimmer plot showing response types and response times to immune checkpoint inhibitor-based regimens in patients with tRCC in the combined IMDC and Harvard retrospective cohort. Line (L) in which ICI was received as well as specific ICI regimen is indicated to the right of each patient. C, Sample purity in tRCC, ccRCC, chRCC, and pRCC in the TCGA cohort. P-values were calculated by pairwise Wilcoxon’s rank-sum test. D, CD8+ T cell infiltration imputed from gene expression (CIBERSORTx) in tRCC, ccRCC, chRCC, and pRCC in the TCGA cohort. P-values were calculated by pairwise Wilcoxon’s rank-sum test. E, Multiparametric immunofluorescence (x80) for CD8, TIM3, LAG3, and PD1 in representative tRCC cases (top two rows) and ccRCC cases (bottom two rows). Red arrows indicate CD8+PD1+LAG3+TIM3 tumor-infiltrating T cells in tRCC cases. Yellow arrows indicate CD8+PD1+LAG3TIM3+ tumor-infiltrating T cells in ccRCC cases. F, Quantification of CD8+ T-cell density (top), percentage of CD8+PD1+TIM3LAG3+ T cells (middle), and percentage of CD8+PD1+TIM3+LAG3 T cells (bottom) in tRCC (n= 11), ccRCC (n= 11), and adjacent normal tissue (from ccRCC cases, n= 10). The immunofluorescence results for the ccRCC and normal (ccRCC adjacent) control samples were reported in a prior study (Braun et al., 2021b). P-values were calculated by pairwise Wilcoxon’s rank-sum test. Scale bar: 25 μm.

References

    1. 1000 Genomes Project Consortium, Auton A, Brooks LD, Durbin RM, Garrison EP, Kang HM, Korbel JO, Marchini JL, McCarthy S, McVean GA, et al. (2015). A global reference for human genetic variation. Nature 526, 68–74. - PMC - PubMed
    1. Adam J, Hatipoglu E, O’Flaherty L, Ternette N, Sahgal N, Lockstone H, Baban D, Nye E, Stamp GW, Wolhuter K, et al. (2011). Renal Cyst Formation in Fh1-Deficient Mice Is Independent of the Hif/Phd Pathway: Roles for Fumarate in KEAP1 Succination and Nrf2 Signaling. Cancer Cell 20, 524–537. - PMC - PubMed
    1. Álvarez-Fernández M, and Malumbres M (2020). Mechanisms of Sensitivity and Resistance to CDK4/6 Inhibition. Cancer Cell 37, 514–529. - PubMed
    1. Ambalavanan M, and Geller JI (2019). Treatment of advanced pediatric renal cell carcinoma. Pediatr Blood Cancer 66, e27766. - PubMed
    1. Argani P, Olgac S, Tickoo SK, Goldfischer M, Moch H, Chan DY, Eble JN, Bonsib SM, Jimeno M, Lloreta J, et al. (2007). Xp11 Translocation Renal Cell Carcinoma in Adults: Expanded Clinical, Pathologic, and Genetic Spectrum. The American Journal of Surgical Pathology 31, 1149–1160. - PubMed

Publication types

MeSH terms

Substances