. 2022 Jan:81:102578.
doi: 10.1016/j.jhealeco.2021.102578. Epub 2021 Dec 20.

Conditional cash lotteries increase COVID-19 vaccination rates

Affiliations

Conditional cash lotteries increase COVID-19 vaccination rates

Andrew Barber et al. J Health Econ. 2022 Jan.

Abstract

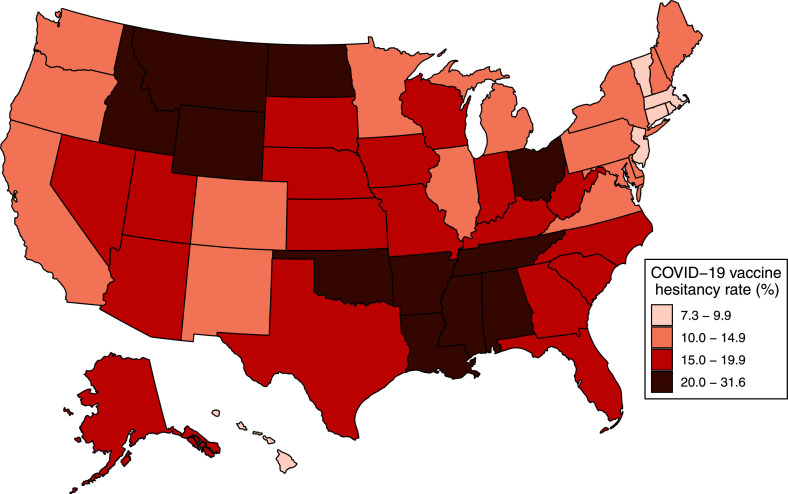
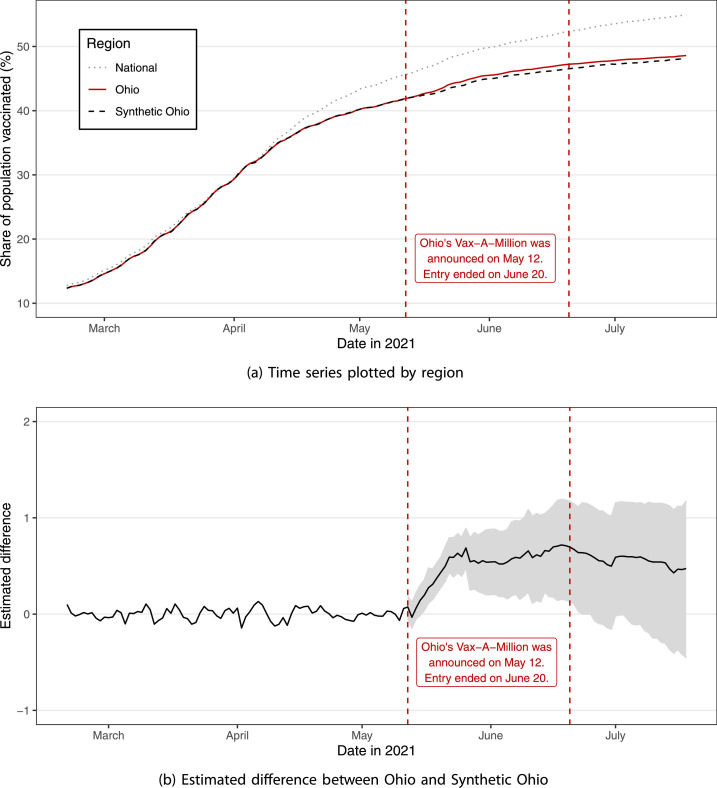
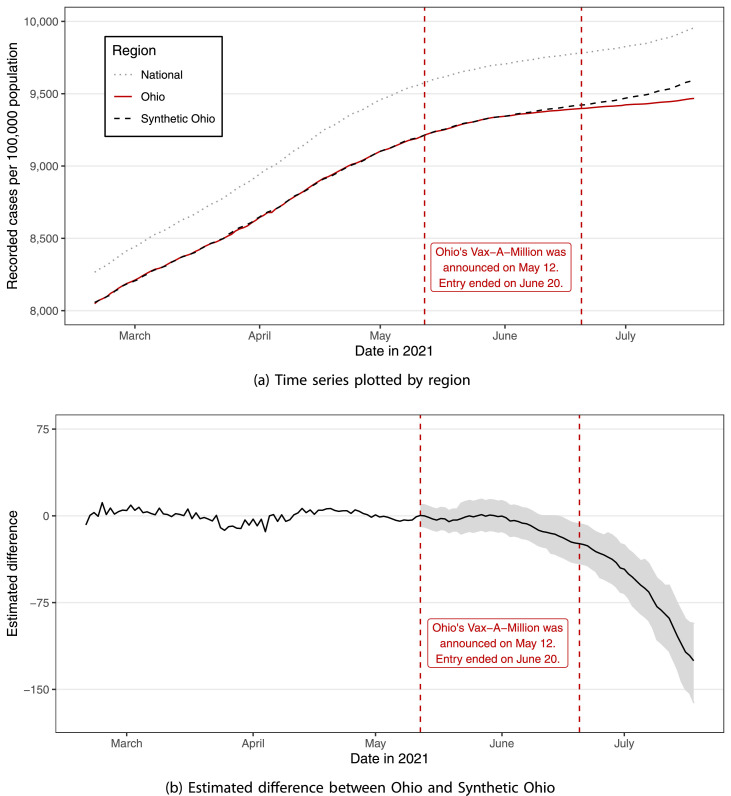
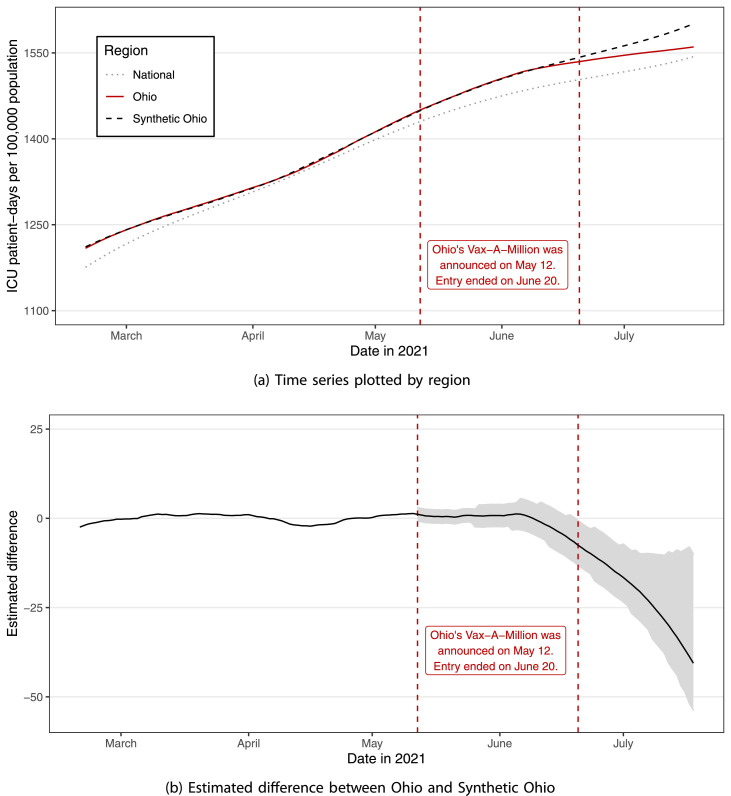
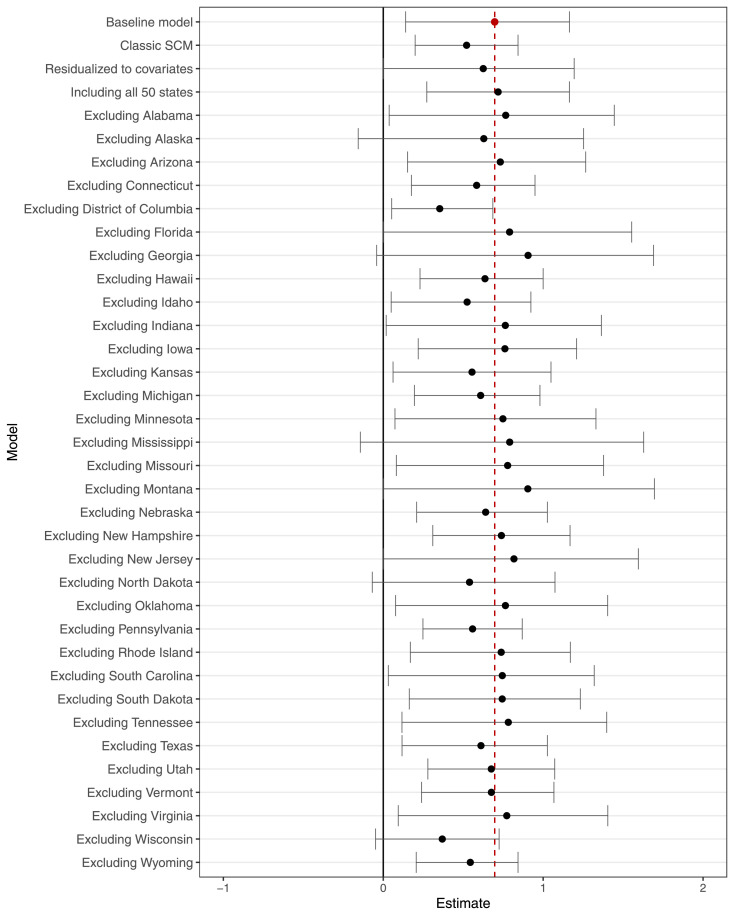
Conditional cash lotteries (CCLs) provide people with opportunities to win monetary prizes only if they make specific behavioral changes. We conduct a case study of Ohio's Vax-A-Million initiative, the first CCL targeting COVID-19 vaccinations. Forming a synthetic control from other states, we find that Ohios incentive scheme increases the vaccinated share of state population by 1.5 percent (0.7 pp), costing sixty-eight dollars per person persuaded to vaccinate. We show this causes significant reductions in COVID-19, preventing at least one infection for every six vaccinations that the lottery had successfully encouraged. These findings are promising for similar CCL public health initiatives.

Keywords: Behavioral economics; Financial incentives; Health policy.


Conflict of interest statement

Declaration of Competing Interest The authors declare that they have no known competing financial interests or personal relationships that could have appeared to influence the work reported in this paper.

Figures

Fig. 1
Fig. 1
Surveyed COVID-19 vaccination hesitancy by state. Notes: Data plotted in this map use an average of the Census Bureau’s Household Pulse Survey responses during Weeks 25–29 (February 17 to May 10, 2021). Vaccination hesitancy includes responses of “definitely not” and “probably not” as survey respondents’ stated willingness to be vaccinated for COVID-19.
Fig. 2
Fig. 2
Share of population with any COVID-19 vaccination over time. Notes: Panel (a) of Fig. 2 shows time series graphs for the share of population that had received at least a first dose of any COVID-19 vaccination by region and date. Panel (b) shows the estimated difference between Ohio and the synthetic control. The grey shading indicates 95 percent confidence intervals for each post-treatment date, calculated using conformal inference.
Fig. 3
Fig. 3
Cumulative total COVID-19 cases recorded per 100,000 population over time. Notes: Panel (a) of Fig. 3 shows time series graphs for the cumulative total number of COVID-19 cases (positive COVID-19 tests) recorded per 100,000 population by region and date. Panel (b) shows the estimated difference between Ohio and the synthetic control. The grey shading indicates 95 percent confidence intervals for each post-treatment date, calculated using conformal inference.
Fig. 4
Fig. 4
Cumulative total COVID-19 ICU patient-days per 100,000 population over time. Notes: Panel (a) of Fig. 4 shows time series graphs for the cumulative total COVID-19 hospital ICU patient-days per 100,000 population by region and date. Panel (b) shows the estimated difference between Ohio and the synthetic control. The grey shading indicates 95 percent confidence intervals for each post-treatment date, calculated using conformal inference.
Fig. 5
Fig. 5
Robustness checks of the synthetic control estimates for the share of population with any COVID-19 vaccination by the end date, using different samples and specifications. Notes: Fig. 5 shows estimated differences between Ohio and the synthetic control for the share of population that had received at least a first dose of any COVID-19 vaccination by June 20, 2021. Each row depicts results from a separate model using the data sample and/or specification denoted. The grey error bars indicate the respective 95 percent confidence intervals, which are calculated using conformal inference.

References

    1. Abadie A. Using synthetic controls: feasibility, data requirements, and methodological aspects. J. Econ. Lit. 2021;59(2):391–425.
    1. Abadie A., Diamond A., Hainmueller J. Synthetic control methods for comparative case studies: estimating the effect of california’s tobacco control program. J. Am. Stat. Assoc. 2010;105(490):493–505.
    1. Abadie A., Diamond A., Hainmueller J. Comparative politics and the synthetic control method. Am. J. Polit. Sci. 2015;59(2):495–510.
    1. Abadie A., Gardeazabal J. The economic costs of conflict: a case study of the Basque country. Am. Econ. Rev. 2003;93(1):113–132.
    1. Abrevaya J., Mulligan K. Effectiveness of state-level vaccination mandates: evidence from the varicella vaccine. J. Health Econ. 2011;30(5):966–976. - PubMed

Substances