. 2022 Mar 9;42(10):2065-2079.
doi: 10.1523/JNEUROSCI.0923-20.2021. Epub 2022 Jan 5.

Hemin-Induced Death Models Hemorrhagic Stroke and Is a Variant of Classical Neuronal Ferroptosis

Affiliations

Hemin-Induced Death Models Hemorrhagic Stroke and Is a Variant of Classical Neuronal Ferroptosis

Marietta Zille et al. J Neurosci. .

Abstract

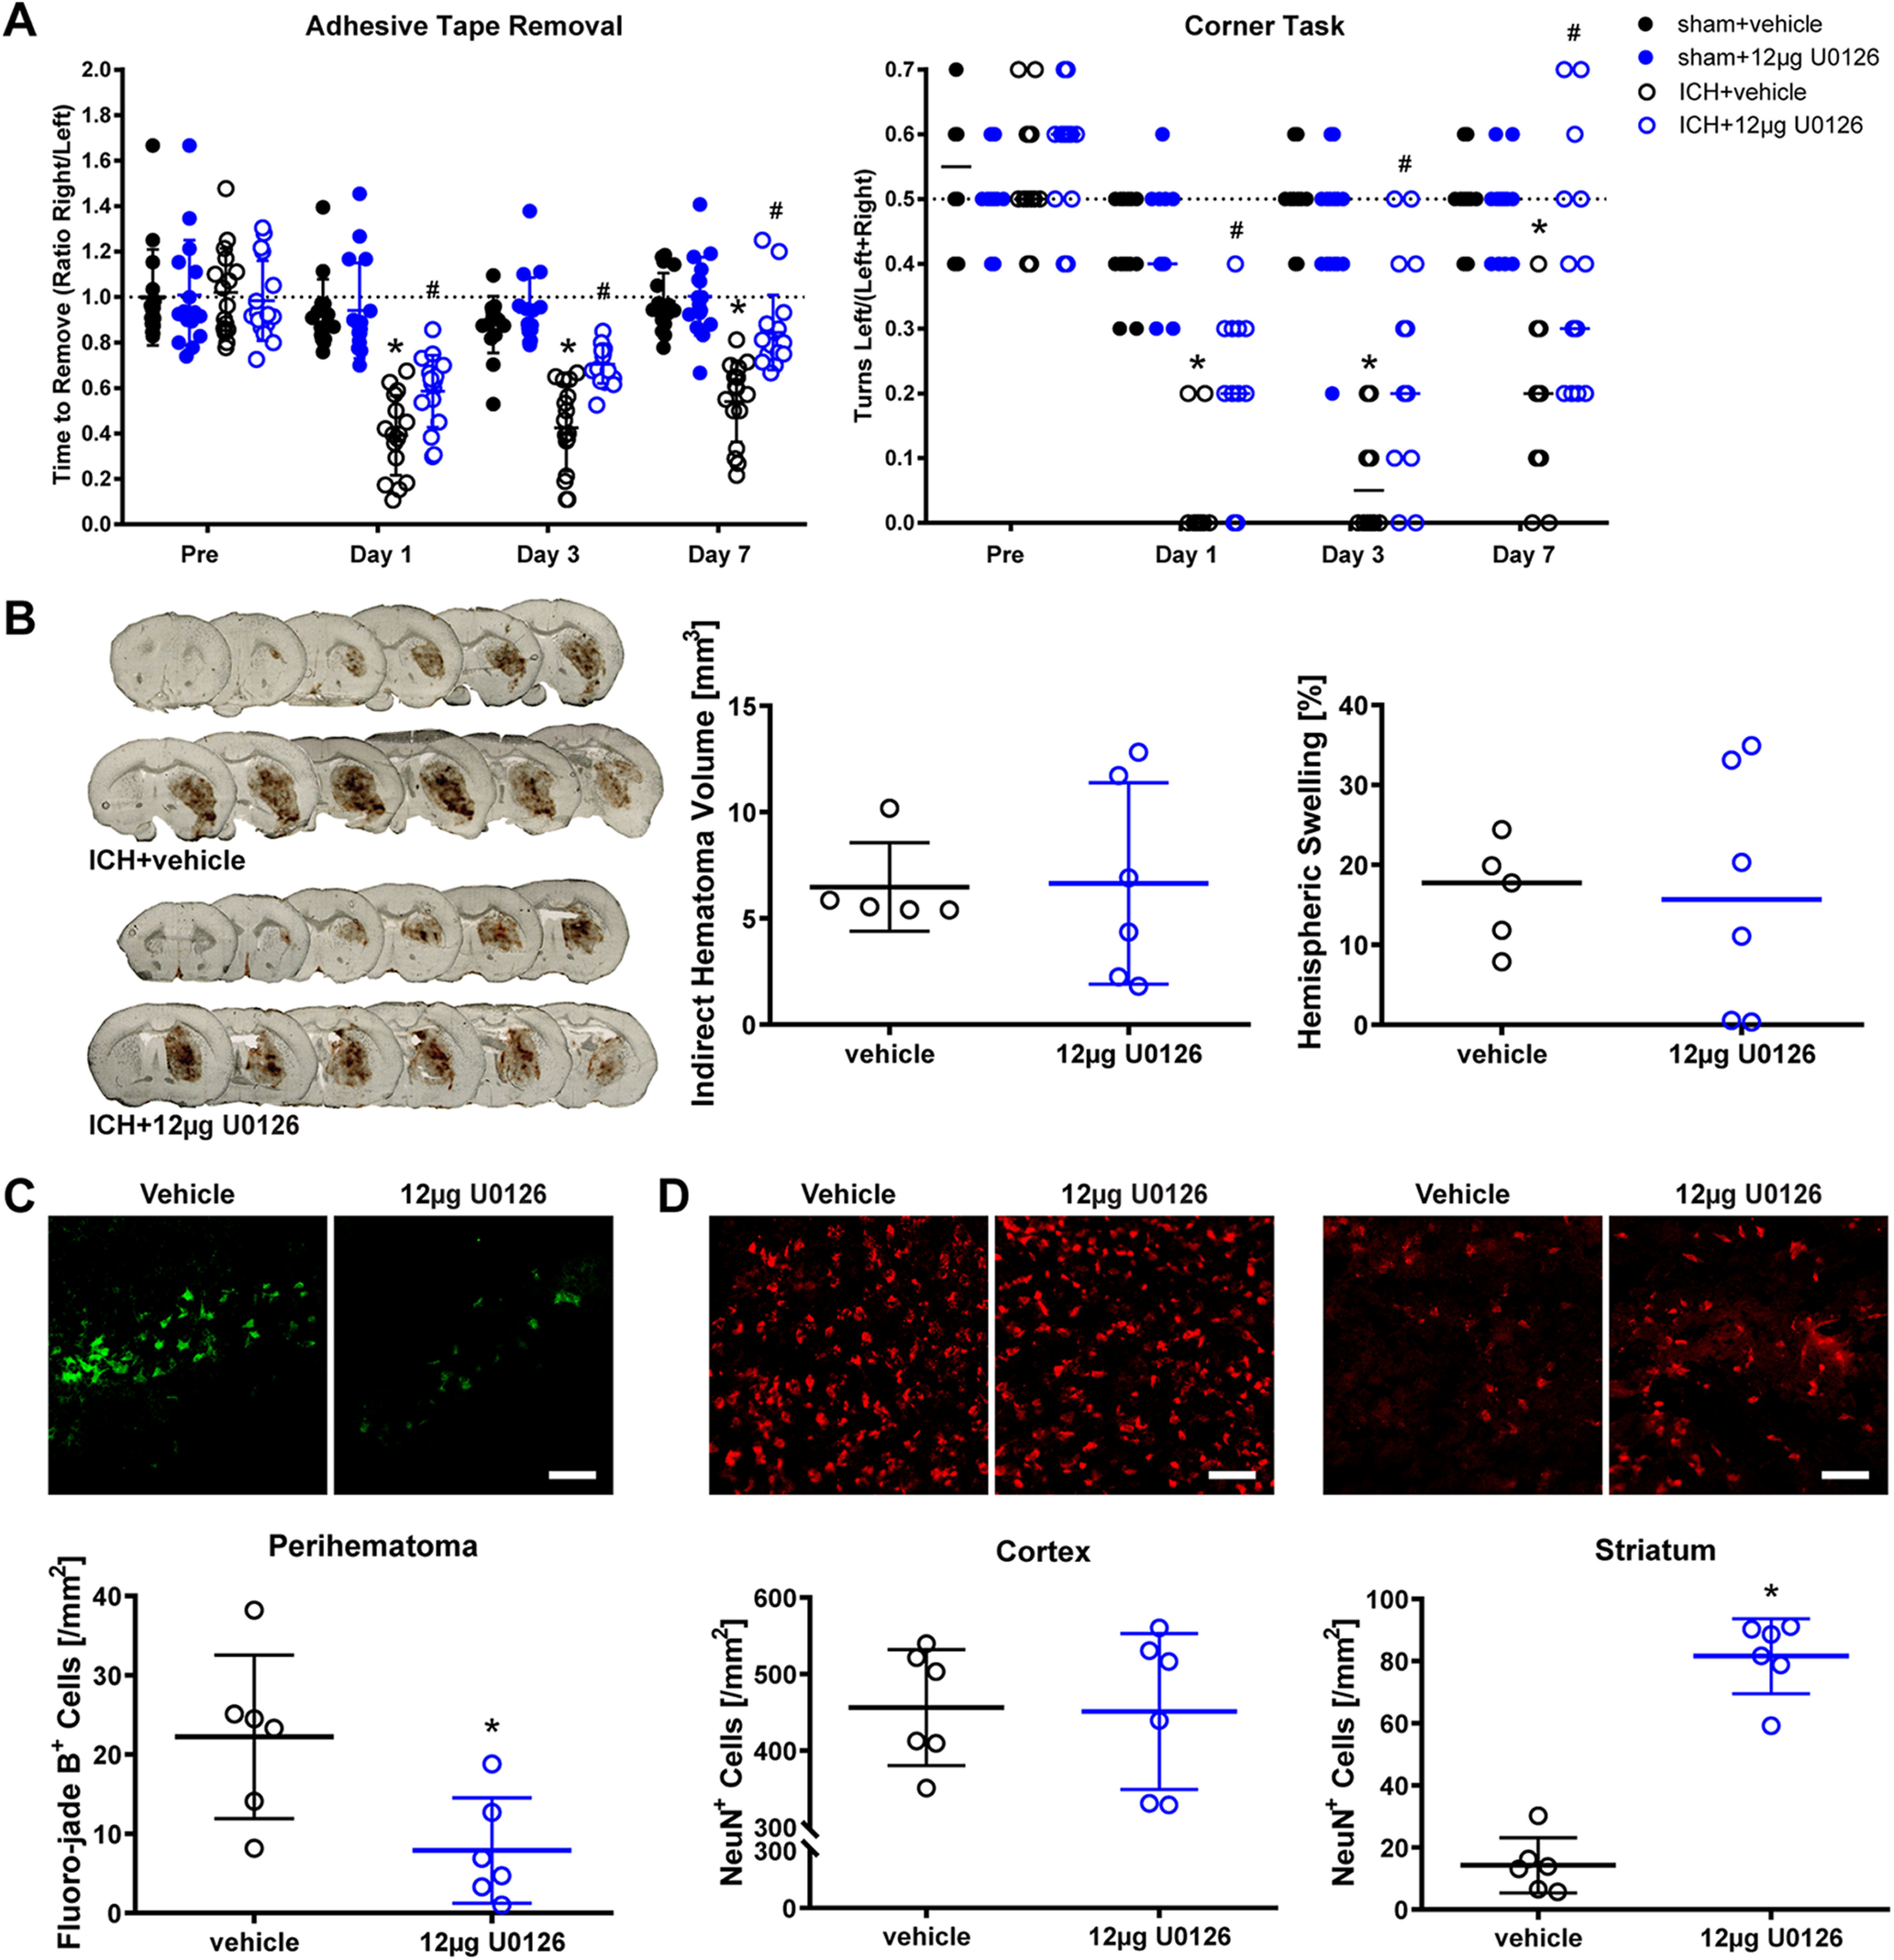
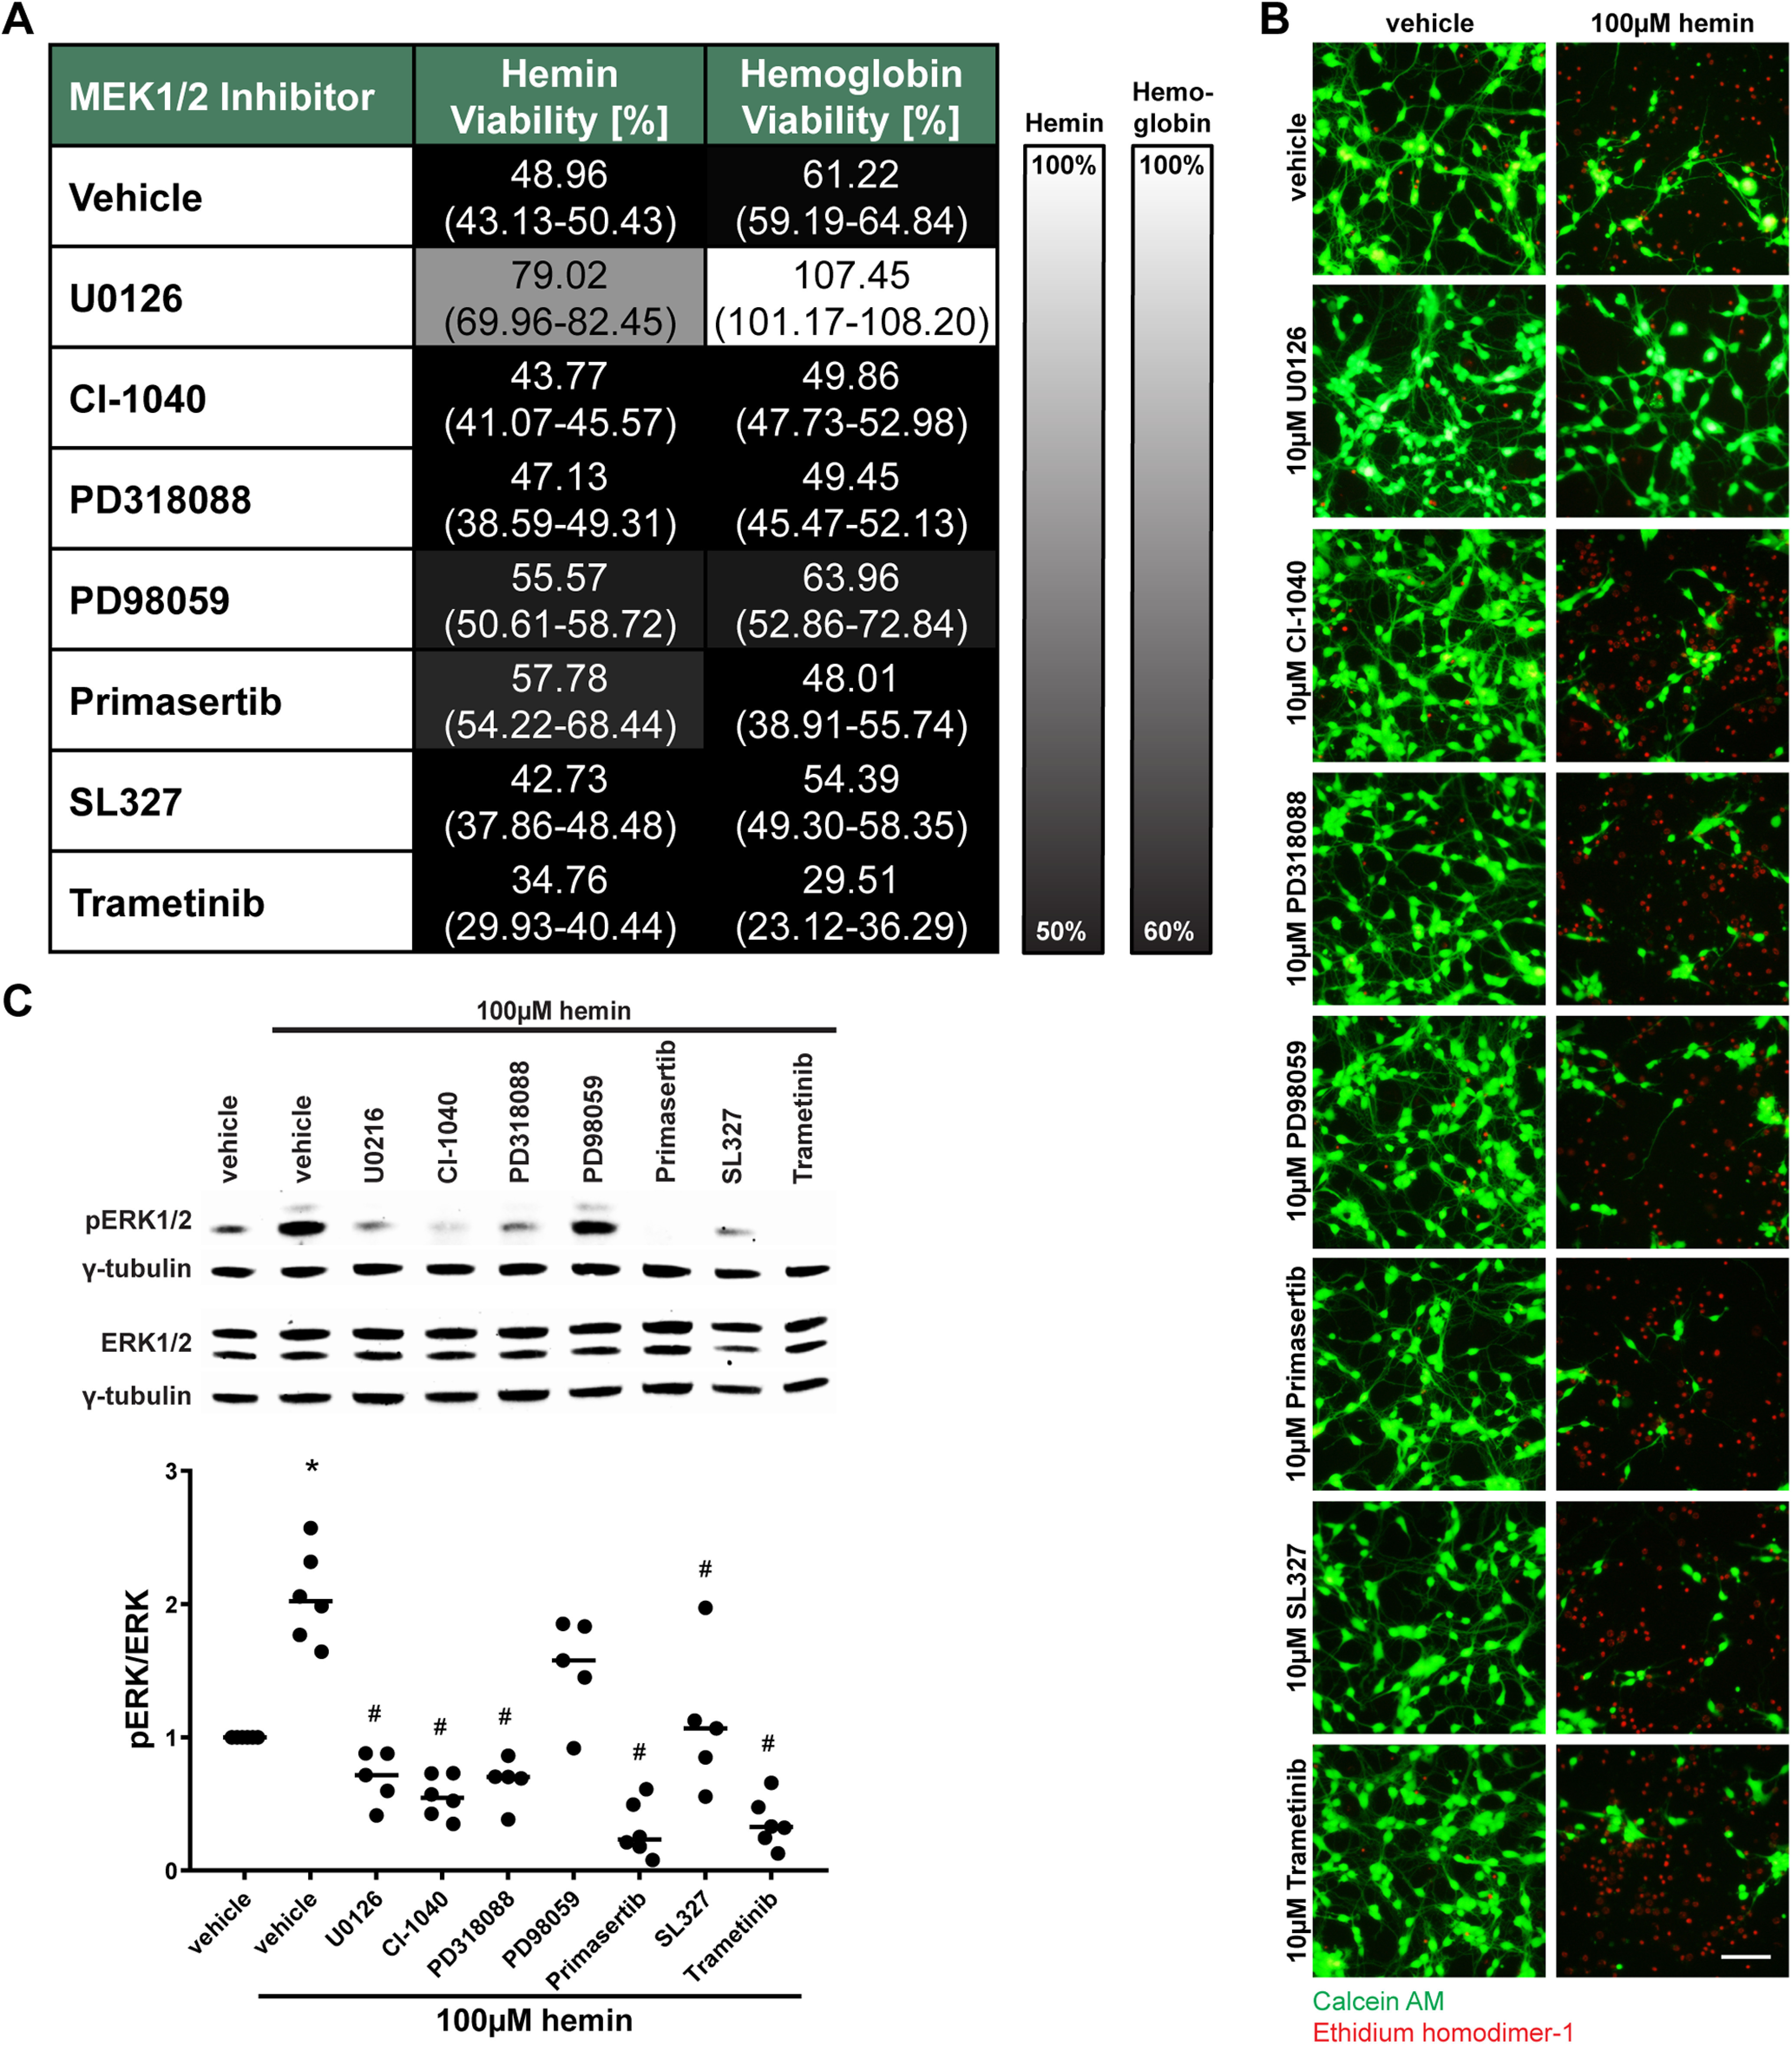
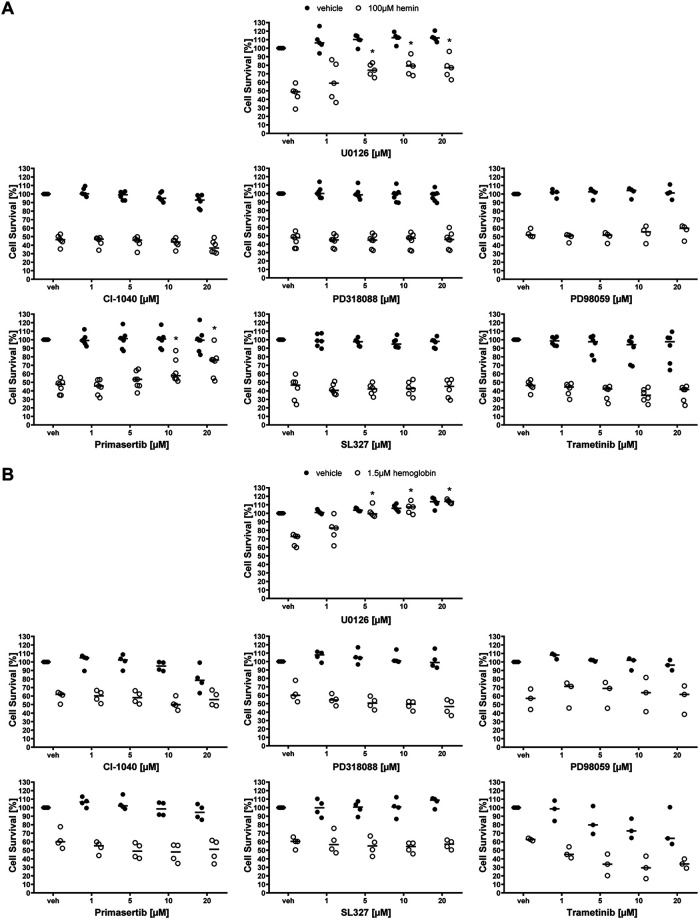
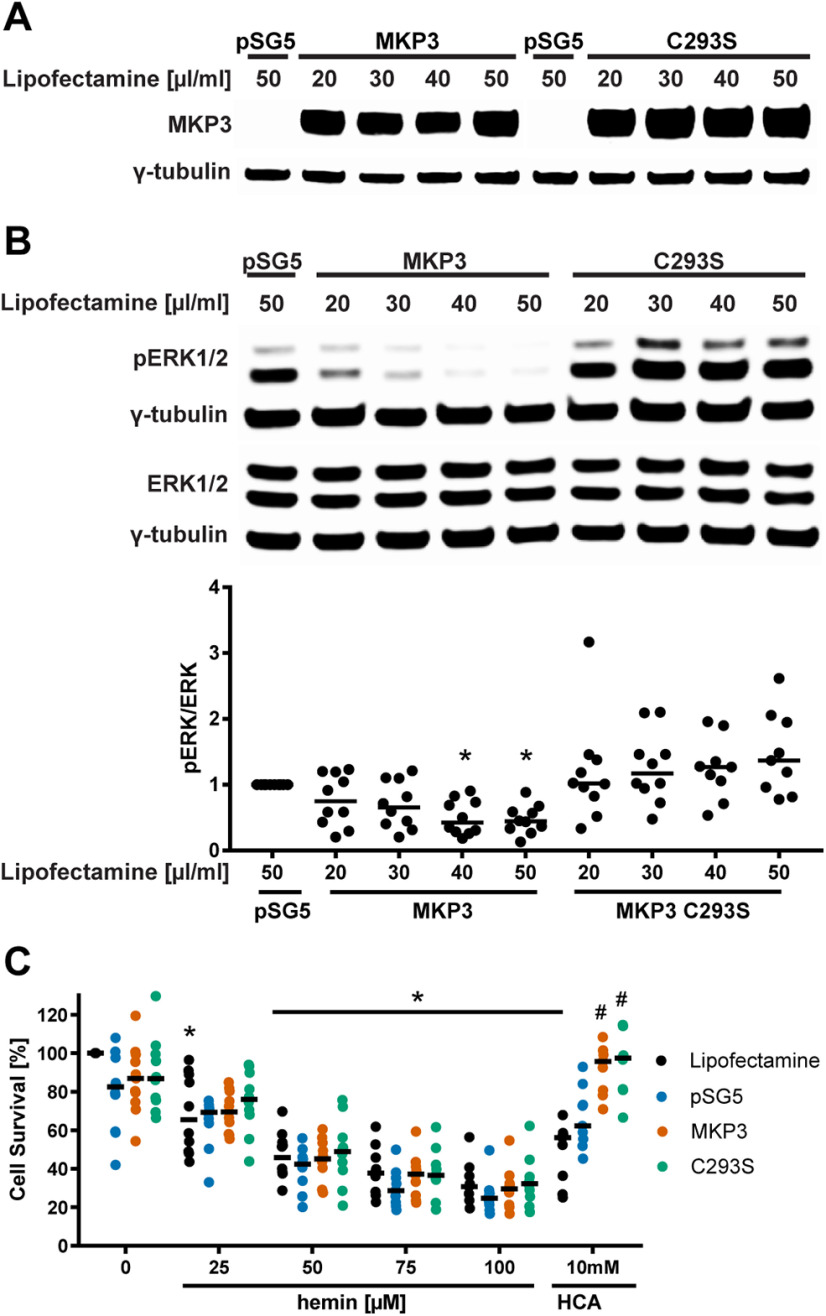
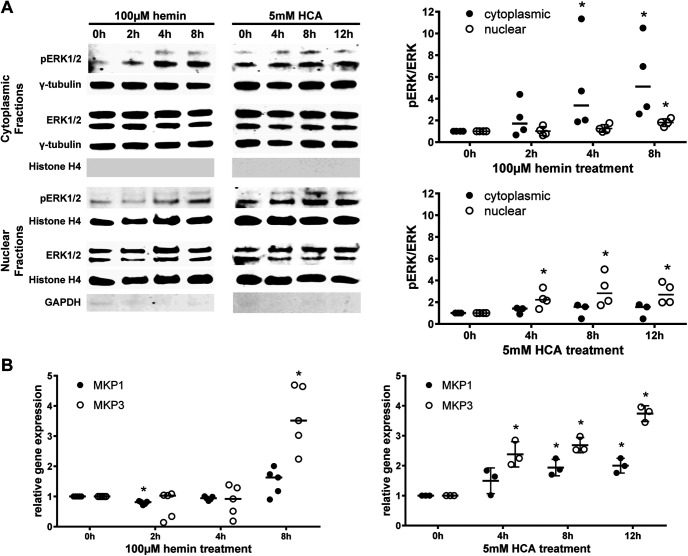
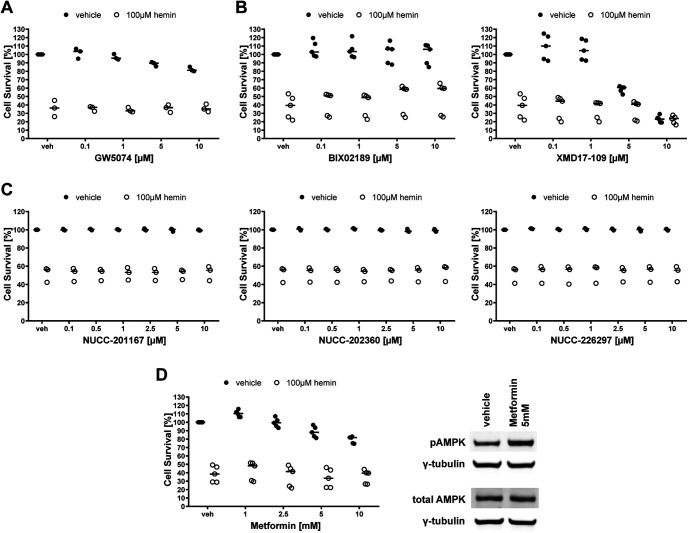
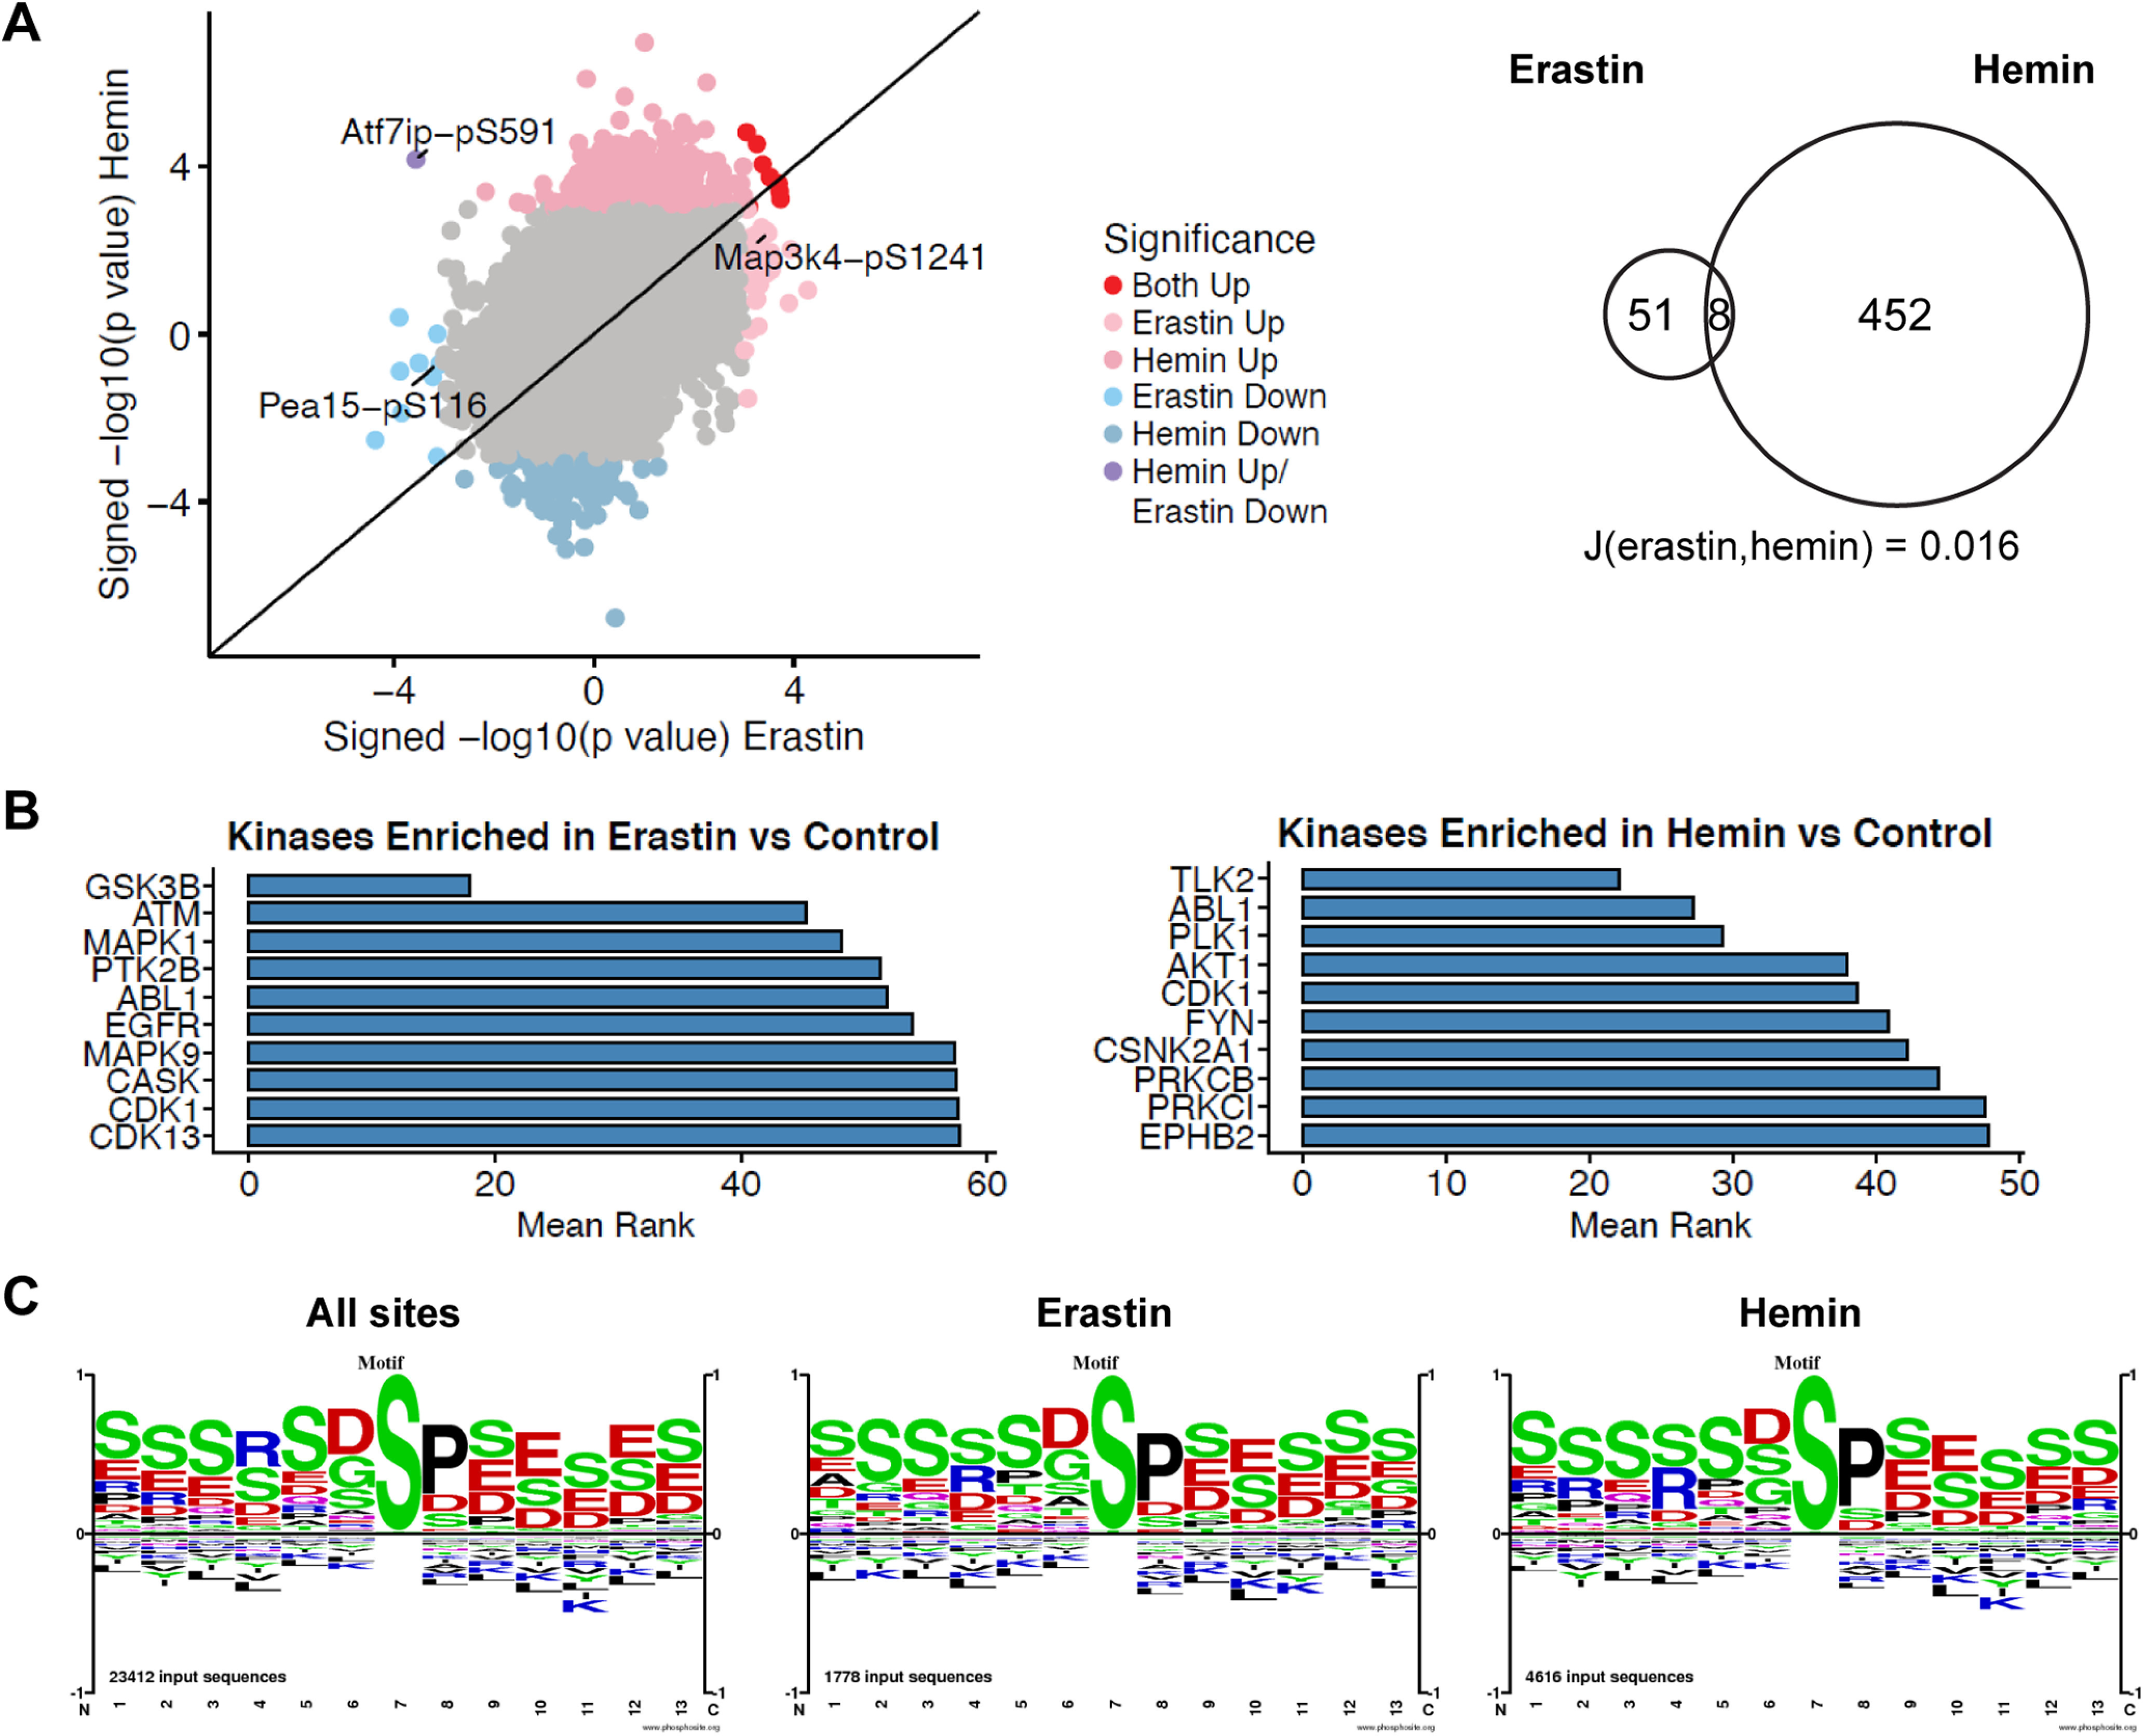
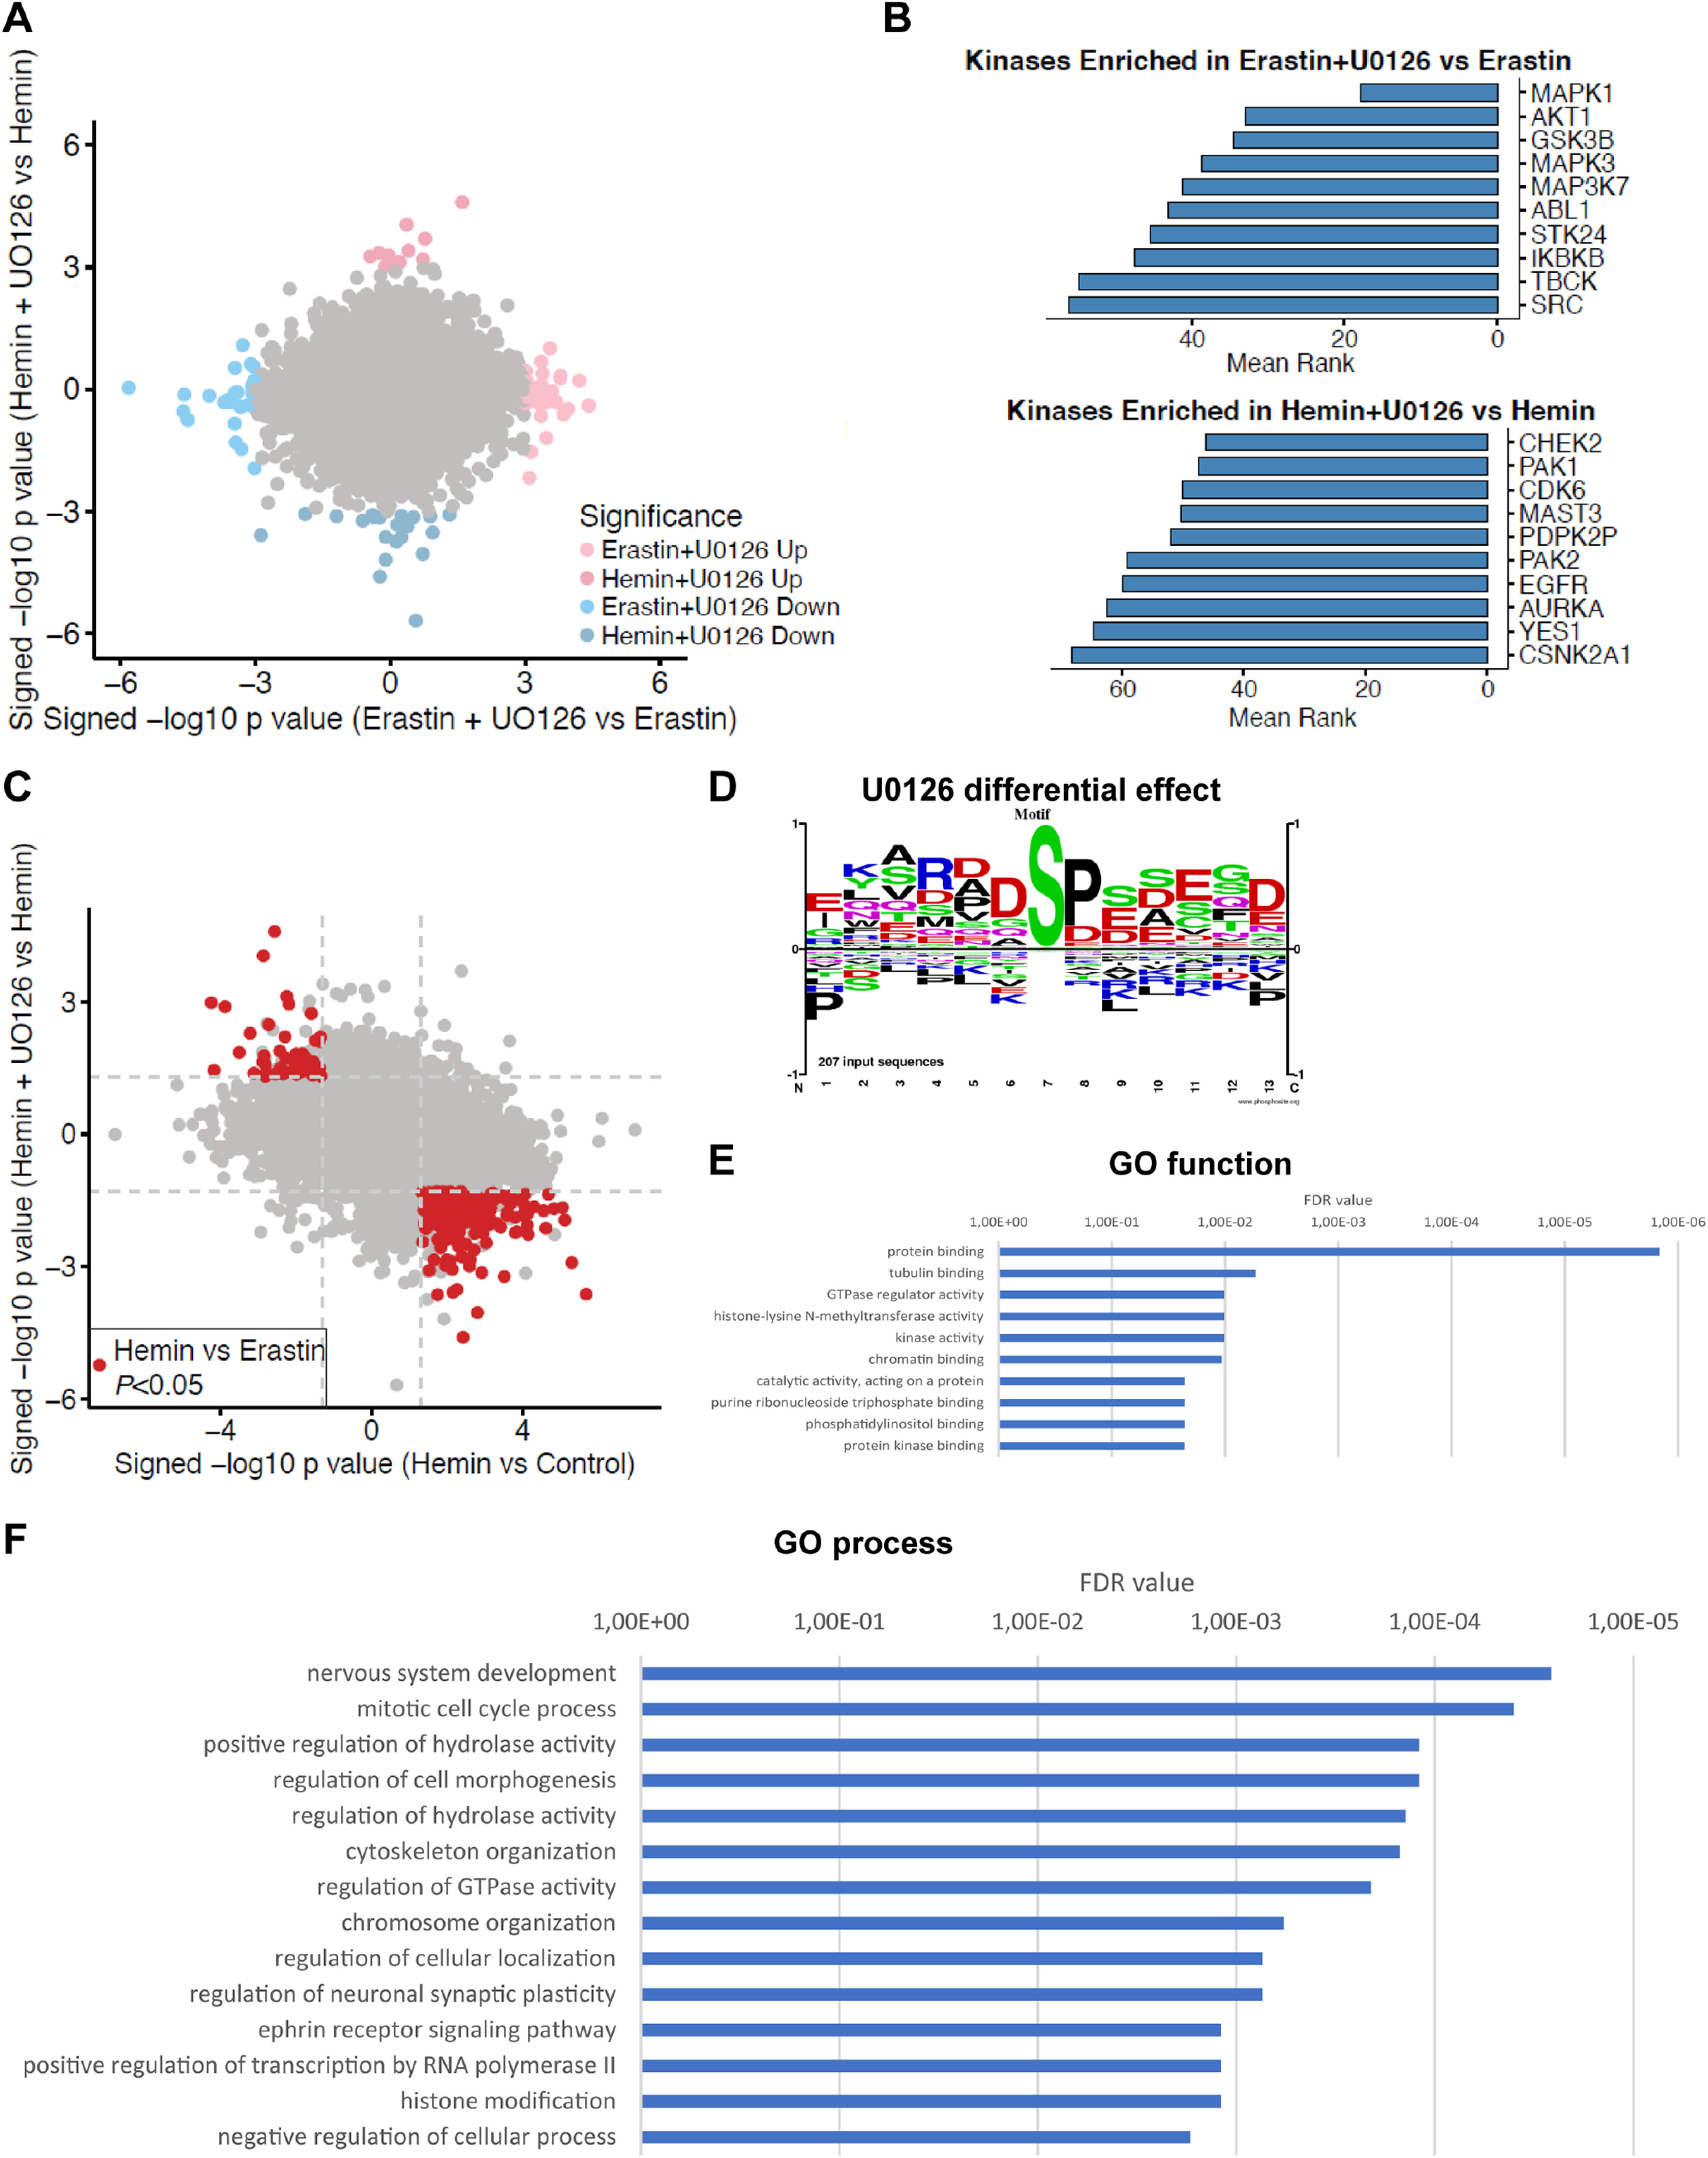
Ferroptosis is a caspase-independent, iron-dependent form of regulated necrosis extant in traumatic brain injury, Huntington disease, and hemorrhagic stroke. It can be activated by cystine deprivation leading to glutathione depletion, the insufficiency of the antioxidant glutathione peroxidase-4, and the hemolysis products hemoglobin and hemin. A cardinal feature of ferroptosis is extracellular signal-regulated kinase (ERK)1/2 activation culminating in its translocation to the nucleus. We have previously confirmed that the mitogen-activated protein (MAP) kinase kinase (MEK) inhibitor U0126 inhibits persistent ERK1/2 phosphorylation and ferroptosis. Here, we show that hemin exposure, a model of secondary injury in brain hemorrhage and ferroptosis, activated ERK1/2 in mouse neurons. Accordingly, MEK inhibitor U0126 protected against hemin-induced ferroptosis. Unexpectedly, U0126 prevented hemin-induced ferroptosis independent of its ability to inhibit ERK1/2 signaling. In contrast to classical ferroptosis in neurons or cancer cells, chemically diverse inhibitors of MEK did not block hemin-induced ferroptosis, nor did the forced expression of the ERK-selective MAP kinase phosphatase (MKP)3. We conclude that hemin or hemoglobin-induced ferroptosis, unlike glutathione depletion, is ERK1/2-independent. Together with recent studies, our findings suggest the existence of a novel subtype of neuronal ferroptosis relevant to bleeding in the brain that is 5-lipoxygenase-dependent, ERK-independent, and transcription-independent. Remarkably, our unbiased phosphoproteome analysis revealed dramatic differences in phosphorylation induced by two ferroptosis subtypes. As U0126 also reduced cell death and improved functional recovery after hemorrhagic stroke in male mice, our analysis also provides a template on which to build a search for U0126's effects in a variant of neuronal ferroptosis.SIGNIFICANCE STATEMENT Ferroptosis is an iron-dependent mechanism of regulated necrosis that has been linked to hemorrhagic stroke. Common features of ferroptotic death induced by diverse stimuli are the depletion of the antioxidant glutathione, production of lipoxygenase-dependent reactive lipids, sensitivity to iron chelation, and persistent activation of extracellular signal-regulated kinase (ERK) signaling. Unlike classical ferroptosis induced in neurons or cancer cells, here we show that ferroptosis induced by hemin is ERK-independent. Paradoxically, the canonical MAP kinase kinase (MEK) inhibitor U0126 blocks brain hemorrhage-induced death. Altogether, these data suggest that a variant of ferroptosis is unleashed in hemorrhagic stroke. We present the first, unbiased phosphoproteomic analysis of ferroptosis as a template on which to understand distinct paths to cell death that meet the definition of ferroptosis.

Keywords: MAP signaling; brain hemorrhage; cell death; ferroptosis; phosphoproteomics; stroke.


Figures

Figure 1.
Figure 1.
Intracerebroventricular administration of the MEK inhibitor U0126 promotes functional recovery after ICH in mice. A, ICH and sham animals received intracerebroventricular injections of 12 µg U0126 or vehicle at 2 h after ICH surgery, and the functional recovery (adhesive tape removal and corner task) was assessed up to 7 d after ICH. Values show mean ± SD for adhesive tape removal and median for corner task; *p < 0.05 versus baseline, #p < 0.05 versus ICH+vehicle. B, The indirect hematoma volume and hemispheric swelling (edema) were measured at 24 h after ICH. The values show the mean ± SD for hematoma volume and the median for hemispheric swelling. C, D, Neuronal cell survival was assessed using Fluoro-jade B staining in the perihematoma (C) and NeuN immunofluorescence in the cortex and striatum (D) at 24 h after ICH. Scale bar: 100 µm. Mean ± SD is shown. *p < 0.05. For exact p values, refer to Extended Data Figure 1-3.
Figure 2.
Figure 2.
MEK1/2 inhibitors other than U0126 do not protect primary neurons from hemin-induced and hemoglobin-induced neuronal ferroptosis. A, Primary neurons were exposed to 100 μm hemin or 1.5 μm hemoglobin (LD50) and different, structurally diverse MEK1/2 inhibitors. The values reflect the medians (interquartile ranges) at 10 μm of each inhibitor. Grayscale coding reflects a continuum from no protection from hemin or hemoglobin toxicity by a MEK1/2 inhibitor (black) to maximal possible cell viability (white). B, The representative live/dead staining of the inhibitors in hemin-induced neuronal ferroptosis are shown. Scale bar: 100 µm. C, The total and phospho-ERK1/2 protein levels were assessed in primary neurons exposed to hemin and 10 μm different MEK1/2 inhibitors. Medians are given of the ratios of phospho-ERK by total ERK1/2 normalized to γ-tubulin loading control that does not change in response to hemin; *p = 0.017 versus vehicle, #p < 0.05 versus hemin. For exact p values, refer to Extended Data Figure 2-1.
Figure 3.
Figure 3.
MEK1/2 inhibitors in hemin-induced and hemoglobin-induced neuronal ferroptosis. The concentration-responses of MEK1/2 inhibitors in primary neurons exposed to (A) hemin-induced and (B) hemoglobin-induced ferroptosis. Medians are indicated; *p < 0.05 versus hemin or hemoglobin + vehicle. For exact p values, refer to Extended Data Figures 3-1, 3-2.
Figure 4.
Figure 4.
The molecular knock-down of phospho-ERK1/2 by overexpressing MKP3 (Mkp3) has distinct effects on hemin-induced and glutathione depletion-induced ferroptosis. A, We overexpressed the highly ERK-specific phosphatase Mkp3 and its catalytic mutant, Mkp3 C293S that enhances ERK1/2 phosphorylation but blocks its nuclear translocation, in HT22 cells. pSG5 served as control (empty vector). B, The levels of phospho-ERK and total ERK (normalized to γ-tubulin) were evaluated after overexpressing MKP3 or MKP3 C293S for 36 h. Medians are given of the ratios of phospho-ERK by total ERK1/2 normalized to γ-tubulin loading control that does not change in response to hemin; *p < 0.001 versus pSG5. For all statistical analyses, refer to Extended Data Figure 4-1. C, The cell viability was assessed after overexpressing Mkp3 or Mkp3 C293S (40 µl/ml lipofectamine) for 24 h followed by treatment with 25–100 μm hemin (hemin-induced ferroptosis) and 10 mm HCA (glutathione depletion-induced ferroptosis) for another 24 h. Medians are given; *p < 0.05 versus 0 μm hemin, #p < 0.05 versus pSG5. For exact p values, refer to Extended Data Figure 4-2.
Figure 5.
Figure 5.
Hyperactivated ERK1/2 remains in the cytoplasm in hemin-induced ferroptosis and the transcription of Mkp1 and Mkp3, its negative regulators, is delayed. A, The time course of the levels of phospho-ERK and total ERK was assessed in the cytoplasmic and nuclear extracts of primary neurons exposed to 100 μm hemin or 5 mm HCA (normalized to γ-tubulin for cytoplasmic fractions or Histone H4 for nuclear fractions). The fractionation was confirmed by evaluating the Histone H4 expression in the cytoplasmic fractions and the GAPDH expression in the nuclear fractions. Medians are given, except for the nuclear fractions in hemin that are means ± SD; *p < 0.05 versus 0 h. For exact p values, refer to Extended Data Figure 5-1. B, The Mkp1 and Mkp3 mRNA expression was measured in primary neurons exposed to 100 μm hemin or 5 mm HCA. The values represent the medians for hemin and the means ± SD for HCA; *p < 0.05 versus 0 h. For exact p values, refer to Extended Data Figure 5-2.
Figure 6.
Figure 6.
The inhibition of Raf, MEK5/ERK5, MEK4, and the activation of AMPK do not protect primary neurons from hemin-induced neuronal ferroptosis. A, Primary neurons were exposed to vehicle or 100 μm hemin and different concentrations of the selective Raf inhibitor GW5074. B, The concentration-responses of BIX02189 (MEK5 inhibitor) and XMD17-109 (ERK5 inhibitor) in primary neurons exposed to hemin-induced ferroptosis. C, The concentration-responses of the MEK4 inhibitors in primary neurons exposed to hemin-induced ferroptosis. D, Concentration response for metformin (AMPK activator) in primary neurons exposed to hemin-induced ferroptosis. AMPK activation is shown by western blotting of the total and phospho-AMPK protein levels assessed in primary neurons exposed to vehicle or 5 mm metformin. The values represent the medians. For exact p values, refer to Extended Data Figure 6-1.
Figure 7.
Figure 7.
Unbiased phosphoproteomics of ferroptotic cell death induced by erastin and hemin. A, Primary neurons were treated with 5 μm erastin for 7 h or 100 μm hemin for 5 h. Scatter plots compared with control are shown where p < 0.001 was used as a threshold. A total of 51 peptides from 49 proteins after erastin treatment and 452 peptides from 369 proteins after hemin treatment showed altered levels. Eight peptides were similarly increased or decreased. The Jaccard similarity coefficient = 0.016 (for full list of phosphopeptides, refer to Extended Data Fig. 7-1). B, Top 10 ranked enriched kinases in erastin-treated or hemin-treated cells compared with control based on the mean rank of enrichment over 11 gene set libraries (see also Extended Data Fig. 7-2). For top 10 ranked kinases downregulated in hemin-treated cells, see Extended Data Figure 7-3. C, Motif analysis around the phosphorylation sites. Size of characters are informative of amino acid abundances on each position (in a scale from 1 to −1; positive values, overrepresented; negative values, undrerrepresented) and are normalized to background amino acid frequencies calculated from all aminoacids within ±7 residues of the central modified residues of the specified type (here, S) that are identified in PhosphoSitePlus.Rxxs (CAMK2, Akt, PKA, DMPK1/2) was overrepresented in hemin versus control compared with erastin versus control (ratio 1.18), whereas (D/E)xx(s/t) (casein kinase I) was underrepresented (ratio 0.85; see also Extended Data Fig. 7-4).
Figure 8.
Figure 8.
Unbiased phosphoproteomics of U0126 treatment in ferroptotic cell death. A, Primary neurons were treated with 10 μm U0126 for 7 or 5 h in erastin-treated or hemin-treated cells. A total of 34 phosphopeptides from 34 proteins were significantly altered in hemin+U0126-treated versus hemin-treated cells and 61 phosphopeptides from 58 proteins in erastin+U0126-treated versus erastin-treated cells, with no overlap between both groups (p < 0.001, for full list of phosphopeptides, refer to Extended Data Fig. 7-1). B, Kinases enriched for proteins with phosphopeptides that were downregulated by U0126 compared with either erastin or hemin treatment alone. The top 10 kinases are ordered by the mean rank of enrichment over 11 gene set libraries (see also Extended Data Fig. 7-2). For top 10 ranked kinases upregulated in erastin+U0126-treated cells, see Extended Data Figure 8-1. C, Analysis of phosphopeptides that were significantly changed in hemin versus control treatment, that also had significantly different levels between the hemin-treated and erastin-treated cells, and where U0126 treatment led to changes in the opposite direction of the hemin treatment identified 247 phosphopeptides with significantly altered levels (p < 0.05, see also Extended Data Fig. 8-2). Dashed lines indicate a p value threshold of 0.05. D, Motif analysis shows that Rxxs (CAMK2, Akt, PKA, DMPK1/2), (s/t)xx(E/D) (CK2), and sP (MAPK and other kinases) were enriched versus their abundance in the proteome. sxxD/E was overrepresented (ratio 2.06 or 2.05, respectively, see also Extended Data Fig. 8-3). E, F, Network analysis of the proteins revealed some GO cellular processes (E) and functions (F) that provide the basis for a future search for the target of U0126 in hemin-induced ferroptosis.

References

    1. Alim I, Caulfield JT, Chen Y, Swarup V, Geschwind DH, Ivanova E, Seravalli J, Ai Y, Sansing LH, Ste Marie EJ, Hondal RJ, Mukherjee S, Cave JW, Sagdullaev BT, Karuppagounder SS, Ratan RR (2019) Selenium drives a transcriptional adaptive program to block ferroptosis and treat stroke. Cell 177:1262–1279.e25. 10.1016/j.cell.2019.03.032 - DOI - PubMed
    1. Basso M, Berlin J, Xia L, Sleiman SF, Ko B, Haskew-Layton R, Kim E, Antonyak MA, Cerione RA, Iismaa SE, Willis D, Cho S, Ratan RR (2012) Transglutaminase inhibition protects against oxidative stress-induced neuronal death downstream of pathological ERK activation. J Neurosci 32:6561–6569. 10.1523/JNEUROSCI.3353-11.2012 - DOI - PMC - PubMed
    1. Behdenna A, Haziza J, Azencott C-A, Nordor A (2021) pyComBat, a Python tool for batch effects correction in high-throughput molecular data using empirical Bayes methods. bioRxiv 995431. doi: 10.1101/2020.03.17.995431. - DOI - PMC - PubMed
    1. Bullard SA, Seo S, Schilling B, Dyle MC, Dierdorff JM, Ebert SM, DeLau AD, Gibson BW, Adams CM (2016) Gadd45a protein promotes skeletal muscle atrophy by forming a complex with the protein kinase MEKK4. J Biol Chem 291:17496–17509. 10.1074/jbc.M116.740308 - DOI - PMC - PubMed
    1. Canals S, Casarejos MJ, de Bernardo S, Solano RM, Mena MA (2003) Selective and persistent activation of extracellular signal-regulated protein kinase by nitric oxide in glial cells induces neuronal degeneration in glutathione-depleted midbrain cultures. Mol Cell Neurosci 24:1012–1026. 10.1016/j.mcn.2003.08.004 - DOI - PubMed

Publication types