. 2022 Jan;601(7893):415-421.
doi: 10.1038/s41586-021-04263-y. Epub 2022 Jan 5.

Behavioural immune landscapes of inflammation

Affiliations

Behavioural immune landscapes of inflammation

Georgiana Crainiciuc et al. Nature. 2022 Jan.

Abstract

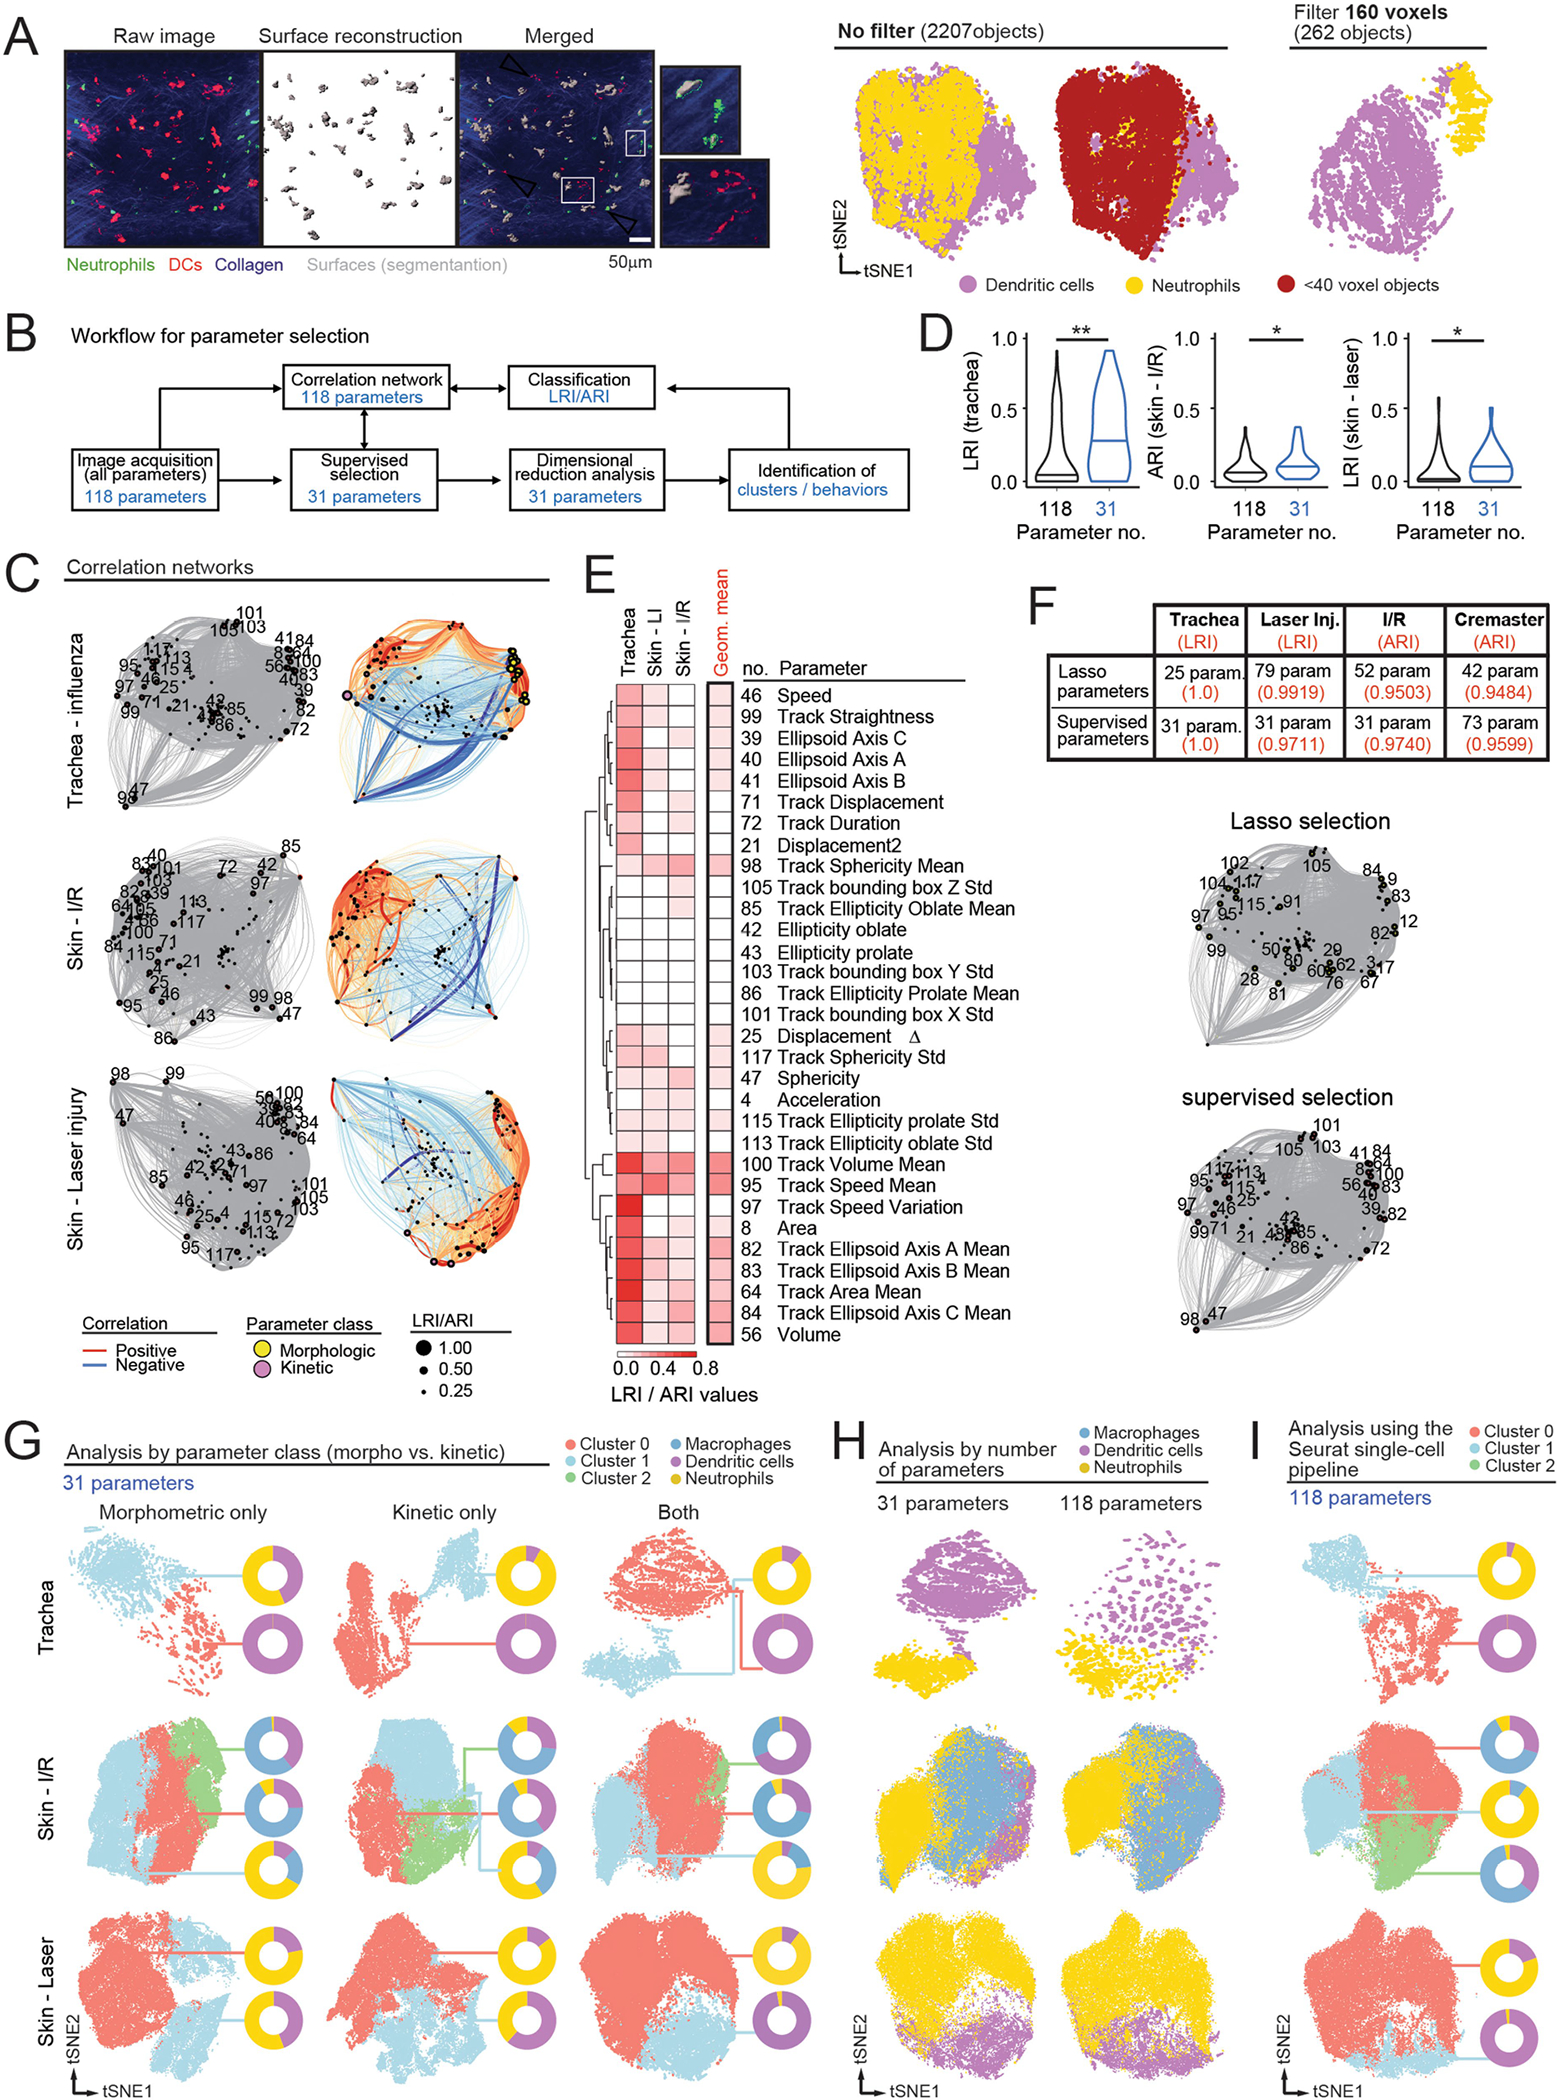
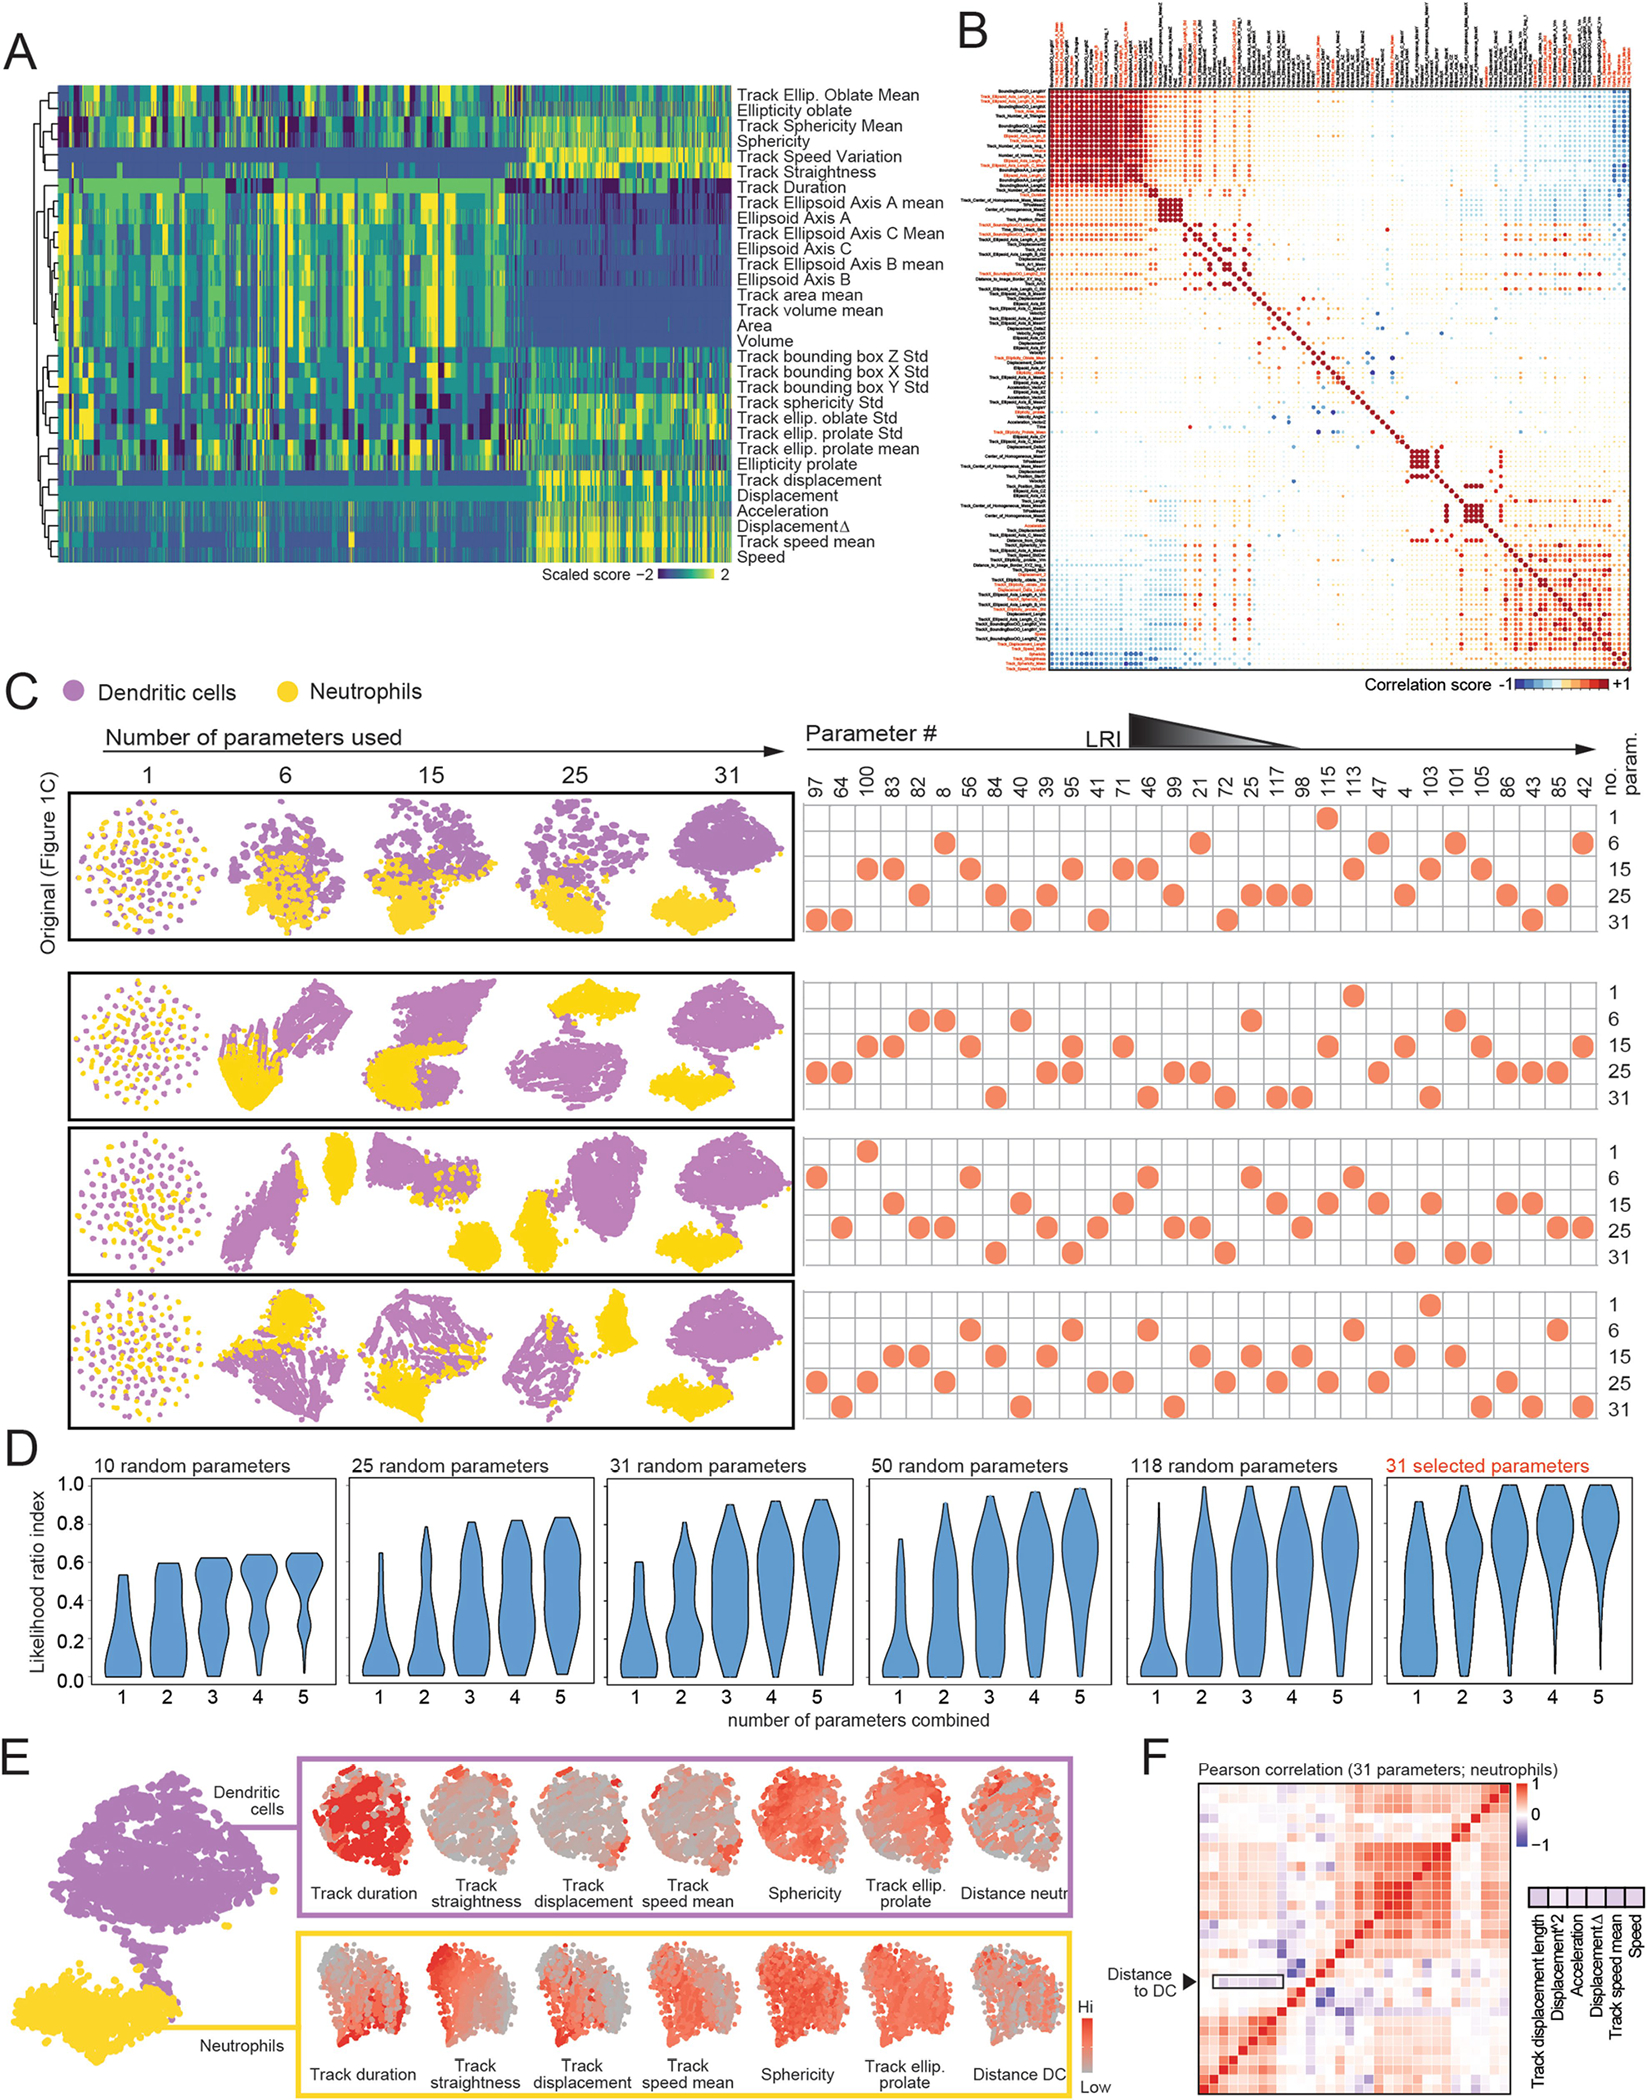
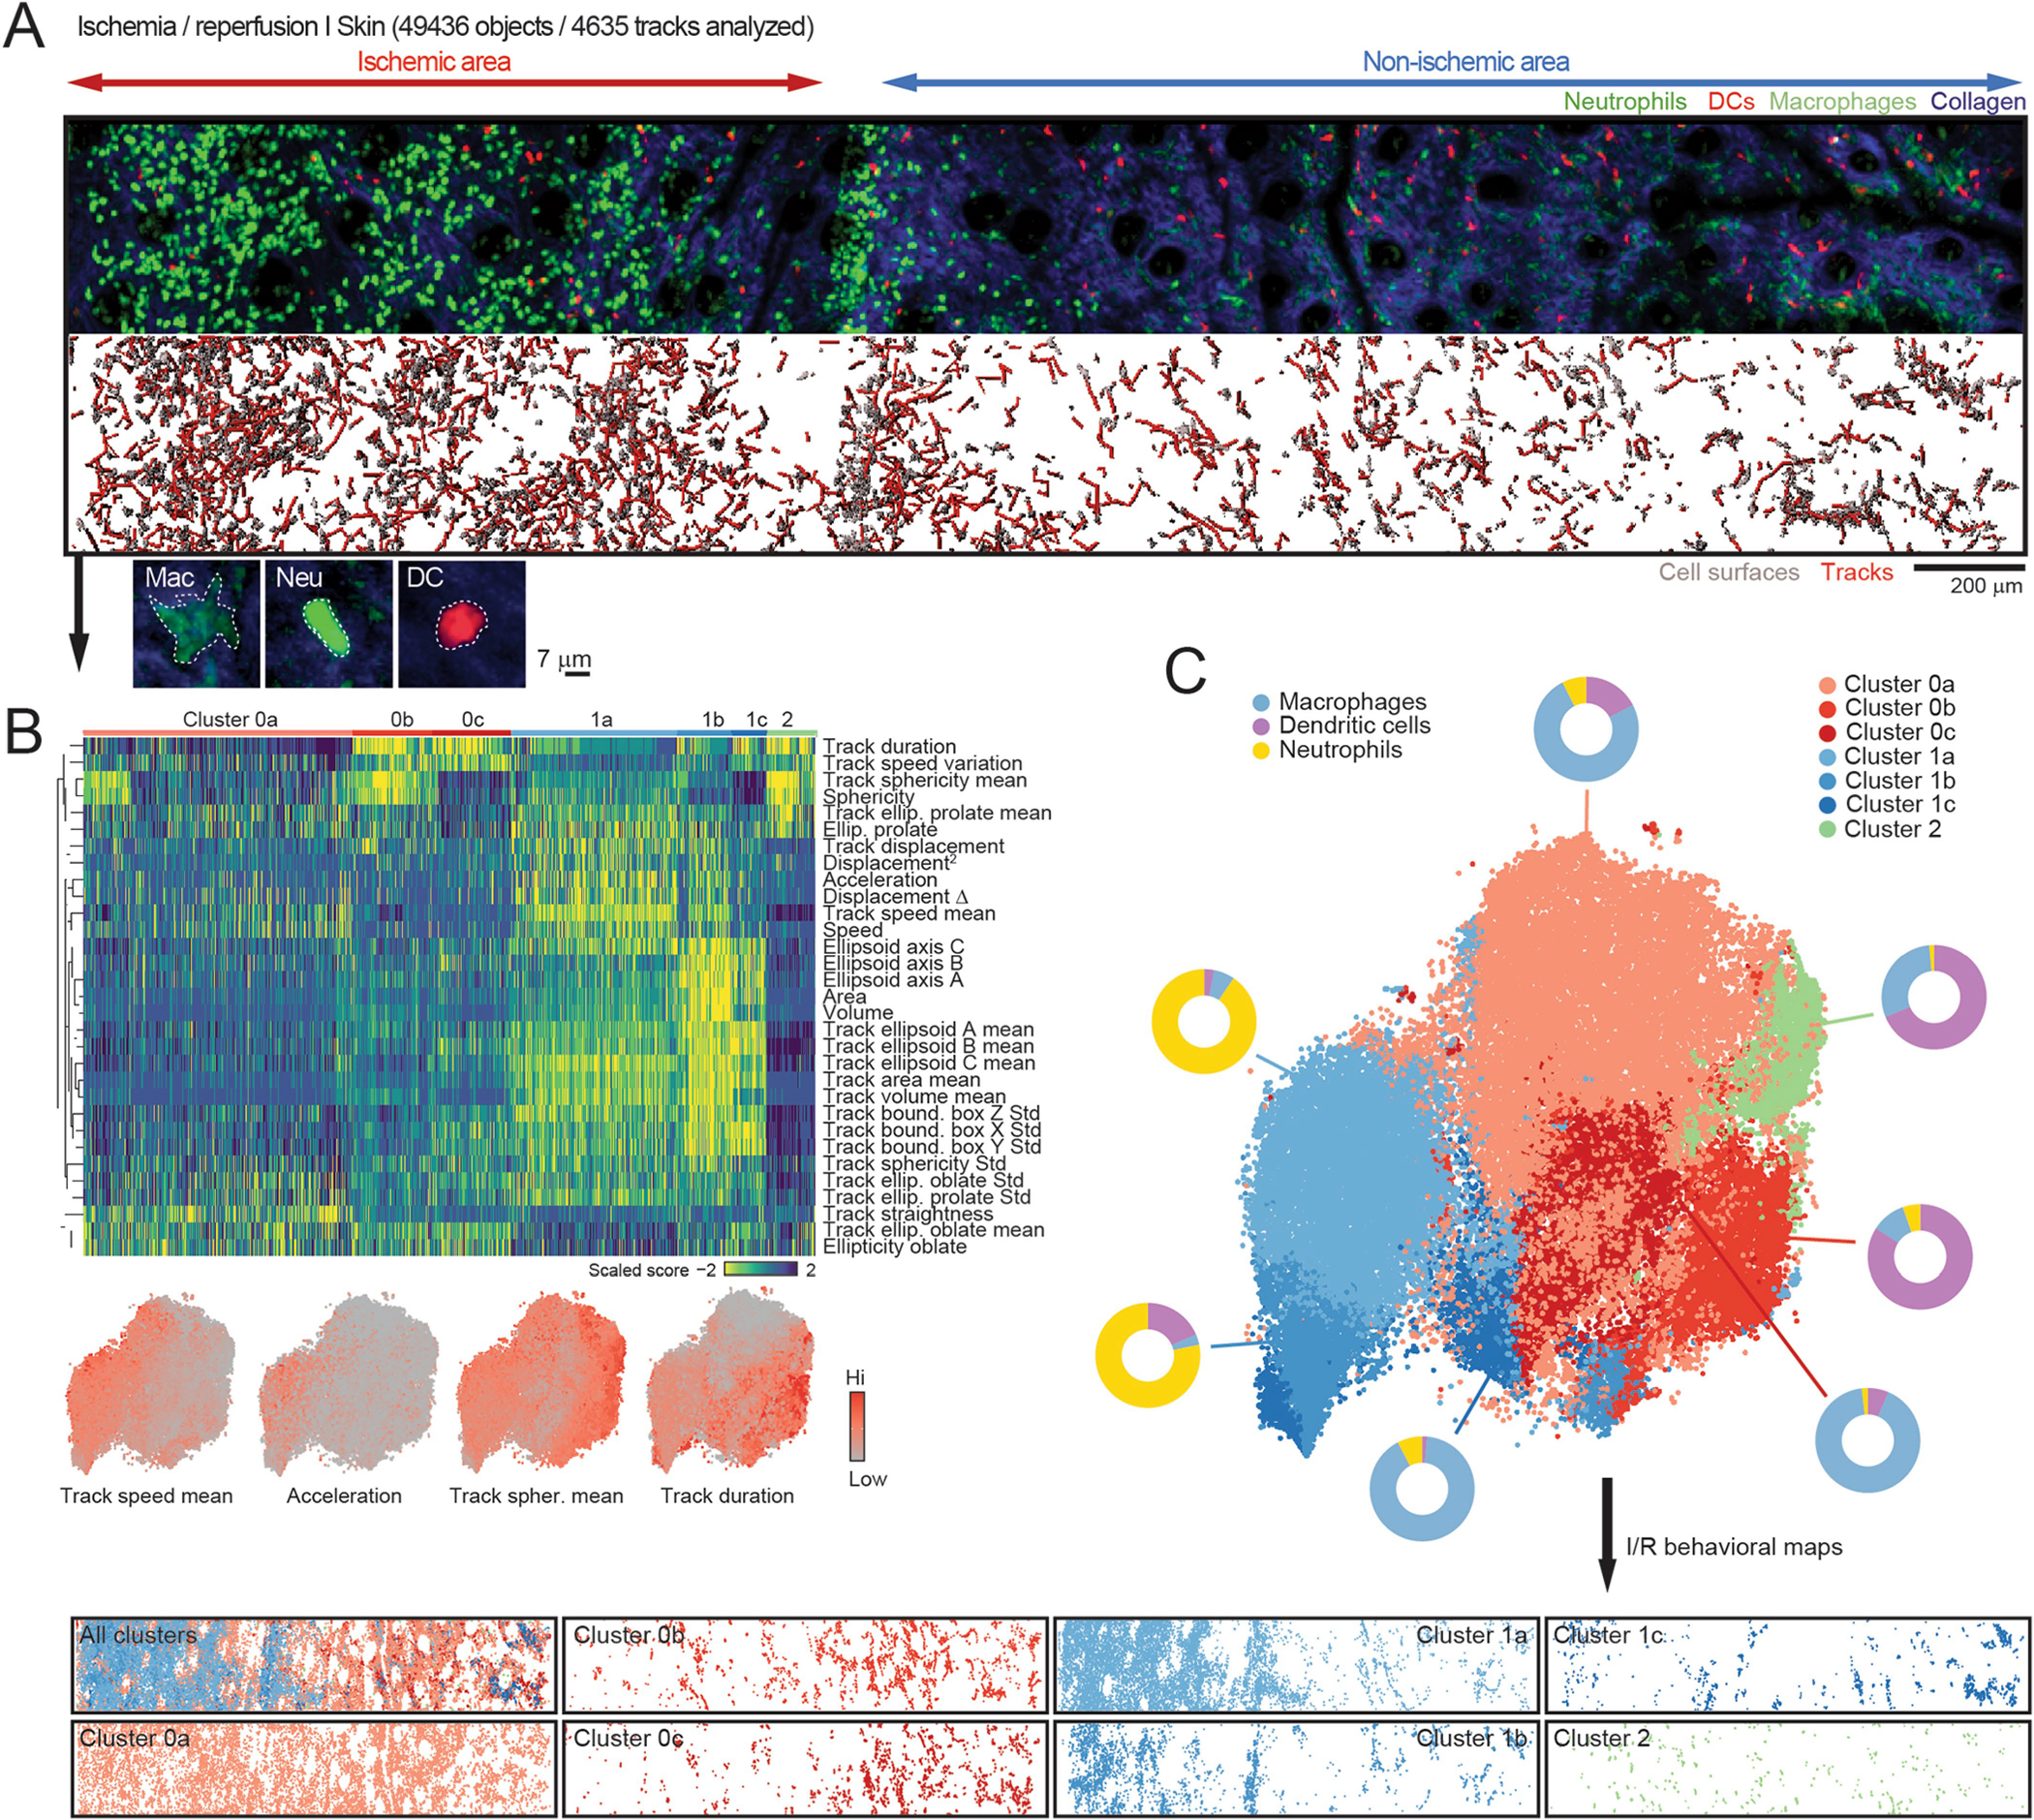
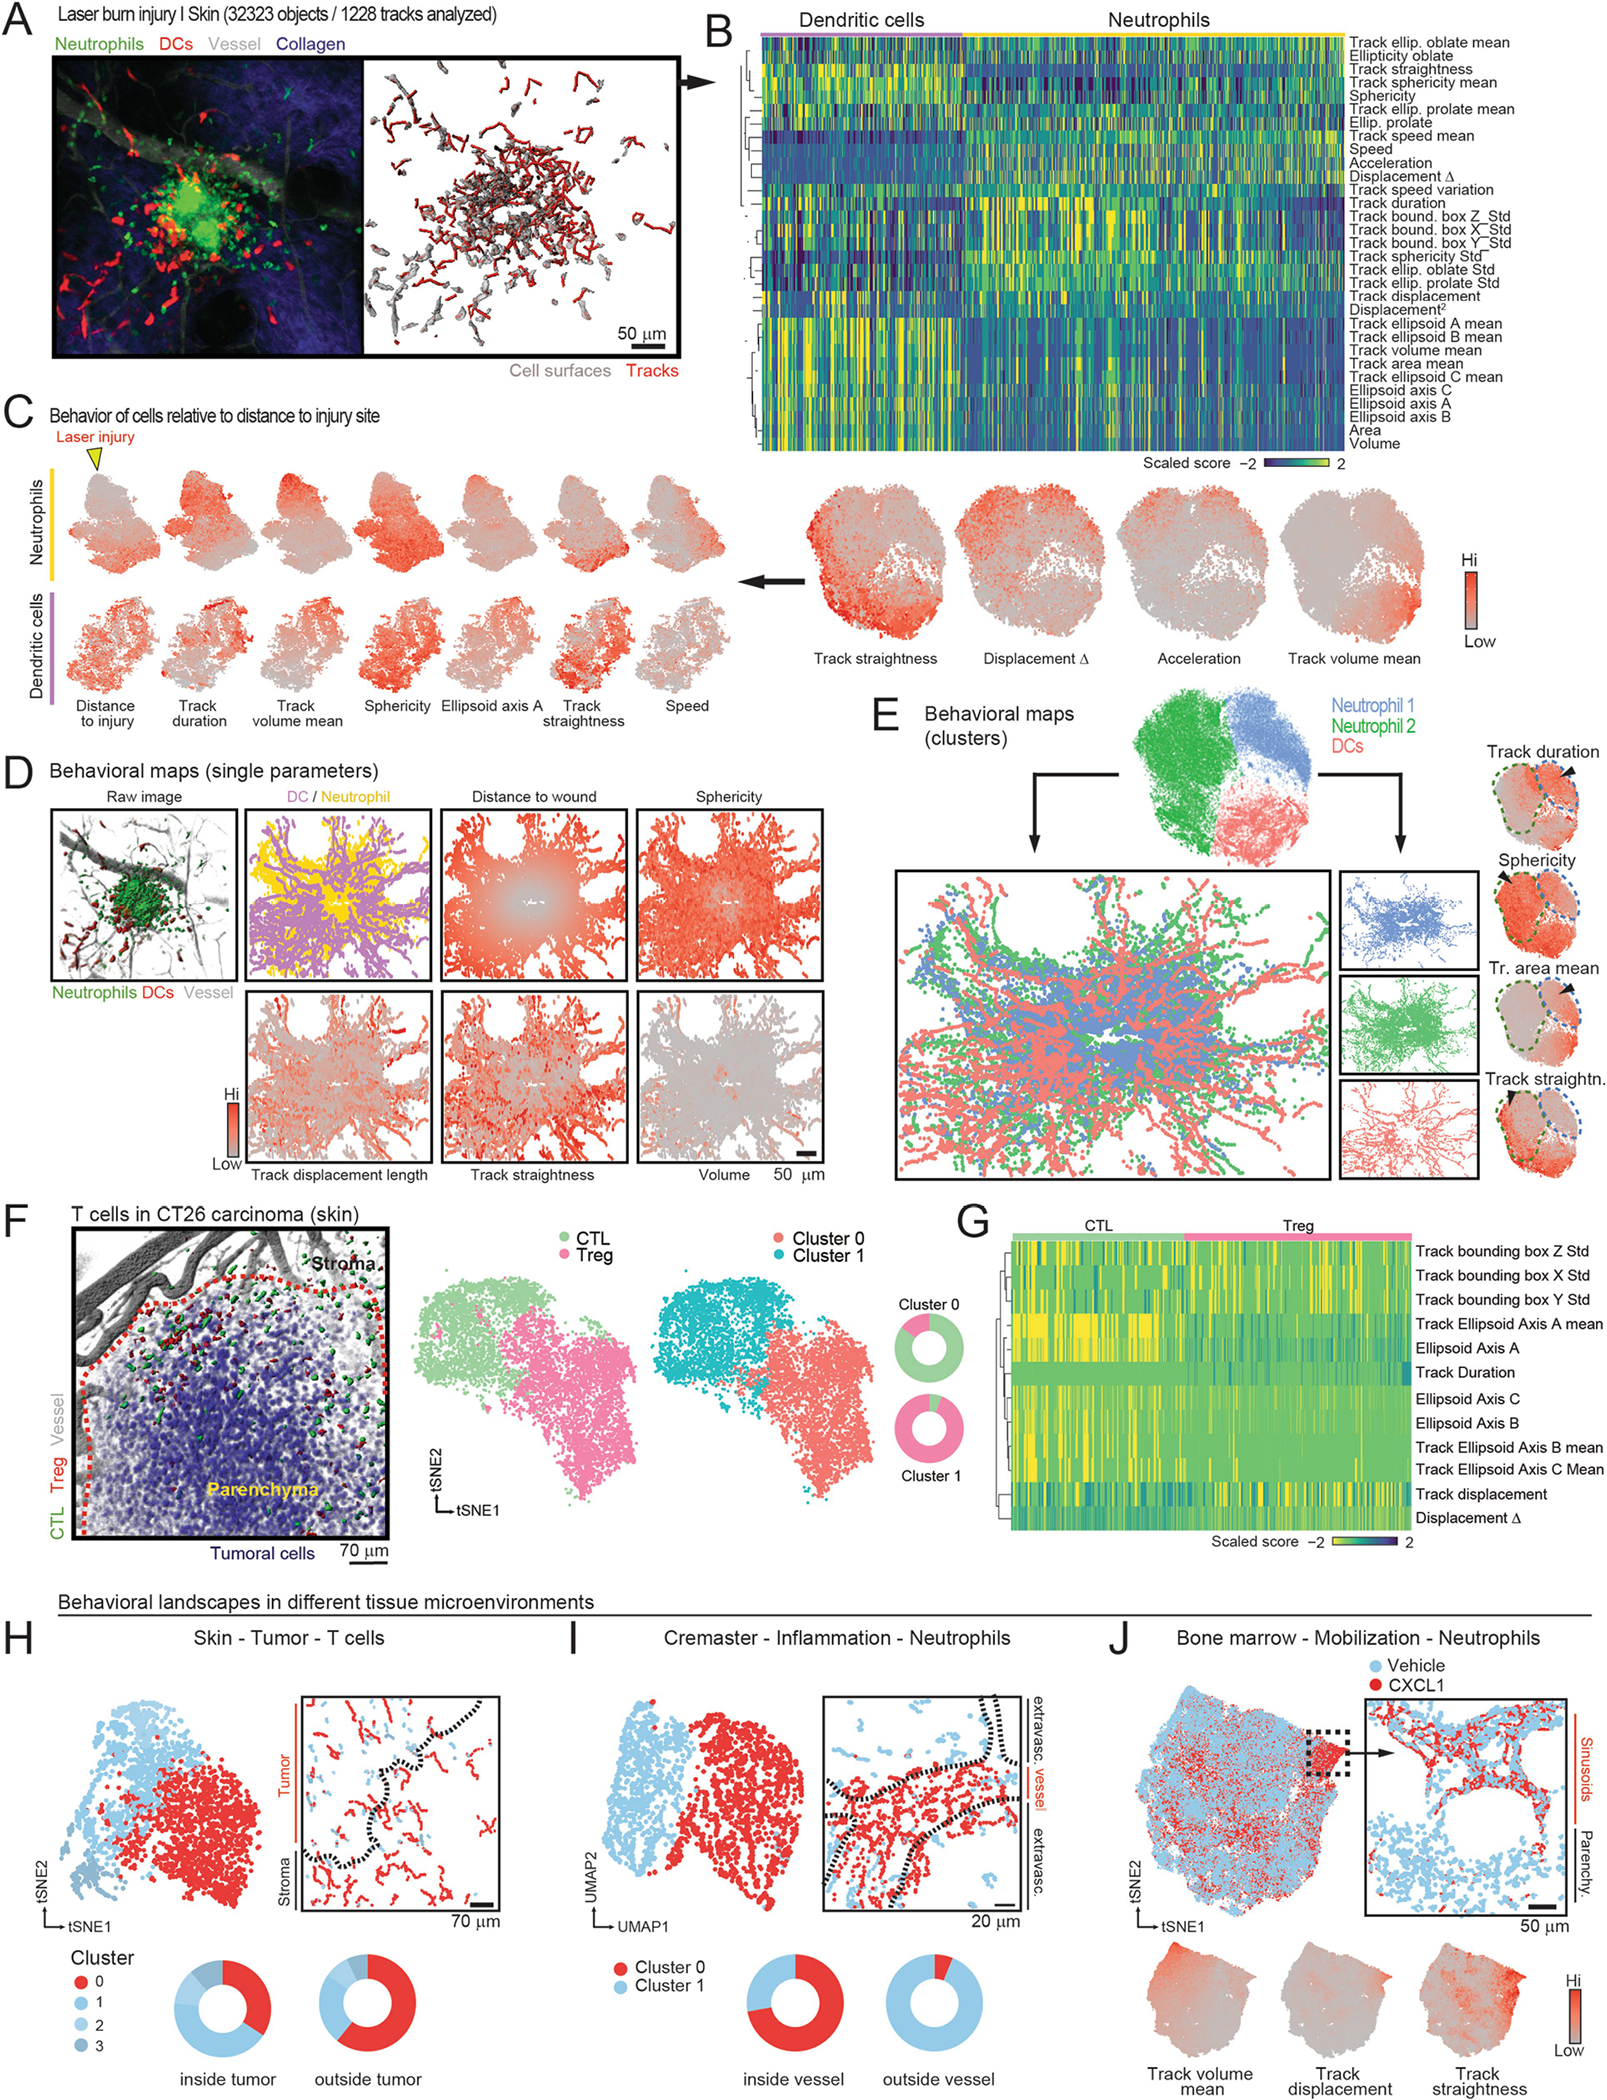
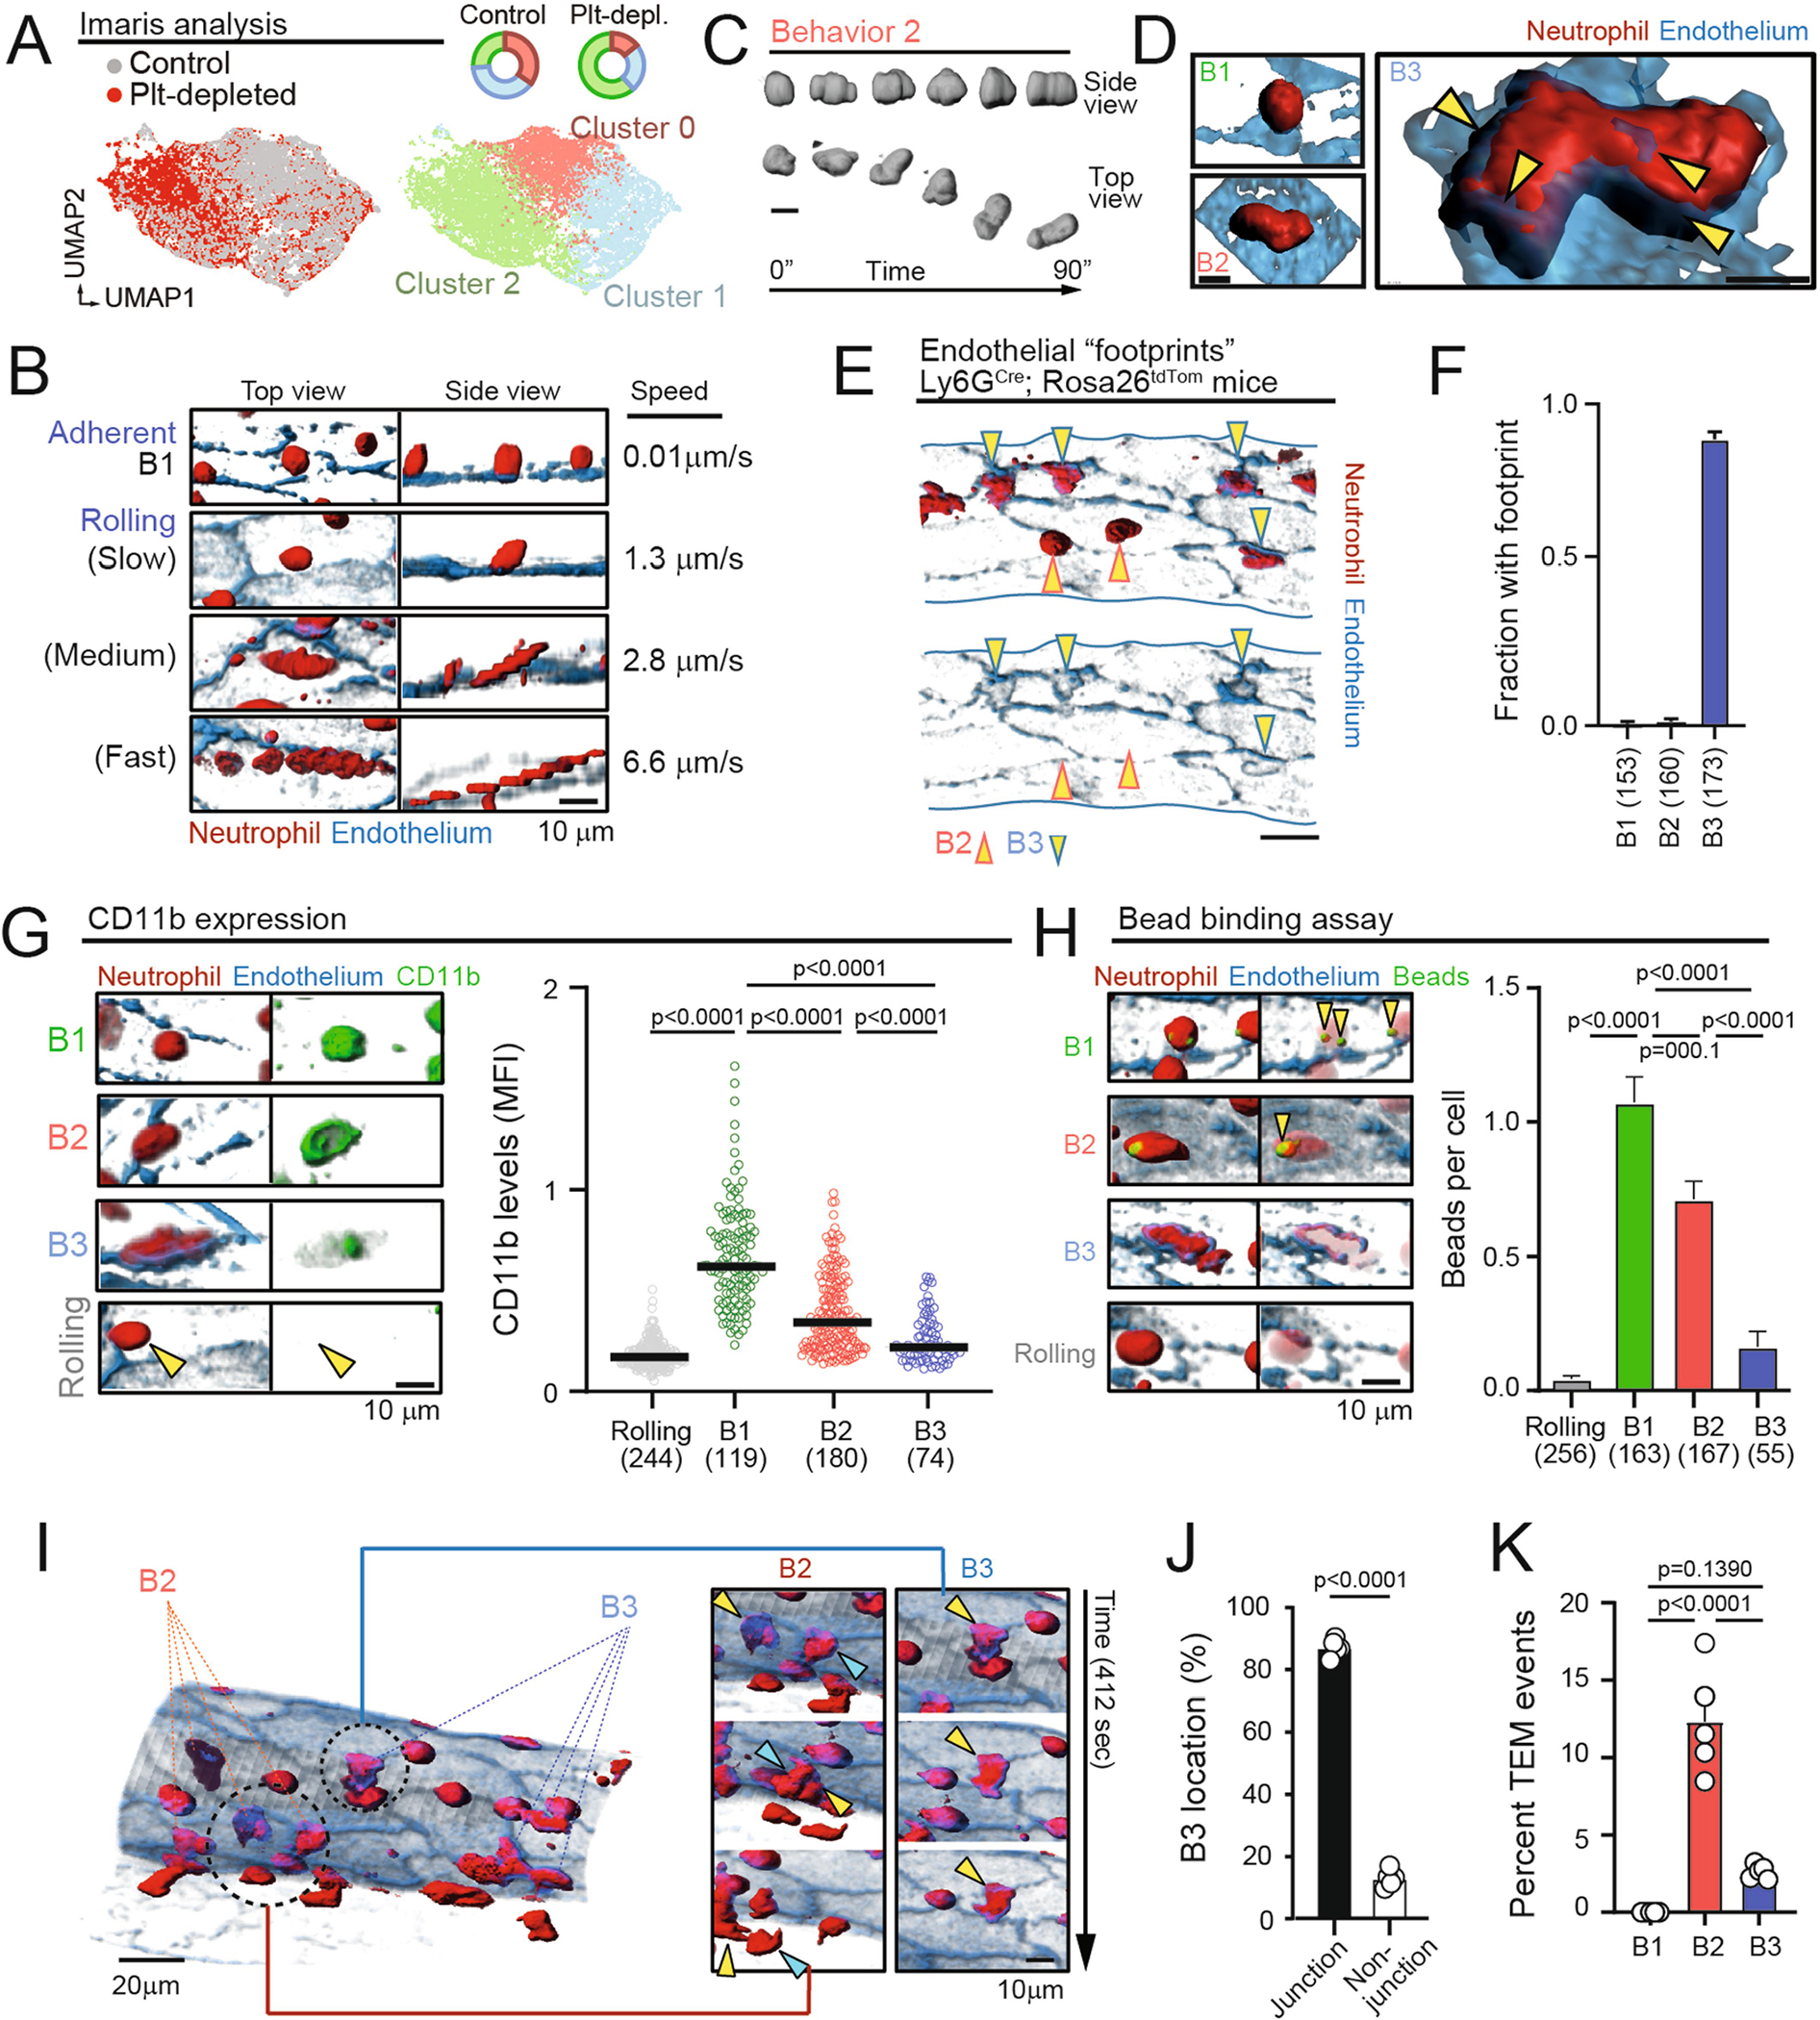
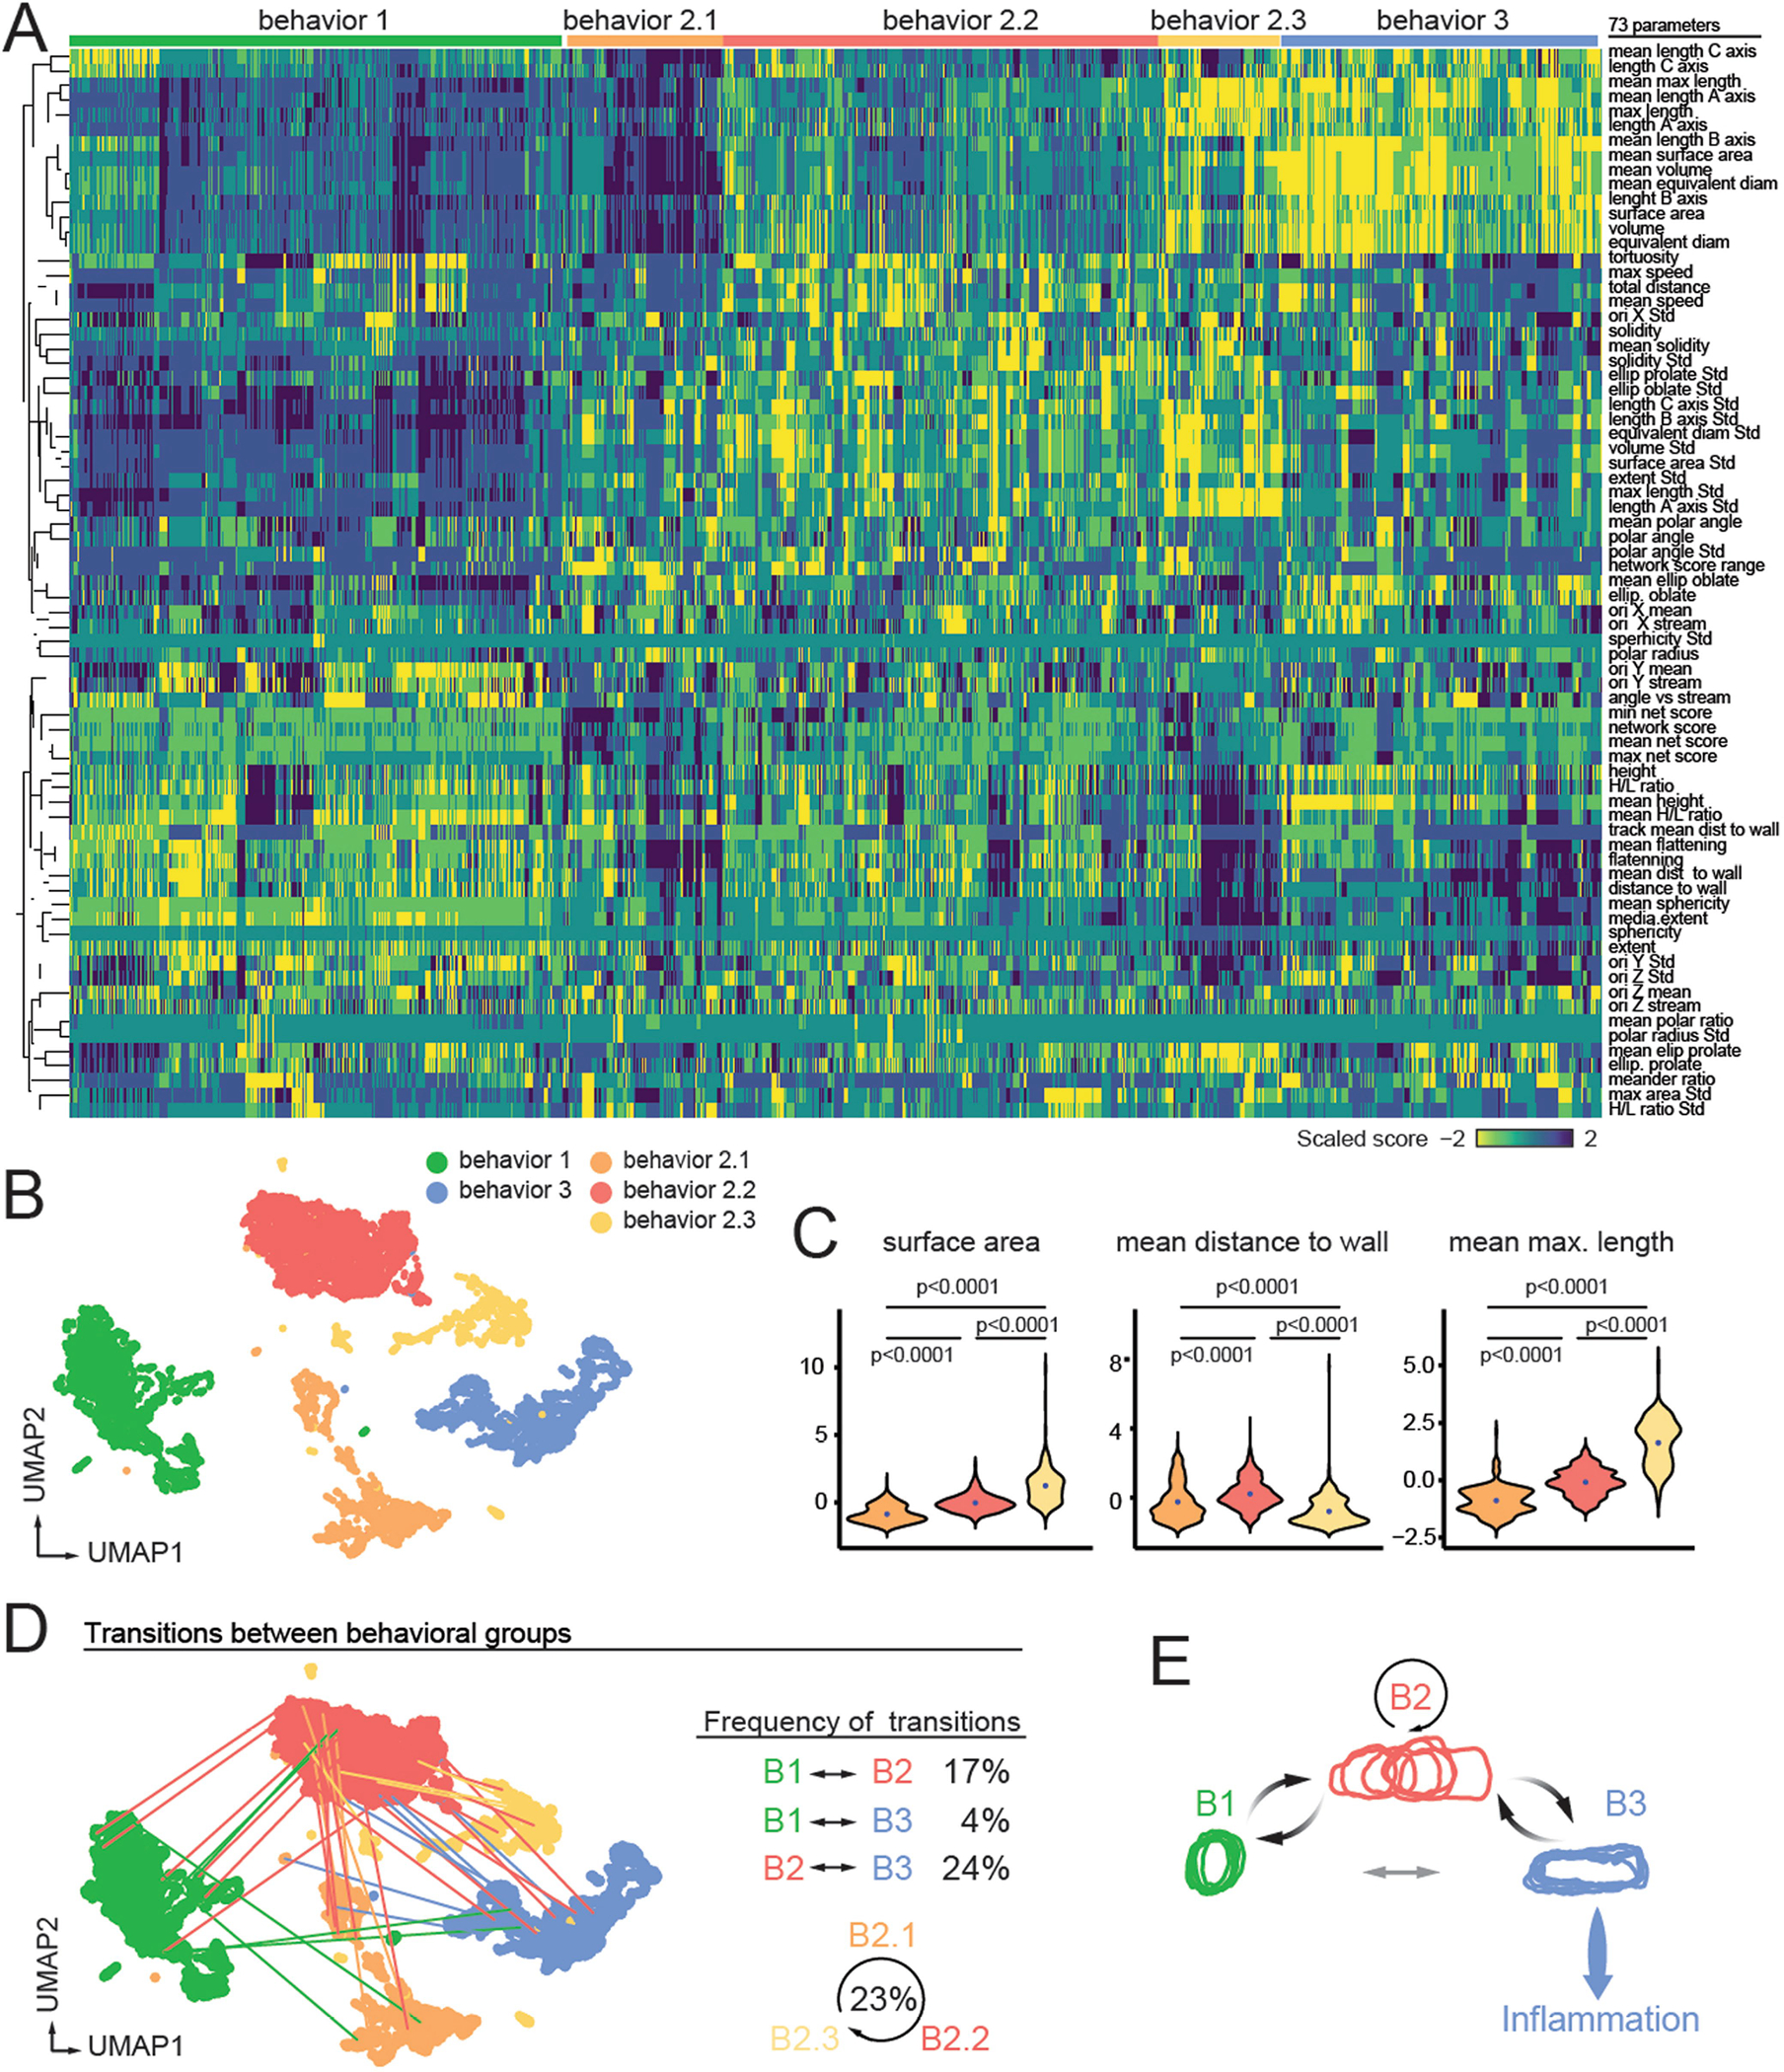
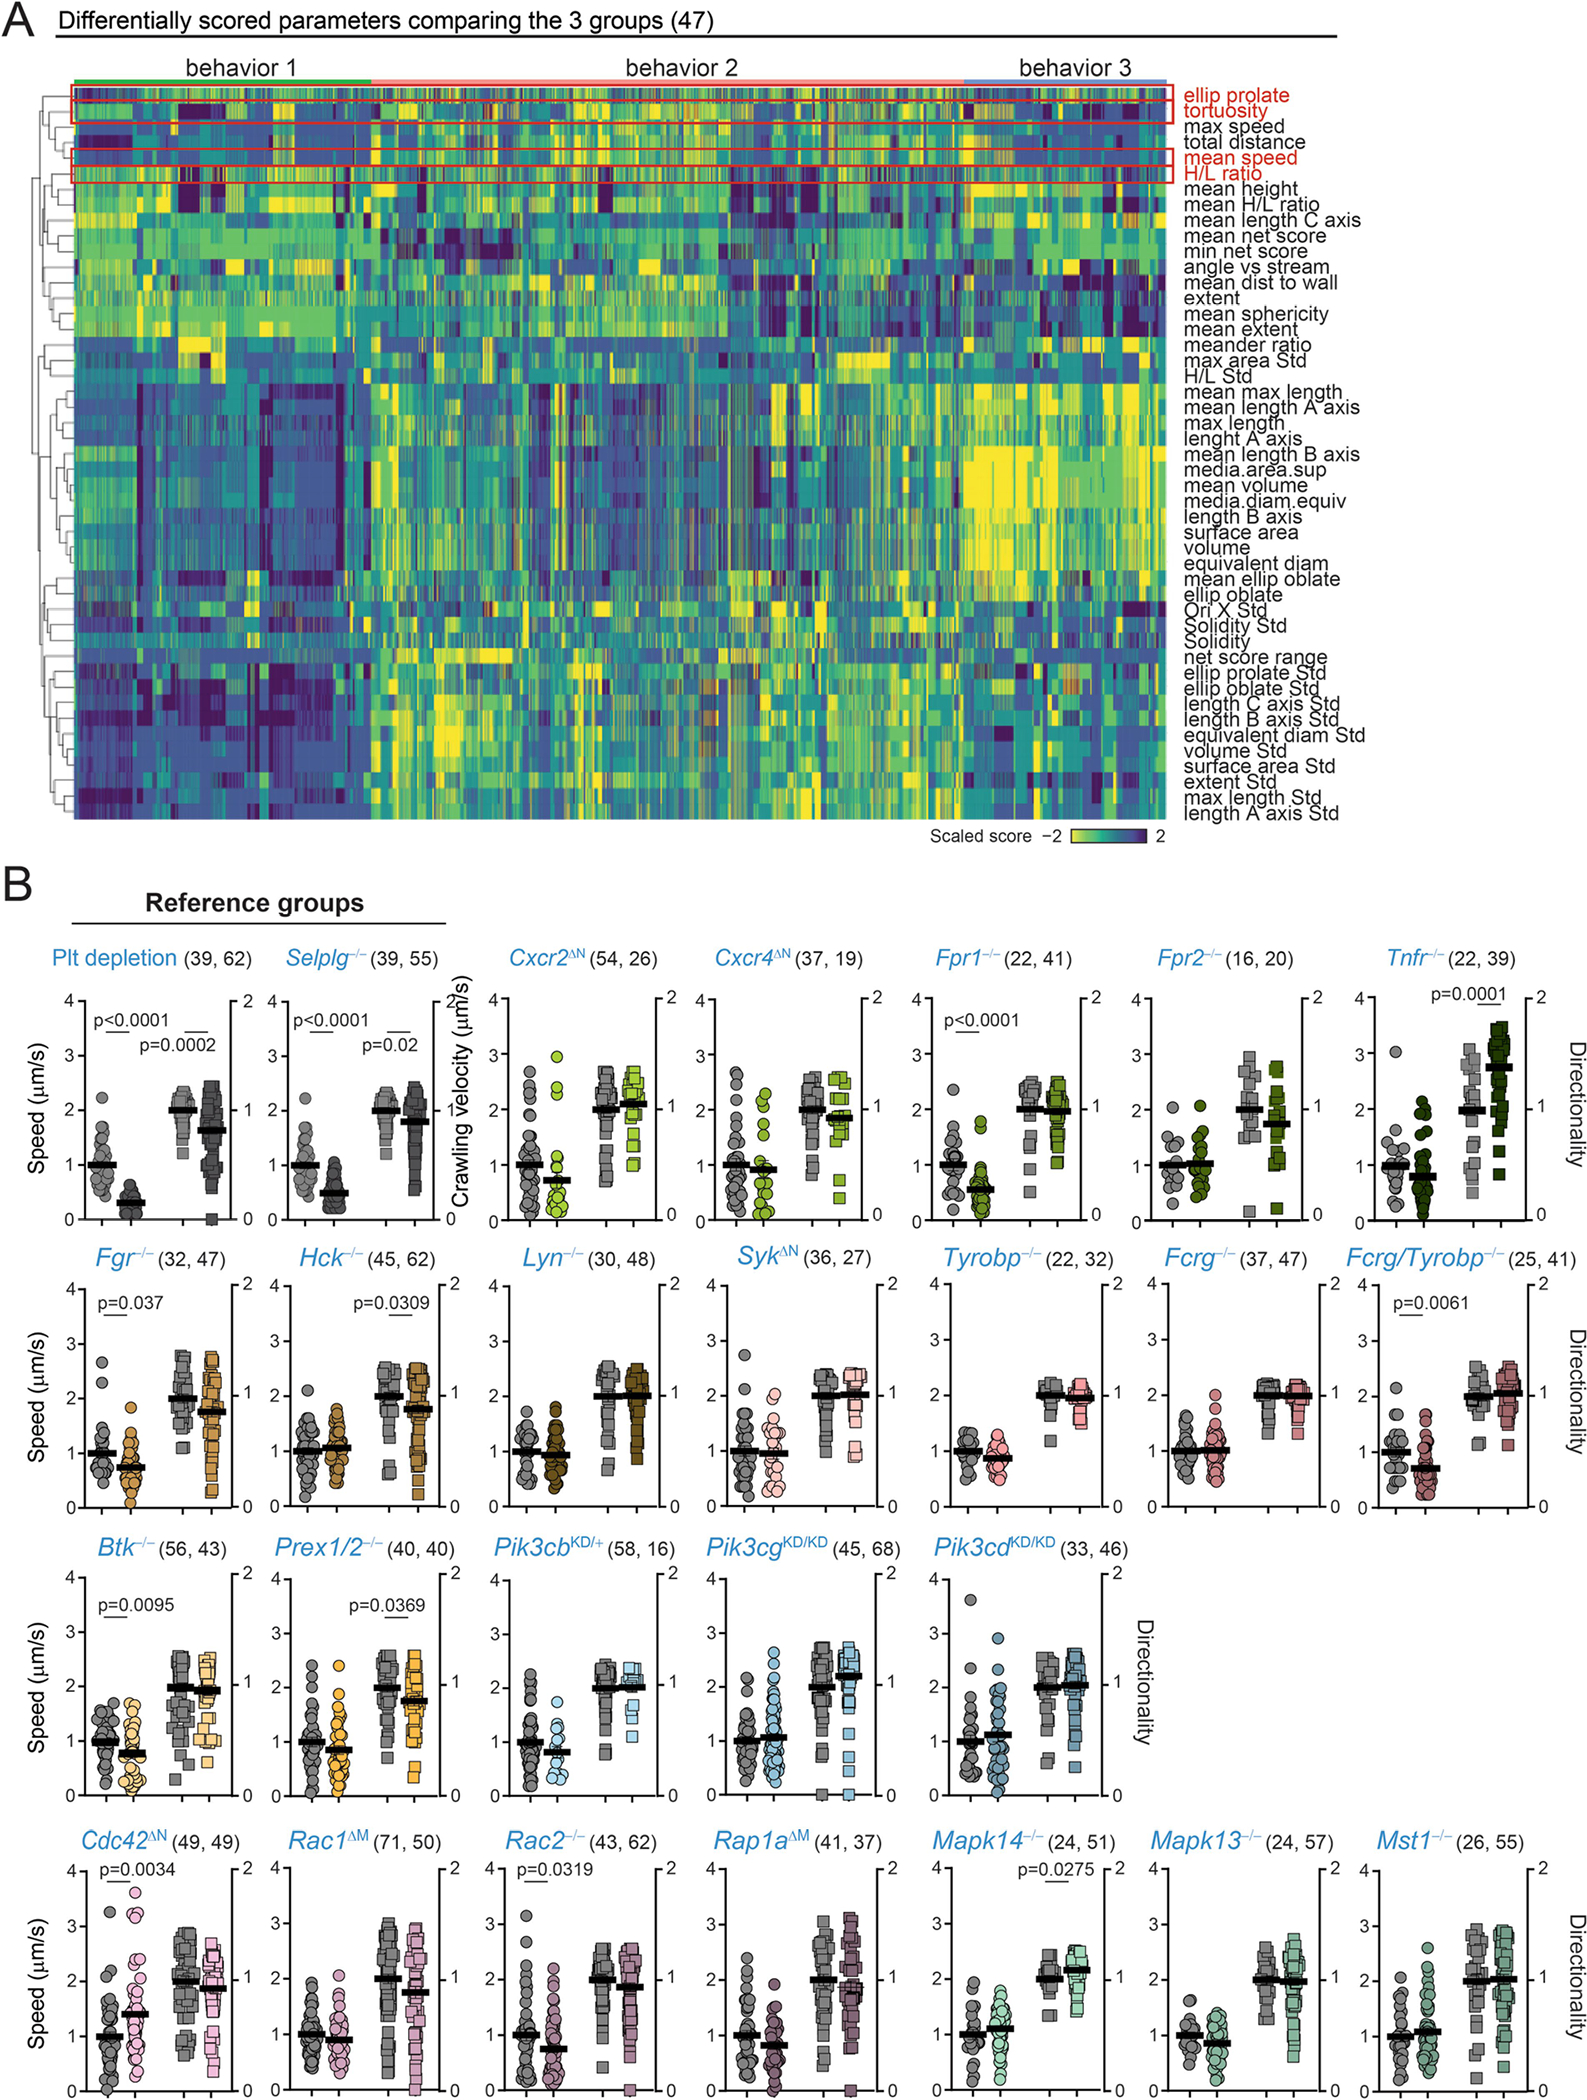
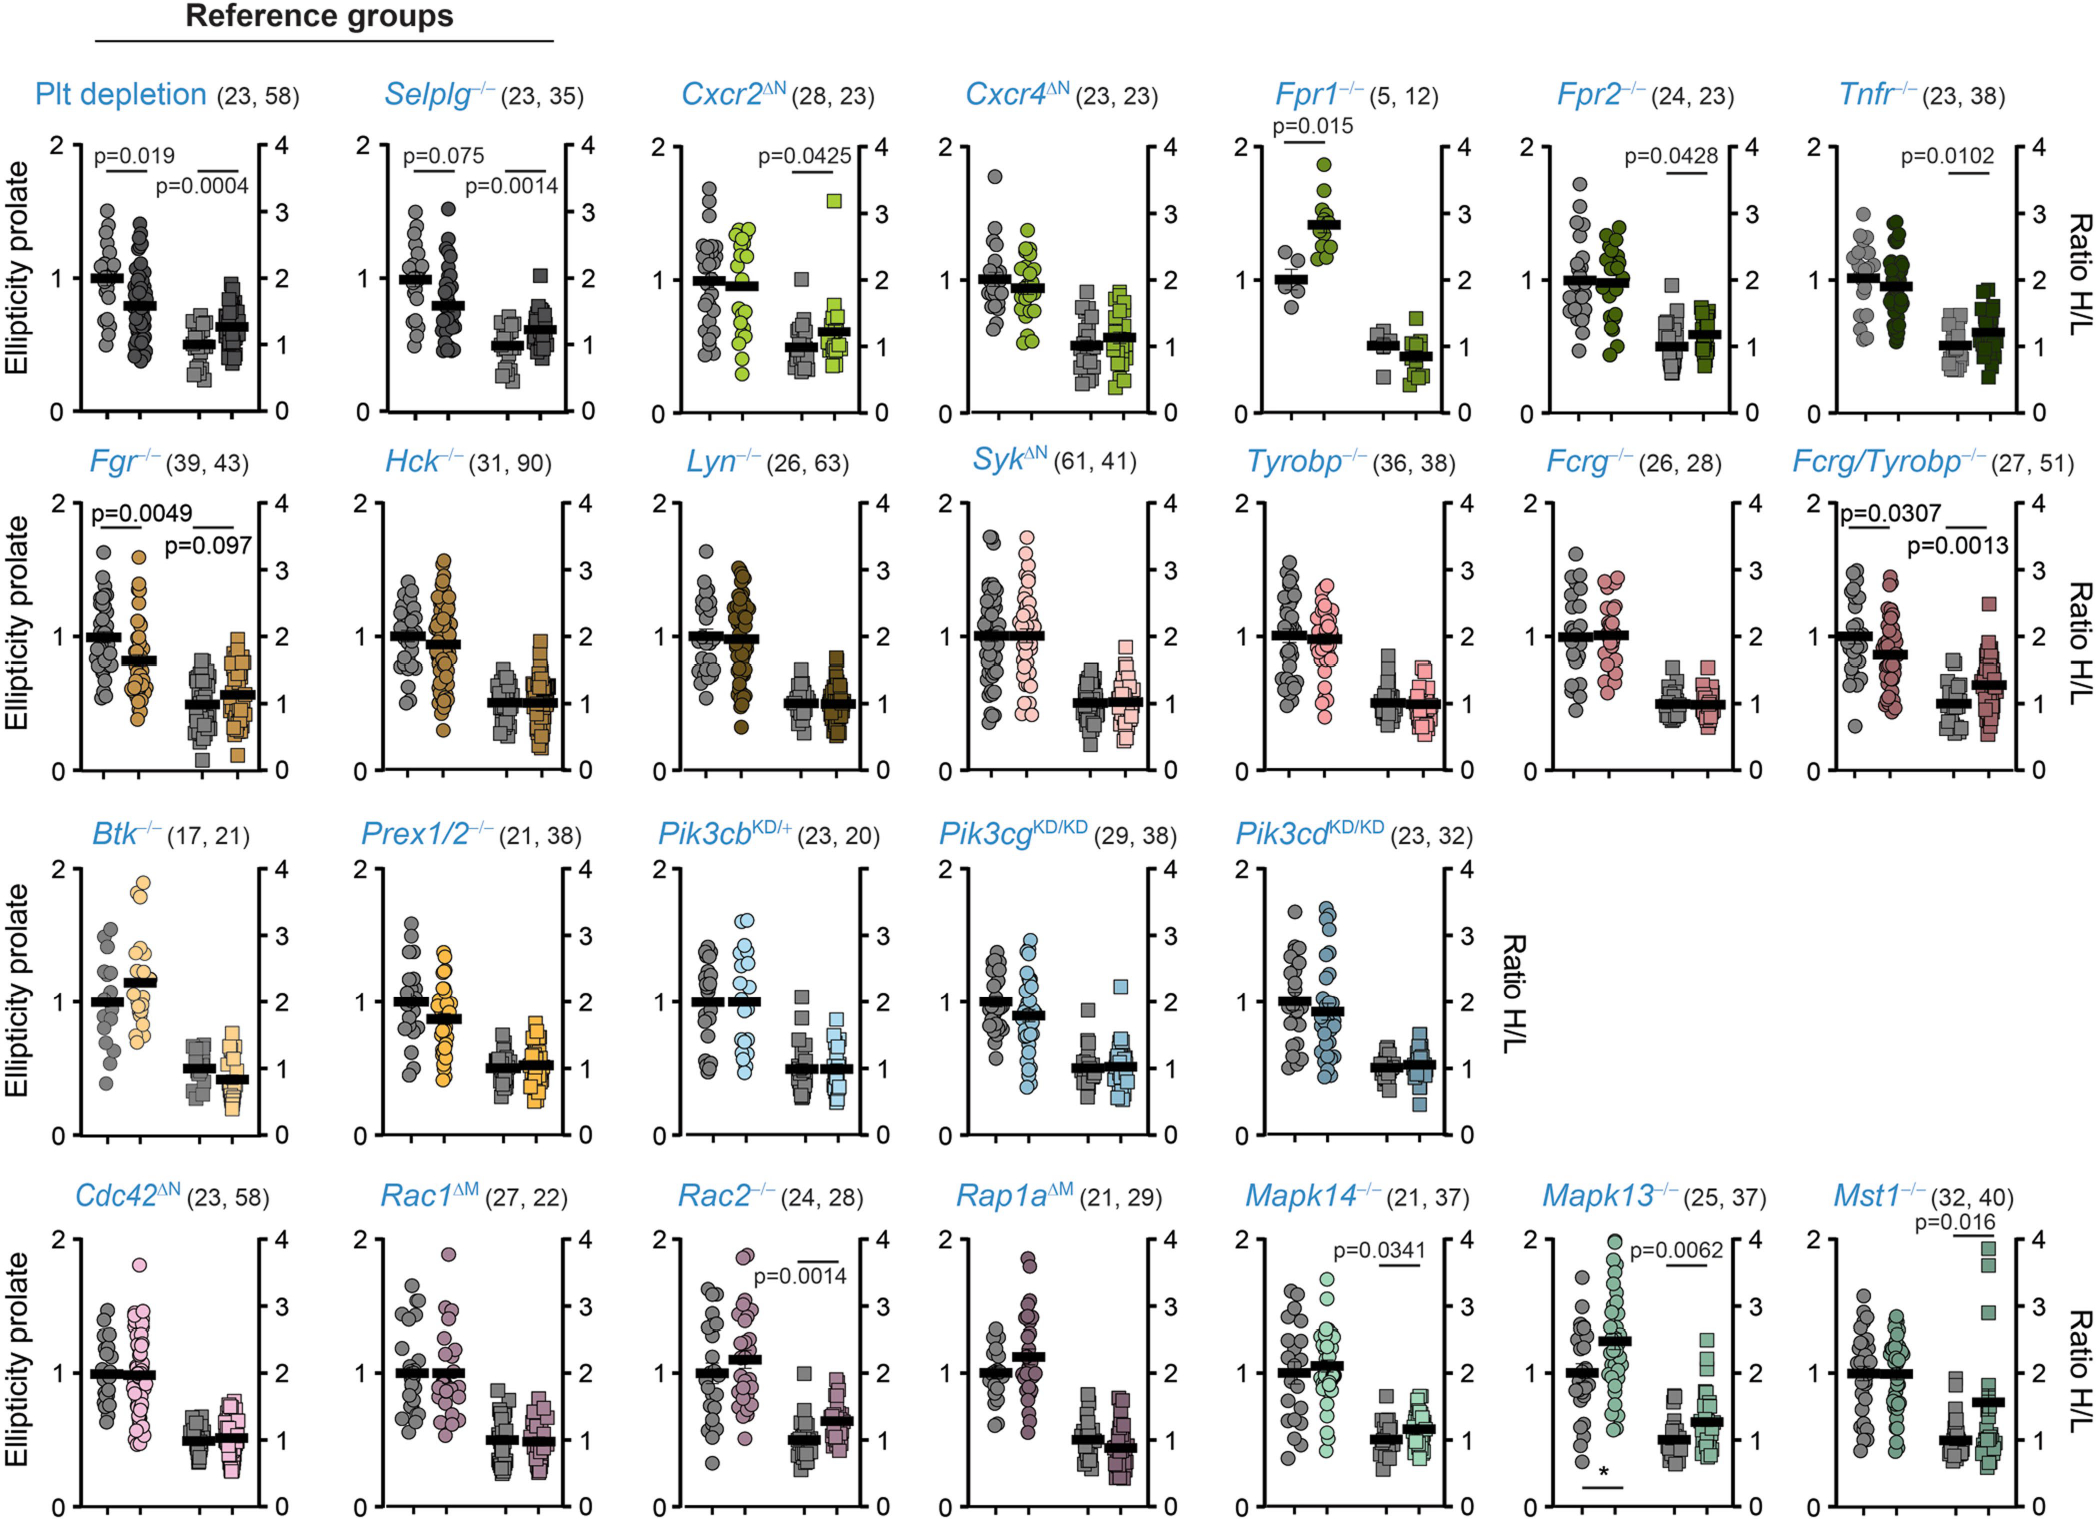
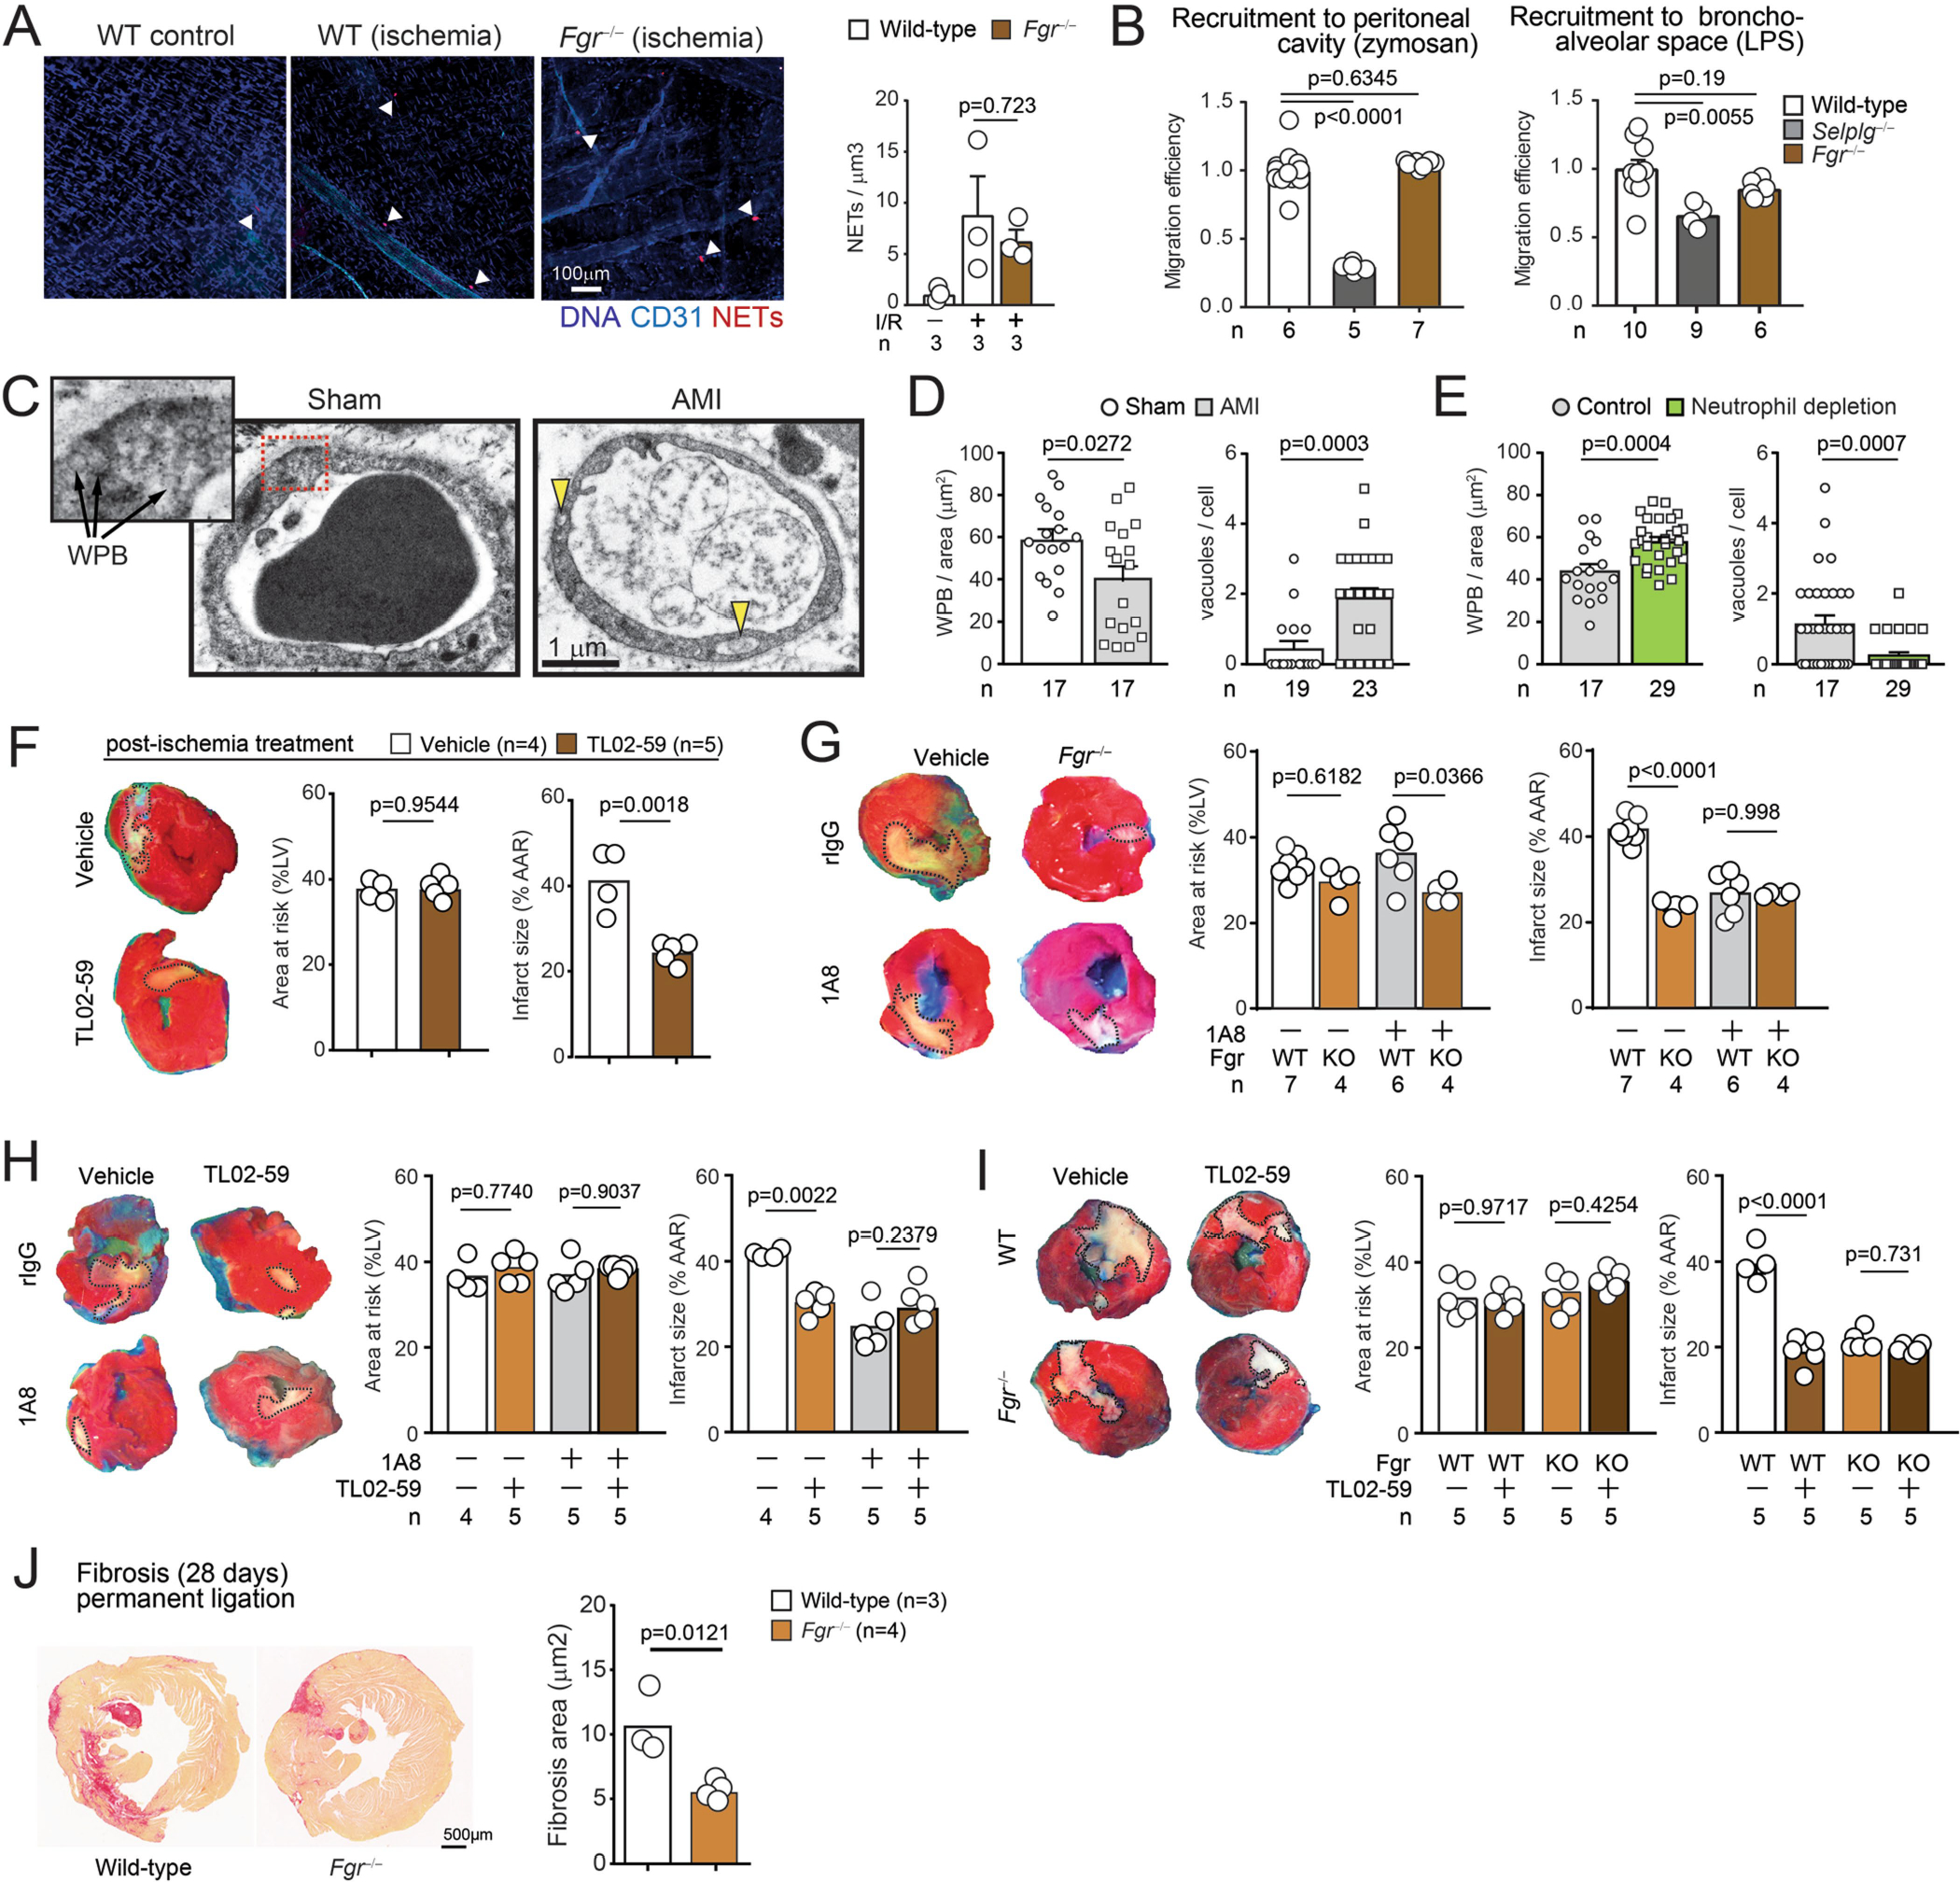
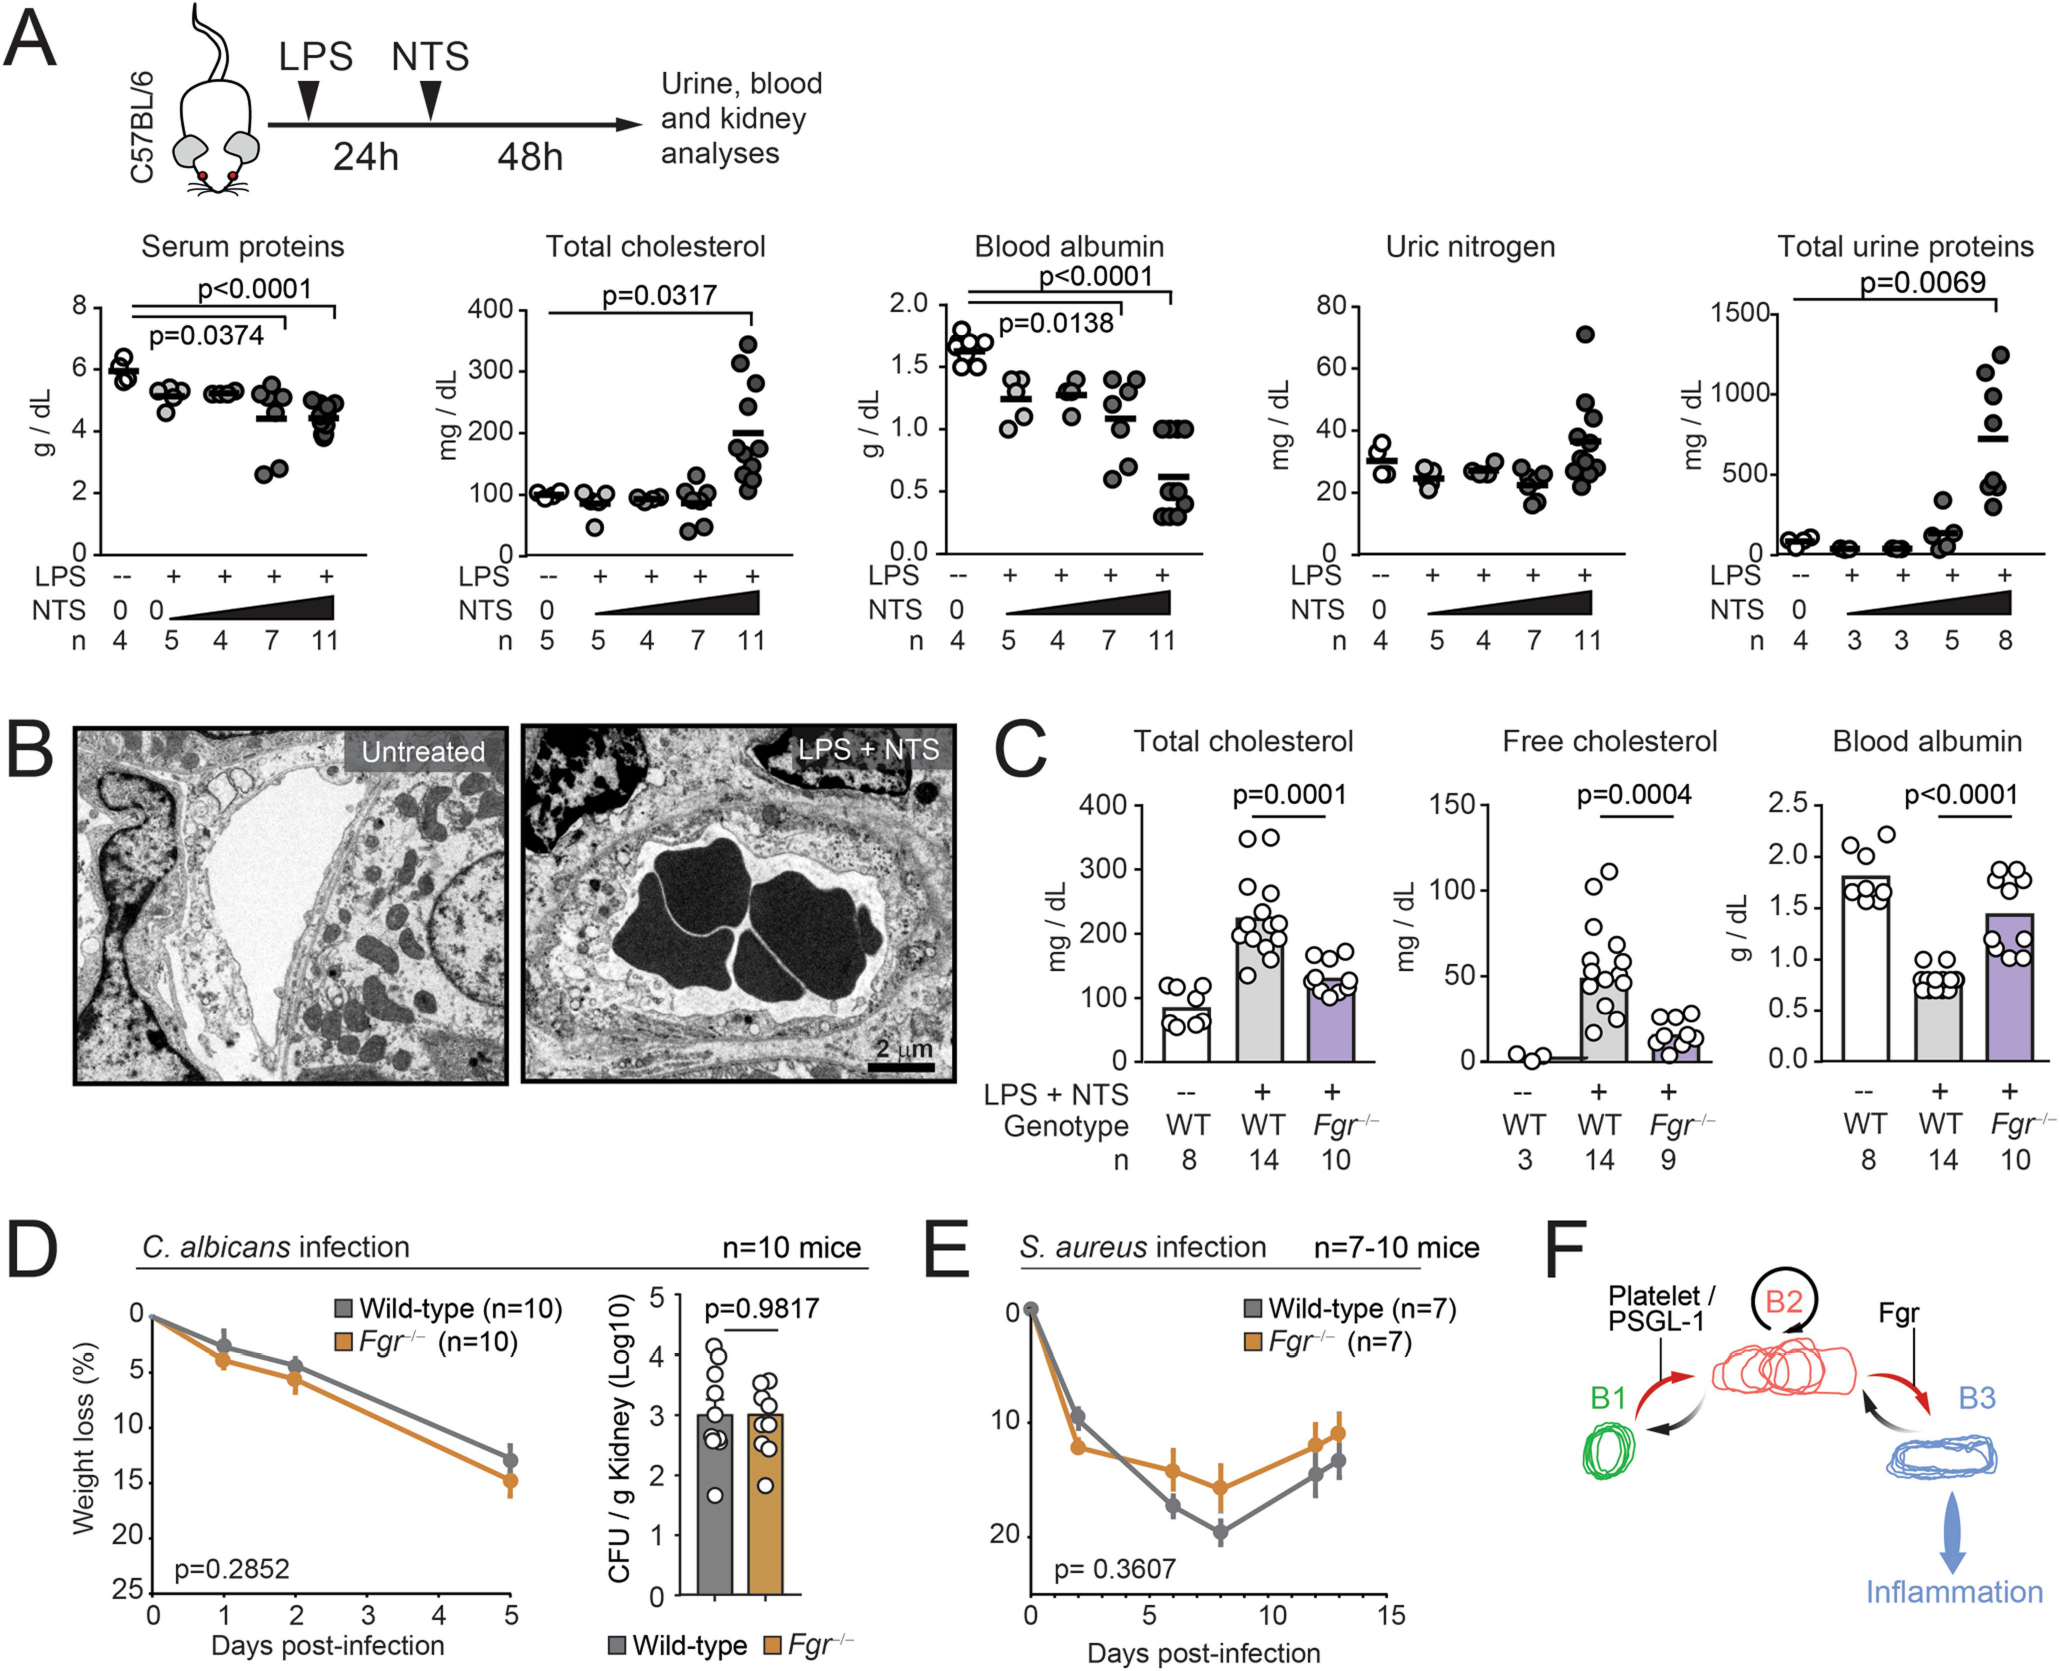
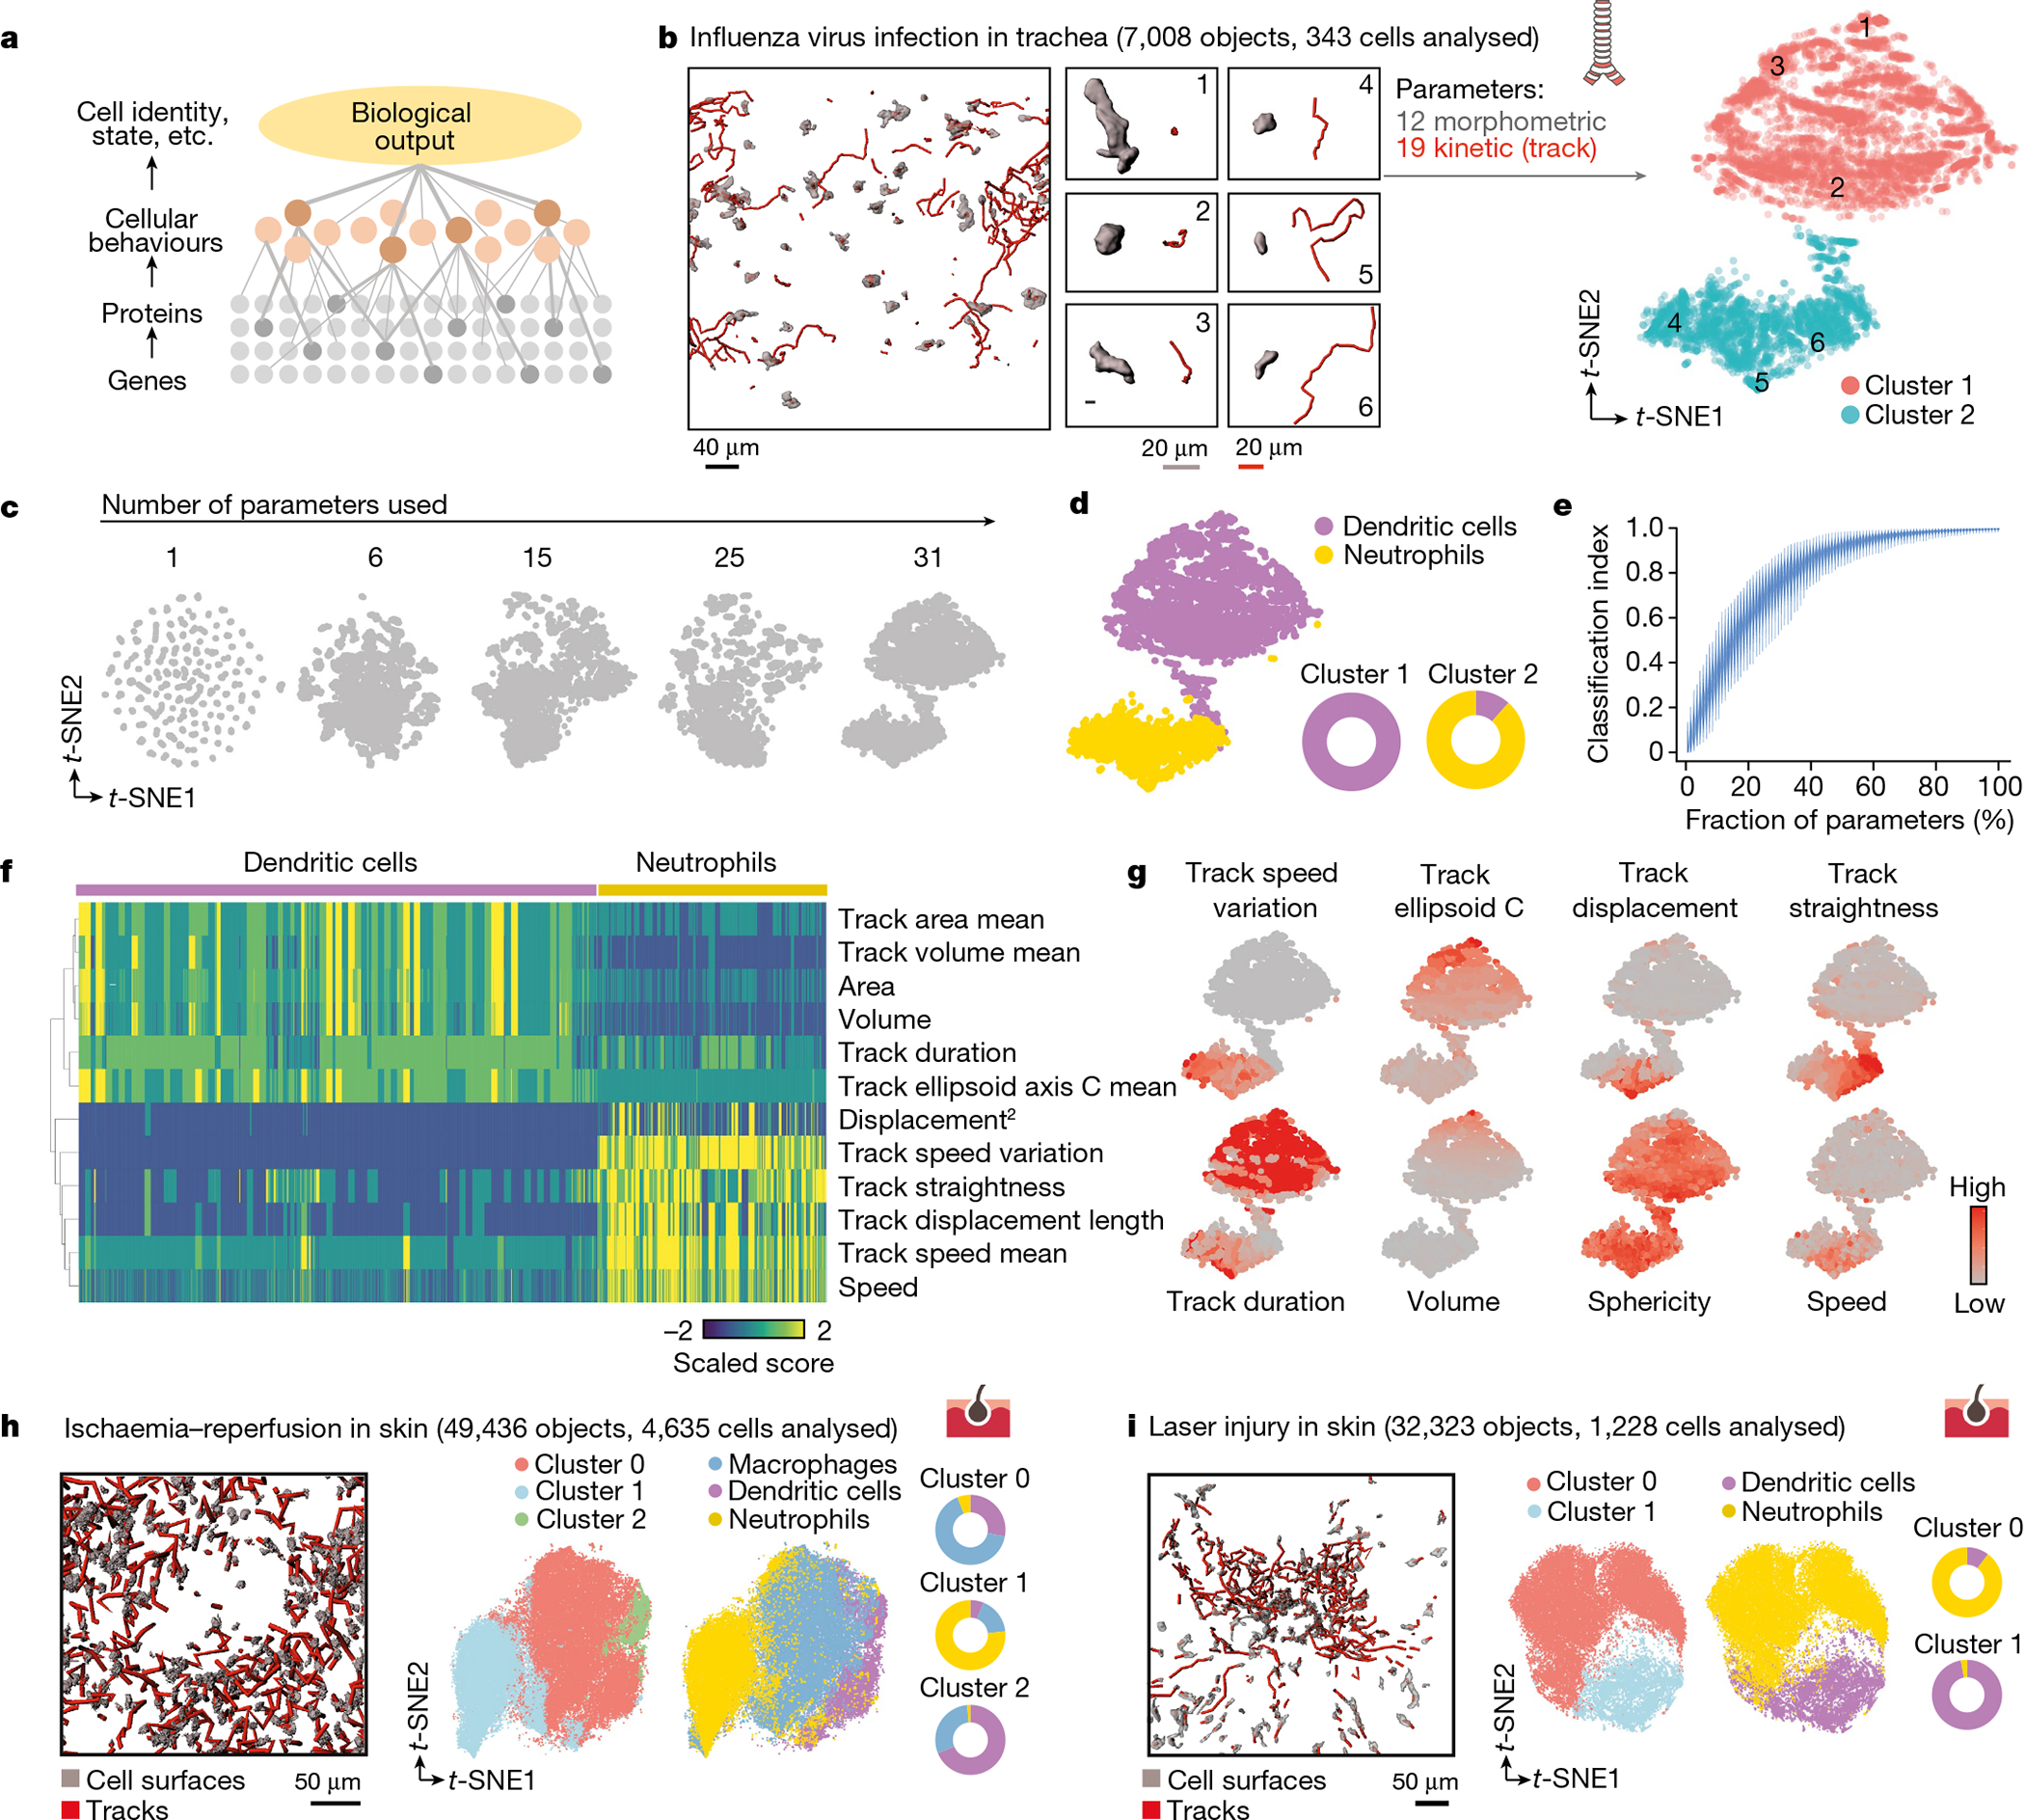
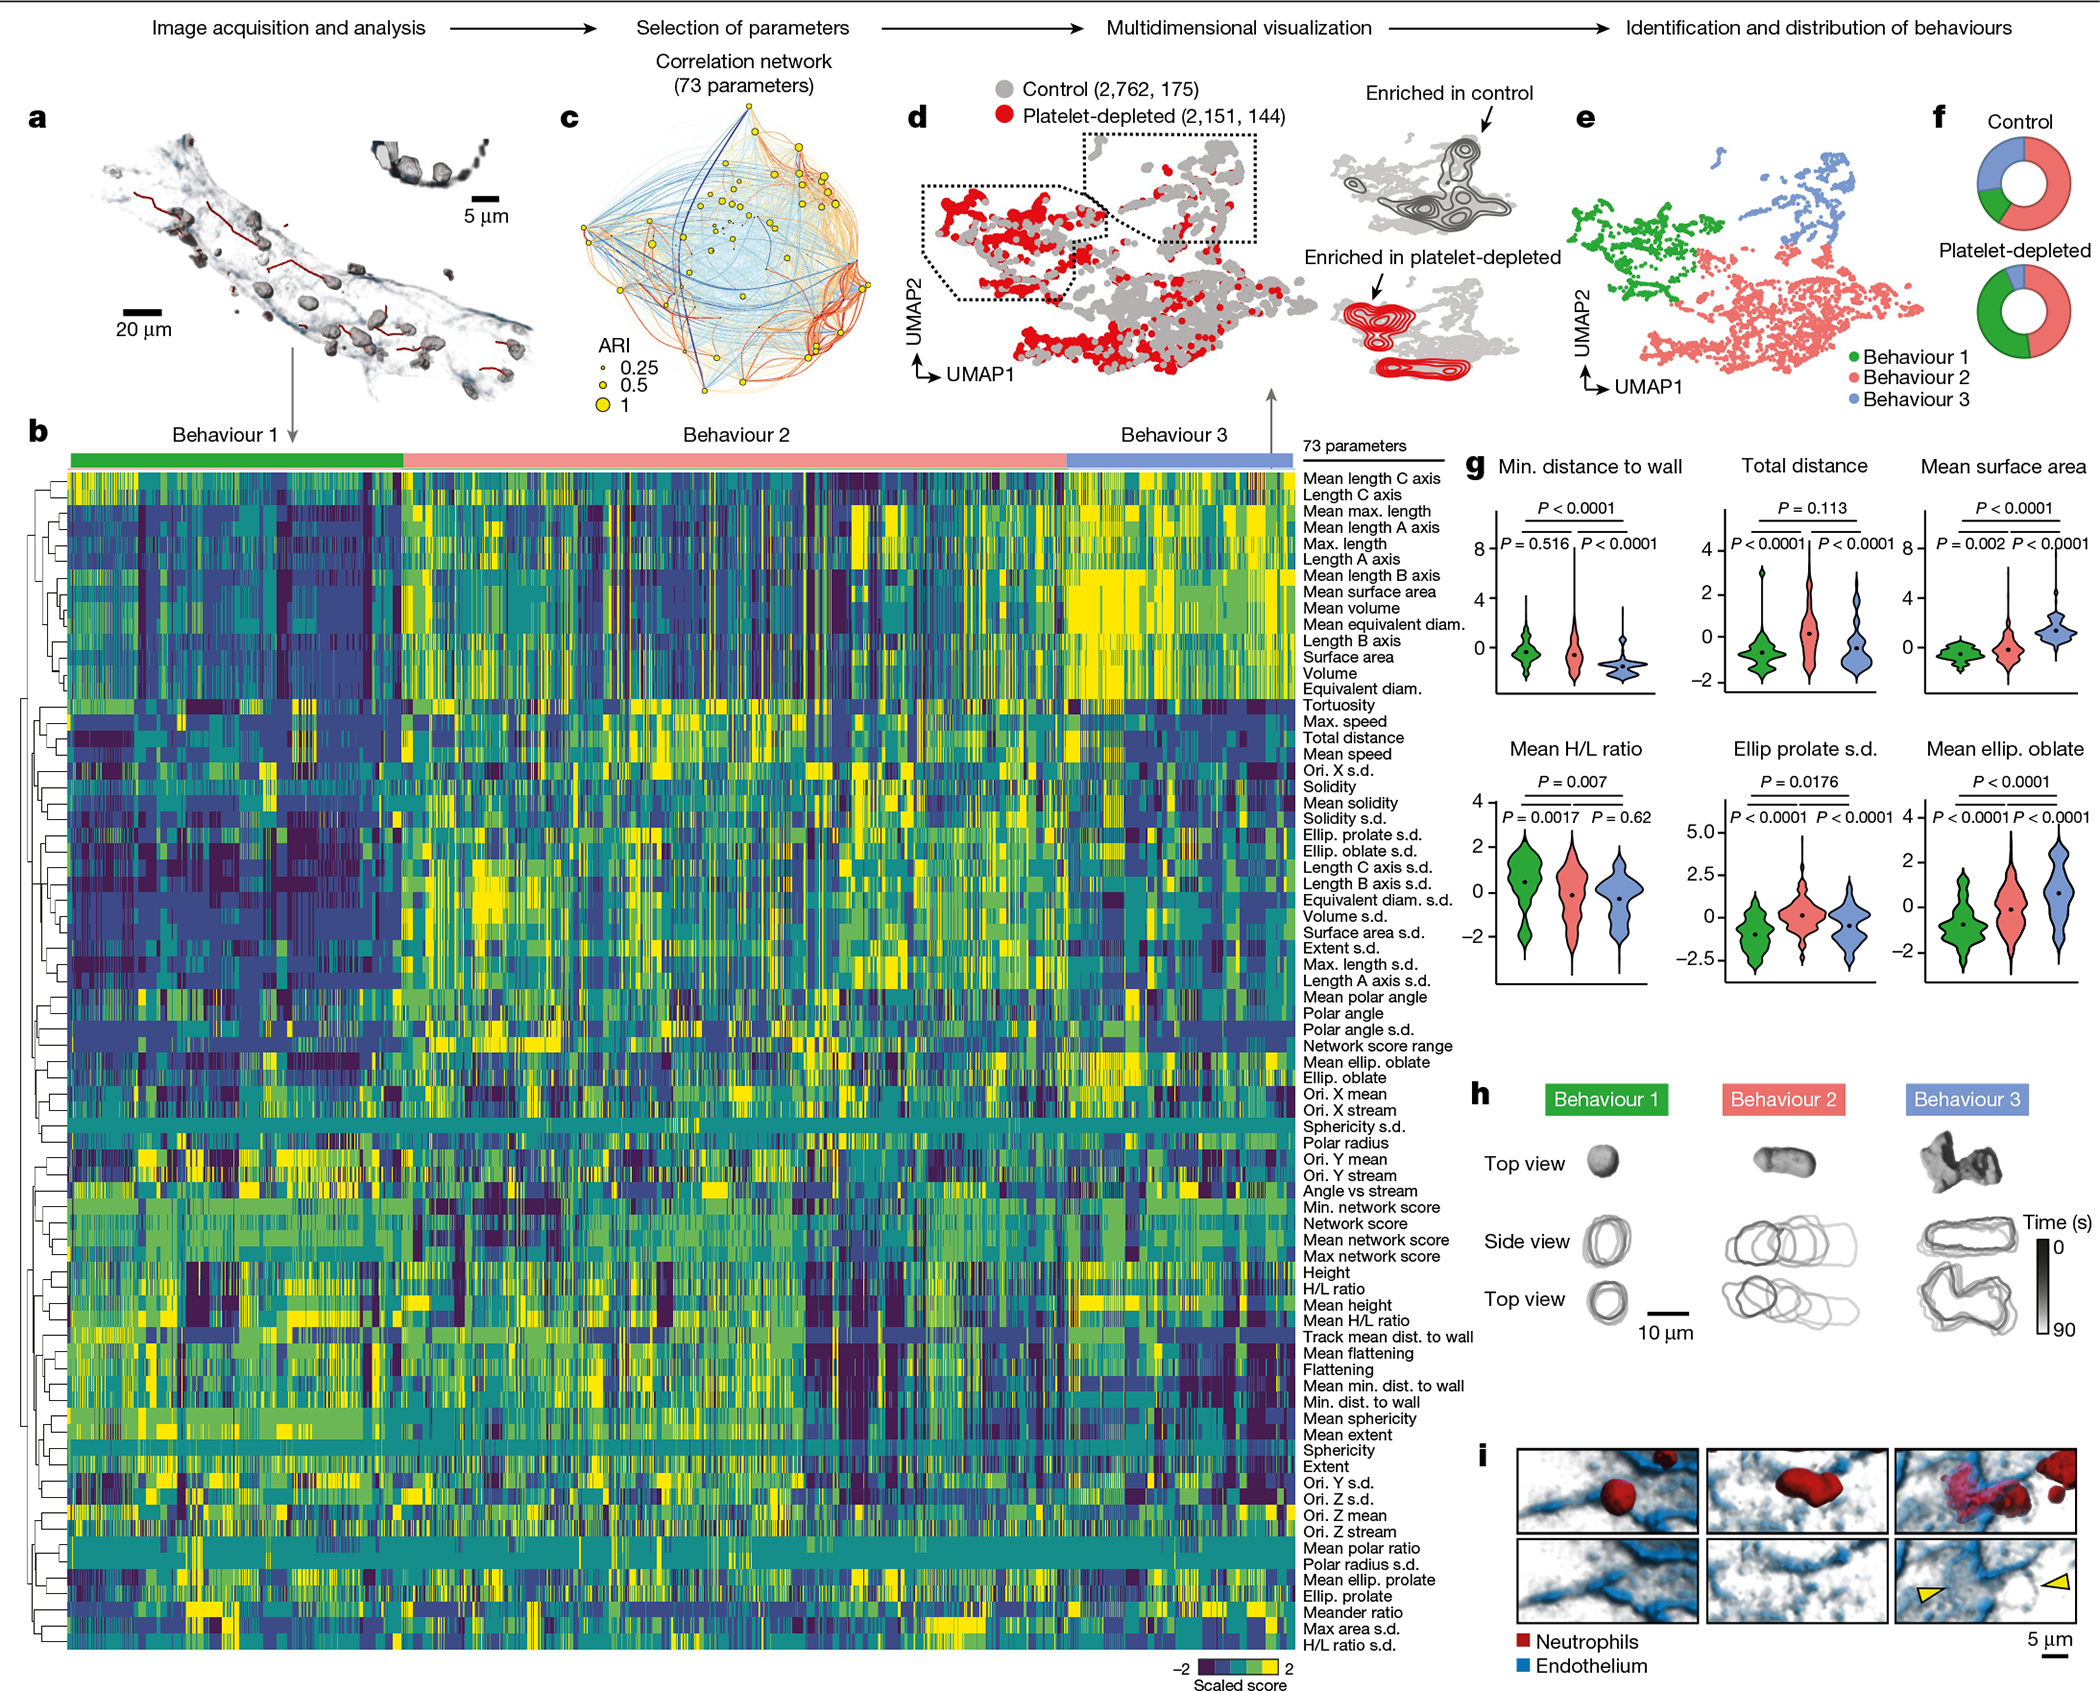
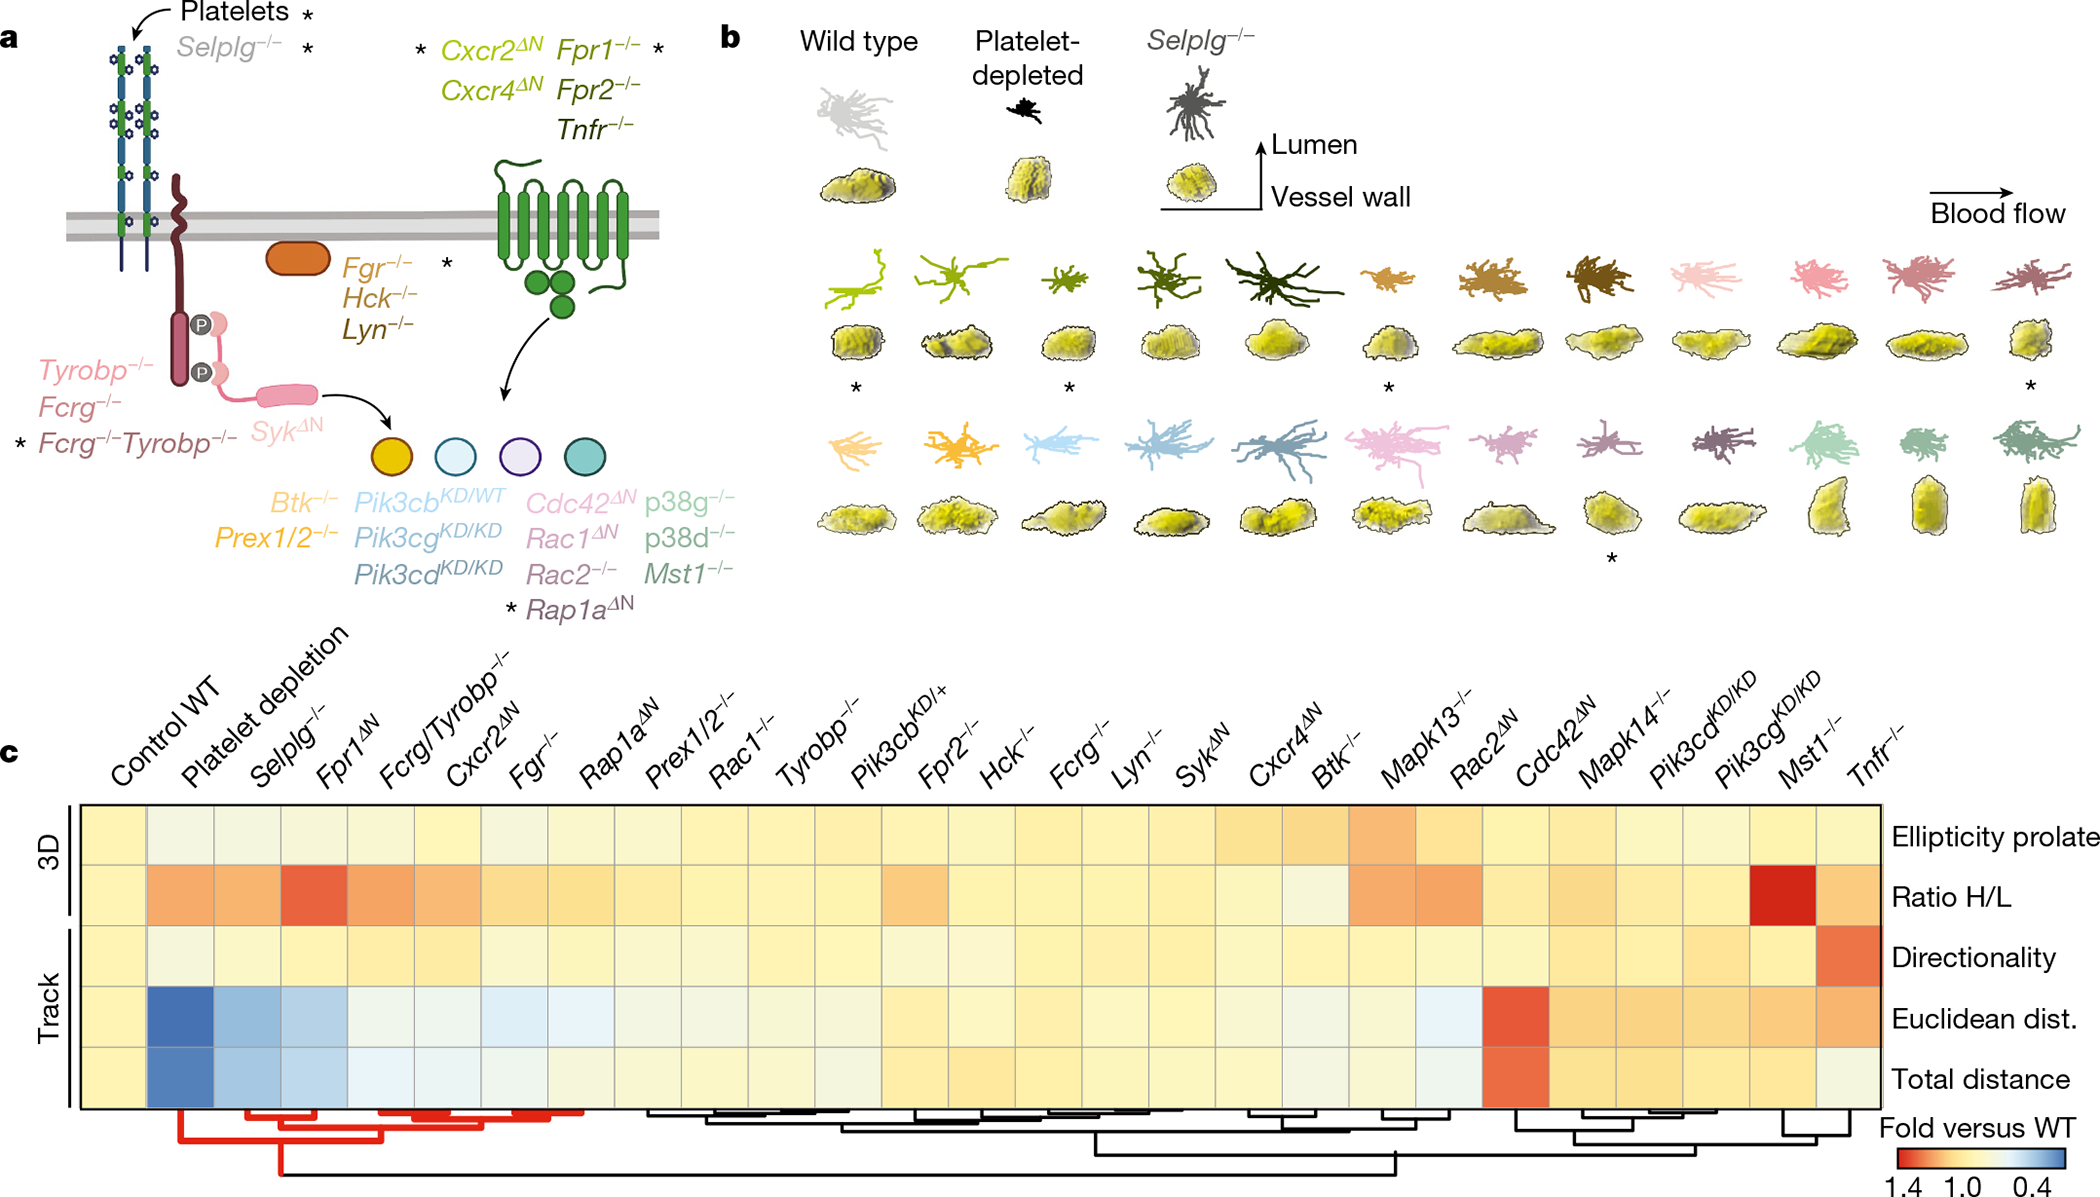
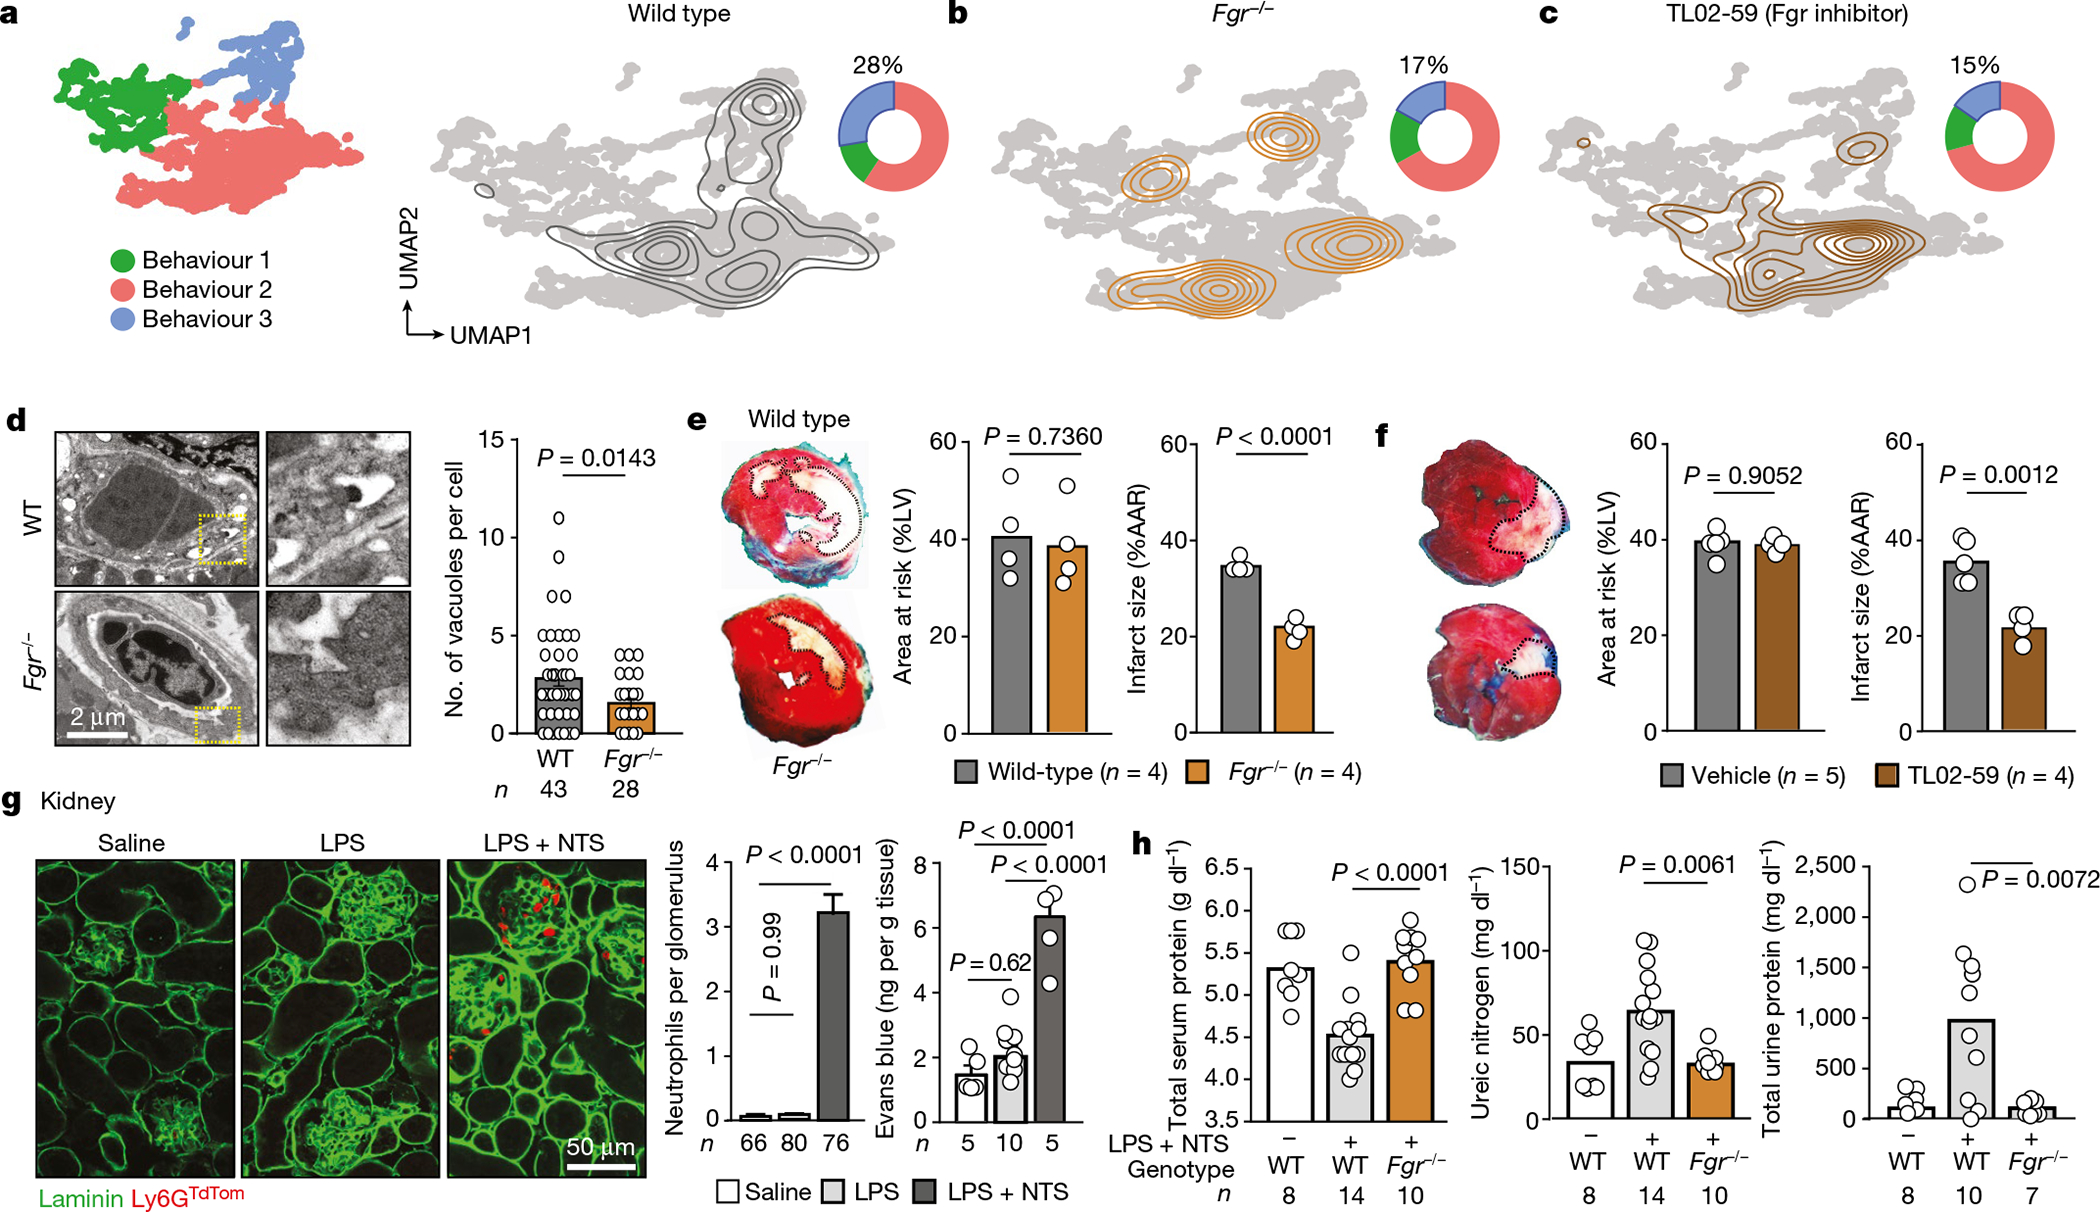
Transcriptional and proteomic profiling of individual cells have revolutionized interpretation of biological phenomena by providing cellular landscapes of healthy and diseased tissues1,2. These approaches, however, do not describe dynamic scenarios in which cells continuously change their biochemical properties and downstream 'behavioural' outputs3-5. Here we used 4D live imaging to record tens to hundreds of morpho-kinetic parameters describing the dynamics of individual leukocytes at sites of active inflammation. By analysing more than 100,000 reconstructions of cell shapes and tracks over time, we obtained behavioural descriptors of individual cells and used these high-dimensional datasets to build behavioural landscapes. These landscapes recognized leukocyte identities in the inflamed skin and trachea, and uncovered a continuum of neutrophil states inside blood vessels, including a large, sessile state that was embraced by the underlying endothelium and associated with pathogenic inflammation. Behavioural screening in 24 mouse mutants identified the kinase Fgr as a driver of this pathogenic state, and interference with Fgr protected mice from inflammatory injury. Thus, behavioural landscapes report distinct properties of dynamic environments at high cellular resolution.


Conflict of interest statement

Competing interests A.H. is a consultant for Flagship Pioneering. The other authors declare no competing interests.

Figures

Extended Data Fig. 1 |
Extended Data Fig. 1 |. Selection of parameters for behavioral analyses.
(A) Application of size filters. Left, representative images showing use of >40 voxel filter to eliminate subcellular objects in the trachea experiments. Comparison of the raw vs. surface reconstructed objects (see merged) eliminates fragment-like objects, as shown in the insets. Right, tSNE representation of the trachea dataset in which the filter for cell size was set to 0 (no filter) or 160 voxels, showing objects with sizes below 40 voxels (threshold used in our experiments). The number of objects for each representation are shown in brackets. Note that segregation of neutrophils and DCs into different visual clusters is compromised in the absence of filter. (B) Workflow for parameter selection. 4D images were analyzed to extract morphometric and kinetic parameters (118 in our experiments using Imaris software). We performed supervised selection of the best characteristics following criteria of redundancy, biological features of interest in the specific biological setup, or removal of non-biological parameters such as arbitrary position. In parallel we generated correlation networks for all parameters and each experiment (118 in the experiments reported here), and we visualized the distribution of the selected parameters in the correlation networks (see below). Finally, we reduced dimensionality using the selected parameters to identify behavioral clusters for further validation. For the “training” experiments shown here, where cell identities were known, we determined LRI/ARI to complement our correlation networks with the power of each parameter to classify cells correctly. The workflow is fully adaptable to other image analysis tools, as well as algorithms to establish correlation between parameters and for dimensional reduction, including elastic net regression methods. (C) Correlation networks used for the experiments shown in Fig. 1 with Imaris image analysis. Networks on the left column highlight the specific 31 parameters selected, which are identified by the number code shown in Supplementary Table 2. Correlation networks on the right column correspond to the three datasets shown in Fig. 1 (influenza infection in the trachea, ischemia-reperfusion in skin and laser injury in skin), showing parameters as circles whose diameters are proportional to their LRI, as well as the positive (red) and negative (blue) correlations between each pair of parameters. The thickness of the links is proportional to the absolute value of the Pearson correlation coefficient for each pair, and the distance between parameters reflect the similarity of the Pearson coefficients with the rest of parameters. (D) Violin plots showing LRI/ARI values for all 118 vs. the selected 31 parameters. Lines represent medians. Data compared by Mann-Whitney non-parametric test. (E) Heatmap showing the LRI/ARI values for each of the 31 selected parameters for each experiment, as well as the geometric mean for the three experiments combined, reflecting the average power of each parameter in our experiments. (F) Quality of parameter selection. Top, number of parameters selected, and predictive power (LRI or ARI in red) of the parameters selected by Lasso regression compared with our list of 31 selected parameters. Bottom, comparison of the distribution of the 25 parameters selected by Lasso regression and our 31 selected parameters across the correlation network for the trachea experiment. (G) tSNE plots generated by considering only the morphometric, or only the kinetic parameters, or both combined. Donut plots show the distribution of the analyzed cell types (macrophages, DCs and neutrophils) in each cluster. Note that the accuracy in identifying specific cell types for each cluster is always highest when both classes of parameters are combined. (H) tSNE plots generated by considering all 118 parameters or only the selected 31 across all three experimental setups (influenza infection in the trachea, ischemia-reperfusion in skin and laser injury in skin). Cell classification per cluster was better for the selected 31 parameters. (I) tSNE plots showing the classification of cells into clusters by using all 118 parameters and a standard single cell analytical pipeline (Seurat_v4). Donut plots indicate the distribution of the analyzed cell types (macrophages, DCs and neutrophils) in each cluster.
Extended Data Fig. 2 |
Extended Data Fig. 2 |. Behavioral landscape of the infected trachea.
(A) Heatmap of the 31 behavioral parameters used for the trachea infection analysis. For a full list of all extracted parameters please refer to Supplementary Table 2. (B) Pearson correlation matrix for all 118 parameters extracted from the trachea imaging experiment, with the selected parameters marked in red font. (C) Segmentation of cells from the trachea by four different combinations of morpho-kinetic parameters. We randomly chose 1, 6, 15, 25 and 31 parameters (list of parameter code numbers shown at right) and used them to represent the separation of neutrophils and DCs using tSNE. The original set of parameters used in Fig. 1c is at the top. Parameters are ordered from higher to lower LRI (left to right) to better visualize the classification value of each parameter used in the plot analyses. (D) LRI (score of cell identities) are proportional to the number of parameters extracted from the imaging experiments and combined to infer identities. Violin plots show the distribution of LRIs when using 1–5 parameters to classify cells in the trachea experiment, assuming that only sets of 5, 25, 31, 50 or 118 parameters are available for analysis. Note that the LRIs shown here are for the full 118 parameter set, and are not comparable with the 31 subset of selected parameters, which feature higher LRI values, as shown in the violin plots on the far right. (E) Individual analyses of the behavior of DCs and neutrophils from the original dataset, shown as tSNE plots for each population. Each behavioral parameter can be visualized and compared across cell subsets and parameters to infer positive or negative correlations, as shown for Distance to DC which negatively correlates with cell speeds in the Pearson correlation matrix of the 31 parameters used in the final analysis (F).
Extended Data Fig. 3 |
Extended Data Fig. 3 |. Behavioral landscape of the skin under ischemia-reperfusion.
(A) Representative image of I/R injury of the skin (original image on top; reconstruction of volumes and tracks at bottom). Below, examples of a typical GFPlo macrophage, a GFPhi neutrophil and an YFP+ DC used to classify the cells post-analysis. (B) Heatmap of all parameters and classified by cluster (0, 1 y 2) from the plot in Fig. 1h, and further divided into subclusters shown in (C). Below, expression plots of selected parameters. (C) tSNE plot showing all subclusters identified in the heatmap in (B). Donut plots indicate the fraction of neutrophils, DCs and macrophages in each cluster. Bottom panels show the behavioral maps generated by back-gating each cluster into the original position for each cell so that maps show the position of cells with the same behavioral profile.
Extended Data Fig. 4 |
Extended Data Fig. 4 |. Behavioral landscape of laser injury in the skin.
(A) Representative image of laser burn injury (original image left; reconstruction of volumes and tracks at right), (B) Heatmap of the all scored parameters, showing DCs and neutrophils. Expression tSNE plots of selected parameters are shown at bottom. (C) Individual analyses of the behavior of DCs and neutrophils from the original dataset, shown as tSNE plots for each population. Each behavioral parameter can be visualized and compared across cell subsets and parameters to infer random or gradient distribution for each population. For example, the location of the laser injury can be extracted as a parameter (left, yellow arrowhead) that shows graded behaviors of neutrophils relative to their distance to the wound, but not for DCs. (D) Examples of behavioral maps generated by projecting the intensity of specific parameters onto the XY location of individual cells at all time points. Actual image, plot-map by cell type and behavioral maps are shown. (E) Sub-clustering identifies two behavioral clusters of neutrophils and one for DCs (top), which were projected back onto their corresponding xyz position thus giving a profile of the distribution of behavioral clusters in the skin anatomy (middle). The neutrophil clusters feature differences in various parameters, as shown in the expression plots (arrowheads in the bottom tSNE plots). (F) Representative image of regulatory T cells (Treg) and cytotoxic T cells (CTL) in a CT26 carcinoma (red outline) in the skin, and tSNE plots of the cells classified by behavioral phenotype and by cell type. Donut plots show the match between both classifications. (G) Heatmap of the differentially scored parameters discriminating CTLs and Tregs. (HJ) Behavioral landscapes and maps of CTLs in carcinoma-bearing mice (H), neutrophils inside or outside inflamed vessels (I), and bone marrow neutrophils before and after administration of the mobilizing chemokine CXCL1 (J). Donut plots and expression plots illustrate the correlation between behavioral patterns or parameters and their localization in tissues. Dashed lines in the behavioral maps in (HI) delineate tumor-stroma or vessel-parenchyma borders, respectively. Data are from one experiment per condition to visualize the distribution of cells in a single anatomical area.
Extended Data Fig. 5 |
Extended Data Fig. 5 |. Neutrophil states inside inflamed venules.
(A) Analysis of the cremaster dataset using Imaris software and UMAP representation show less defined behavioral clusters than using ACME (compare with Fig. 2d–f). Donut plots show the distribution of clusters in control and platelet-depleted mice. (B) Anomalous morphometric reconstructions of fast rolling cells, shown in top and side 3D views of cells moving at different speeds. Firmly adherent B1 neutrophils are shown for reference. (C) Rapid changes in morphology for neutrophils in the B2 group, following inchworm-type crawling during a 90 s recording; scale bar, 10 μm. (D) Membrane extensions (yellow arrowheads) forming around large oblate neutrophils in the B3 group, but not from B1 or B2; scale bar, 5 μm. (E) Representative micrograph of an inflamed vessel from Ly6GCre; Rosa26tdTom mouse with several neutrophils exhibiting B2 and B3 behavioral profiles (arrowheads), and “footprints” beneath B3 cells; scale bar, 10 μm. The presence of the footprints for each behavior is quantified in (F), where n is number of neutrophils analyzed. (G) Micrographs and quantification of CD11b expression measured by in vivo imaging across the different behavioral groups, with rolling neutrophils included as reference cells; data is from the indicated number of cells (in brackets), from 6 mice per group. (H) Micrographs and quantification of the number of beads phagocytosed by neutrophils from each behavioral group, including rolling cells; n is the number of cells (in brackets) from 6 mice analyzed per group. Scale bar, 5 μm. (I) Representative 3D image of an inflamed cremaster vessel showing examples of B2 and B3 neutrophils (left image), which were examined for extravasation across the endothelial wall over time (arrowheads in insets, right). (J) Percent of B3-type neutrophils that localize in junctional vs. non-junctional areas, and (K) the frequency of transendothelial migration (TEM) for each behavioral group of neutrophils; n is 5 mice per group, with the indicated number of analyzed cells (brackets). All bar graphs show mean ± SEM and data were analyzed by one-way ANOVA with Tukey’s multigroup comparison test (H, K) or unpaired two-tailed t-test (J). Number of analyzed cells per group from 3–5 mice each are indicated in brackets.
Extended Data Fig. 6 |
Extended Data Fig. 6 |. Transitional states of neutrophils in vessels.
(A) Heatmap of all parameters across all behaviors, including the three sub-groups in B2. (B) UMAP based on hierarchical clustering to identify two additional behavioral clusters within B2. (C) Distribution of cells in each sub-cluster B2.1, B2.2 and B2.3 for the indicated parameters, showing for example that cells B2.3 feature sizes and distances to the vessel wall similar to those of B3. Data analyzed by one-way ANOVA. (D) Transitions between behavioral clusters shown graphically in the UMAP (left) and quantified at right. (E) Scheme illustrating the most common transitions typically involving passage through B2, suggesting that this is an obligate transitional stage for neutrophils in inflamed vessels. Drawings in each group represent the silhouettes of representative cells at different times as in Fig. 2h.
Extended Data Fig. 7 |
Extended Data Fig. 7 |. Track parameters in the behavioral screening.
(A) Heatmap of the differentially scored behaviors among the three main behavioral groups (B1, B2 and B3). Outlined in red are the specific behaviors chosen for our screening in Fig. 3. Note that “tortuosity” is an inverse measure of “directionality”, which was used in our screening. (B) Speed and directionality obtained by epifluorescence (2D) analysis of cremasteric venules in mice with mixed chimeric bone marrow of wild-typeDsRed and non-fluorescent mutant donors, which provided internal controls for each group. Thick lines show means; The number of analyzed cells per group is shown in brackets as (control, mutant), and were obtained from at least 3 mice per group. Data analyzed by unpaired two-tailed t-test.
Extended Data Fig. 8 |
Extended Data Fig. 8 |. Morphometric parameters in the behavioral screening.
Ellipticity prolate and H/L ratios measured for individual cells in static 3D reconstructions from 24 mutant and 3 control groups as summarized in Fig. 3. Values are from cremasteric venules in mice with mixed chimeric bone marrow of wild-typeDsRed and non-fluorescent mutant donors, which provided internal controls for each group. Thick lines show means; The number of analyzed cells per group is shown in brackets as (control, mutant), and were obtained from at least 3 mice per group. Data analyzed by unpaired two-tailed t-test analysis.
Extended Data Fig. 9 |
Extended Data Fig. 9 |. Protection from myocardial injury by targeting Fgr.
(A) Micrographs of NETs (positive for citH3 and MPO; red) and vessels (blue) in cremasteric venules of wild-type subjected or not to I/R, and Fgr−/− mice subjected to I/R. Right, quantification of NETs per tissue volume; Data shown as mean ± SEM and n are number of mice per group. (B) Competitive recruitment of wild-type and Fgr−/− neutrophils to the peritoneal cavity after zymosan injection, or to the bronchoalveolar space of lungs after LPS instillation in mixed chimeric mice; n are numbers of mice analyzed. Selplg−/− neutrophils are shown for comparison of impaired migration. Values are normalized to reference wild-type competitors across the different groups and given as migration efficiencies. Data shown as mean ± SEM and n are number of mice analyzed. (C) Micrographs of Weibel-Palade bodies (WPB) and vacuoles in myocardial vessels after sham or ischemic challenge, which are quantified in (D). These measures of vascular damage are dependent on neutrophils, as shown after experimental depletion with 1A8 antibody (E). Data shown as mean ± SEM, and n is the number of micrographs analyzed, from 2 mice. (F) Effect of the Fgr antagonist TL02–59 in myocardial death upon ischemia-reperfusion, when given after ischemia at the time of reperfusion. Micrographs of heart sections at left illustrate the protective effect on myocardial death (outlined whitish regions). Data are normalized to the area at risk (AAR) and shown as mean from 4 mice per group. (G) Combination of neutrophil depletion with 1A8 antibody, and Fgr deficiency in transplanted mice. The infarcted areas are normalized with the areas at risk; n is number of mice per group. (H) Combination of neutrophil depletion with the Fgr agonist TL02–59. Data shown as mean ± SEM; n are mice per group. (I) Combination of the Fgr inhibitor in hematopoietic Fgr−/− mice, with no effect in further protecting from myocardial death; n are mice per group. (J) Myocardial fibrosis (left ventricle) determined by hematoxylin and eosin staining in control wild-type and Fgr−/− mice subjected to permanent ischemia and analyzed after 28 days. The fibrosis area is represented at right; n are mice per group. All data from (A, B) was analyzed by one-way ANOVA with Tukey’s multiple comparison test; (GI) was analyzed by two-way ANOVA with Tukey’s multiple comparisons test. All other panels are compared by two-tailed unpaired-t test (C-F and J). The number of replicates (n) per group is indicated in each panel.
Extended Data Fig. 10 |
Extended Data Fig. 10 |. Protection from nephrotoxic injury by targeting Fgr.
(A) Schematic of the nephrotoxic injury model (top) and setup of conditions combining endotoxin (LPS) with increasing amounts of nephrotoxic serum (NTS), resulting in gradual increase in markers of kidney damage in serum and urine; n are number of mice per dose. (B) Transmission electron micrograph of kidney venules showing an example of intravascular occlusion in the NTS-treated mice, from 2 mice and 25–30 images analyzed. (C) Levels of the indicated metabolites in plasma of control and Fgr−/− mice before and after induction of glomerulonephritis with LPS plus NTS. The control group was treated with LPS only; n are mice analyzed per group. (DE) Mice reconstituted with marrow from wild-type or Fgr−/− donor mice were infected with C. albicans (D) or S. aureus (E) and infection progression was measured by weight loss, and in the case of C. albicans infection by scoring the fungal load in kidneys (CFU); n are mice analyzed per group and data in (A) was analyzed by unpaired t-test. For (DE) groups were compared by two-way ANOVA analyses for weight loss, and unpaired t-test for CFUs. Data in (C) was analyzed by one-way ANOVA with Tukey’s multiple comparisons test. (F) Scheme modeling neutrophil states, transitions, and delivery of inflammatory signals to the host tissues from B3 cells. Each transition is proposed to be caused by different signals, e.g. delivered by platelets and PSGL-1 for initial transition from B1 to B2, and via Fgr for transitions from B2 to B3. The number of replicates (n) per group is indicated in each panel.
Fig. 1 |
Fig. 1 |. Behavioural maps capture immune identities.
a, Flow of biological information. Cellular behaviours integrate information from the molecular background of cells and can be used to describe higher-order biological outputs at the single cell level. b, Representative 3D and track reconstructions of individual cells from images in tracheas of Cd11cYFP mice transferred with CFP+ neutrophils and infected with influenza. We obtained 31 morpho-kinetic parameters that we used to build bidimensional immune plots with the indicated number of cell-instances or total cells. Shown are six examples of cells and their location in the t-SNE plot (right). c, The accuracy of plots representing cell behaviours are a function of the number of parameters used for analysis. d, t-SNE plot reconstruction of the data in b from two independent experiments, showing the distribution of neutrophils and DCs as defined by driver gene expression (Methods). Doughnut plots indicate the accuracy of behaviours to score actual lineage identity. e, Qualitative stochastic model describing the change and variability in the level of knowledge of a biological system, here measured via a normalized classification index, as a function of the percentage of independent variables describing the system. f, Heat map of the differentially scored parameters for DCs and neutrophils. g, Expression t-SNE plots for the indicated parameters. h, i, Representative 3D tracks and reconstructions, as well as the corresponding t-SNE plots and donut plots, from images obtained in the skin during ischaemia–reperfusion (h), or the skin during laser-induced injury (i). The number of cells and all measured instances (objects) used in the analysis are indicated. Data are from three independent experiments for each model.
Fig. 2 |
Fig. 2 |. Behavioural landscape of intravascular inflammation.
a, Representative 3D and track reconstructions of leukocytes inside an inflamed venule. Inset shows a cross-section of the same vessel. b, Heat map of the dataset obtained for neutrophils inside inflamed venules and all 73 morpho-kinetic parameters, distributed for the three identified behavioural profiles (behaviours 1–3). c, Correlation network of the dataset, showing parameters as nodes (circles) whose diameters are proportional to their adjusted Rand index (ARI), with lines connecting pairs of parameters coloured according to positive (red) and negative (blue) correlations. The thicknesses of the links are proportional to the Pearson correlation coefficient for each pair. d, t-SNE representation of 4,913 temporal cell reconstructions (319 cells) from control and platelet-depleted mice. Density plots at right show the differential distribution of events for each group. Data are from at least four mice per group. e, f, Uniform manifold approximation and projection (UMAP) plot showing the three distinct behavioural clusters (labelled with colours) (e), and the distribution of cells in each cluster for the control and platelet-depleted groups (f). g, Violin plots for the indicated parameters across the three behavioural groups. Data were analysed using univariate multinomial model. h, Volumetric reconstruction of representative cells from behavioural clusters 1–3 (top) and temporal outlines (bottom). i, 3D reconstruction of the same cells shown in h, showing an endothelial footprint (arrowheads) only for the B3 cell. Diam., diameter; Dist., distance; Max., maximum; Min., minimum; Ellip., ellipticity; ori., orientation.
Fig. 3 |
Fig. 3 |. Screening for drivers of pathogenic intravascular behaviours.
a, Neutrophil signalling pathways, showing the genes analysed here. Control, platelet-depleted and Selplg−/− mice were used as reference groups in the screening. Asterisks denote mutants and conditions with behavioural changes similar to those in the reference groups. b, Representative 2D tracks and corresponding 3D morphologies for each condition and mutant, which are colour-coded to match the genes shown in a, including asterisks to mark the same mutants. c, Heat map of relative changes over control for the 5 selected behavioural parameters (right), for all 24 mutants and 3 reference groups, which were used as reference for protection from inflammation. Individual analyses and sample sizes are shown in Supplementary Figs. 7, 8. Hierarchical clustering identifies five mutant behaviours that group together with the reference groups (red lines below). Data are from 3,736 cells from at least 3 mice per group and type of analysis. Mapk13 encodes p38δ and Mapk14 encodes p38γ; WT, wild type.
Fig. 4 |
Fig. 4 |. Behavioural reprogramming protects from inflammation.
a, UMAP plot showing the distribution of the three behavioural groups (left), density plot for the wild-type control group layered over the global UMAP plot (right) and doughnut plot showing the distribution of cells among the three behavioural clusters. b, c, Similar UMAP and doughnut plots to those in a were built for mice reconstituted with Fgr−/− bone marrow (b) or treated with the Fgr inhibitor TL02–59 (c). Note the shift of cells away from B3 after interfering with Fgr. Numbers in doughnut plots indicate the percentage of cells in B3. d, Vascular damage during myocardial ischaemia–reperfusion determined by vacuolation of endothelial cells in hearts, from images obtained by transmission electron micrographs and quantified right; n is the number of vascular sections analysed. e, f, Protection from myocardial injury in Fgr−/− mice (e) or wild-type mice treated with the inhibitor TL02–59 (f) after normalization to the areas at risk. The dead myocardial area is outlined in white in the heart sections; n is the number of mice analysed. g, Glomerulonephritis model. Left, immunofluorescence of kidney tissue showing accumulation of neutrophils in glomeruli after injury induced by lipopolysaccharide (LPS) and nephrotoxic serum (NTS). Right, quantification of neutrophils accumulated per glomerulus; n is the number glomeruli analysed. Data are mean ± s.e.m. Right, vascular damage measured by Evans blue extravasation; n is the number of mice. h, Analysis of serum and urine in control and glomerulonephritis-induced wild-type and Fgr−/− reconstituted mice. All data are means and were analysed by two-tailed unpaired t-test (d–f), or one-way ANOVA with Tukey’s multiple comparison test (g, h). The number of replicates per group (n) is indicated in each panel.

References

    1. Kwok I et al. Combinatorial single-cell analyses of granulocyte–monocyte progenitor heterogeneity reveals an early uni-potent neutrophil progenitor. Immunity 53, 303–318. e5 (2020). - PubMed
    1. Amit I, Regev A & Hacohen N Strategies to discover regulatory circuits of the mammalian immune system. Nat. Rev. Immunol. 11, 873–880 (2011). - PMC - PubMed
    1. Lämmermann T et al. Neutrophil swarms require LTB4 and integrins at sites of cell death in vivo. Nature 498, 371–375 (2013). - PMC - PubMed
    1. Sreeramkumar V et al. Neutrophils scan for activated platelets to initiate inflammation. Science 346, 1234–1238 (2014). - PMC - PubMed
    1. Woodfin A et al. The junctional adhesion molecule JAM-C regulates polarized transendothelial migration of neutrophils in vivo. Nat. Immunol. 12, 761–769 (2011). - PMC - PubMed

Publication types

Substances

LinkOut - more resources