. 2022 Jan;601(7893):422-427.
doi: 10.1038/s41586-021-04249-w. Epub 2022 Jan 5.

RNA profiles reveal signatures of future health and disease in pregnancy

Affiliations

RNA profiles reveal signatures of future health and disease in pregnancy

Morten Rasmussen et al. Nature. 2022 Jan.

Abstract

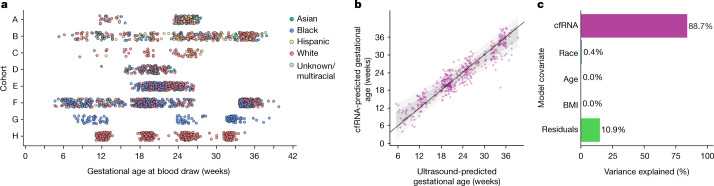
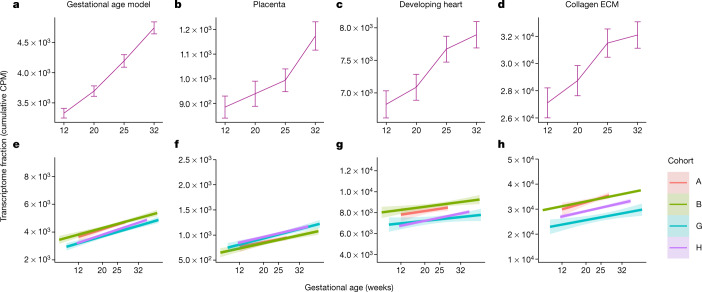
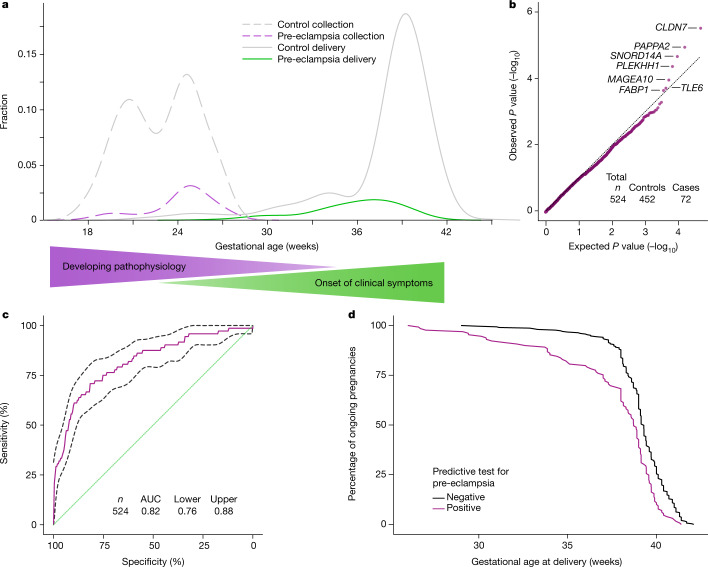
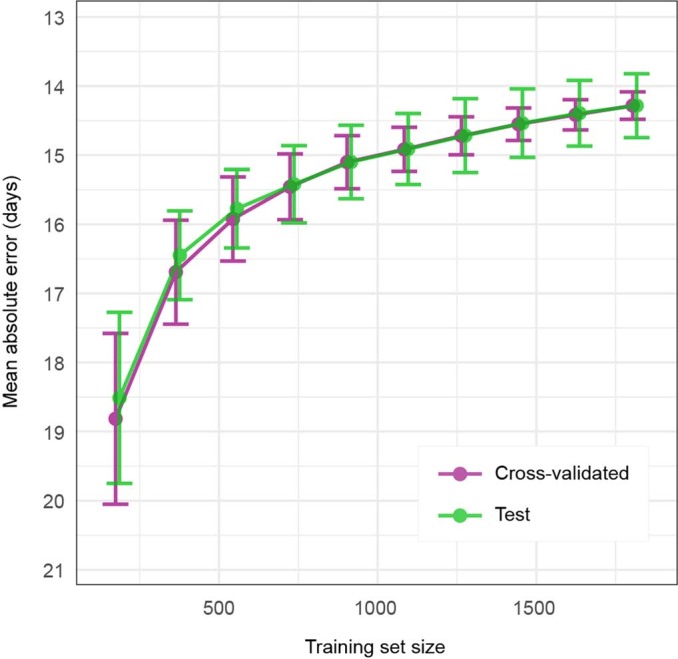
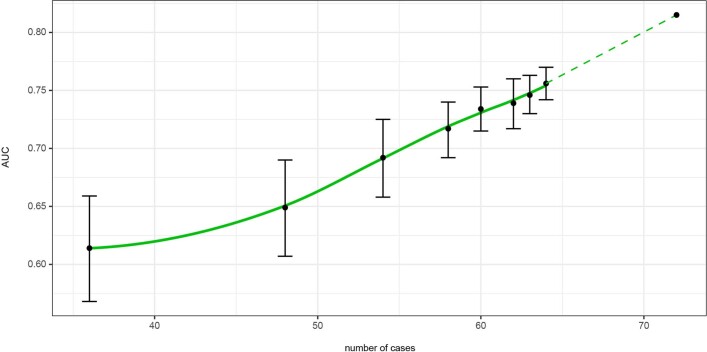
Maternal morbidity and mortality continue to rise, and pre-eclampsia is a major driver of this burden1. Yet the ability to assess underlying pathophysiology before clinical presentation to enable identification of pregnancies at risk remains elusive. Here we demonstrate the ability of plasma cell-free RNA (cfRNA) to reveal patterns of normal pregnancy progression and determine the risk of developing pre-eclampsia months before clinical presentation. Our results centre on comprehensive transcriptome data from eight independent prospectively collected cohorts comprising 1,840 racially diverse pregnancies and retrospective analysis of 2,539 banked plasma samples. The pre-eclampsia data include 524 samples (72 cases and 452 non-cases) from two diverse independent cohorts collected 14.5 weeks (s.d., 4.5 weeks) before delivery. We show that cfRNA signatures from a single blood draw can track pregnancy progression at the placental, maternal and fetal levels and can robustly predict pre-eclampsia, with a sensitivity of 75% and a positive predictive value of 32.3% (s.d., 3%), which is superior to the state-of-the-art method2. cfRNA signatures of normal pregnancy progression and pre-eclampsia are independent of clinical factors, such as maternal age, body mass index and race, which cumulatively account for less than 1% of model variance. Further, the cfRNA signature for pre-eclampsia contains gene features linked to biological processes implicated in the underlying pathophysiology of pre-eclampsia.


Conflict of interest statement

M. Rasmussen, M. Reddy, R.N., J.C.-S., A.K., T.B., F.S., M.T., E.P.S.G., J.L., M.L., E.N., M.J., M.A.E., M.D., S.R.Q. and T.M. have an equity interest in Mirvie. All cohort contributors were compensated for sample collection and/or shipping. T.M. serves on the scientific advisory board for Mirvie, NxPrenatal, Momenta Pharmaceuticals and Hoffmann–La Roche. M. Rasmussen, M. Reddy, R.N., J.C.-S., A.K., T.B., F.S., M.T., E.P.S.G., J.L., M.L., E.N., M.J., M.A.E., S.R.Q., M.K.S. and D.A.S. are inventors on patent applications (US20170145509A1, US9937182B2 and EP2954324A1) that cover the detection, diagnosis or treatment of pregnancy complications.

Figures

Fig. 1
Fig. 1. Overview of plasma sampling and cohorts and gestational age modelling.
a, Cohorts are labelled A–H (Table 1). Circles represent plasma samples from liquid biopsies (n = 2,539). Colours represent the race of the maternal donor. b, Model predictions from the hold-out test (n = 474) using cfRNA transcript data in the Lasso linear model versus ultrasound-predicted gestational age. The dark grey zone represents 1 s.d., and the light grey zone represents 2 s.d. c, Variance explained from ANOVA.
Fig. 2
Fig. 2. Temporal profiles of pregnancy pathways for gene sets from the gestational age model and independently identified gene sets for placenta, developing fetal heart and collagen extracellular matrix known to be involved in uterus and cervix growth over gestation.
ad, Maternal plasma transcriptome fractions for gene sets averaged across all samples in each collection window. Gestational age model (a), placenta (b), developing heart (c) and collagen extracellular matrix (ECM) (d). Error bars correspond to the 95% confidence interval around the mean. CPM, counts per million. n = 93 for each time point and gene set. eh, Signal across all cohorts with longitudinal data: gestational age model (e), placenta (f), developing heart (g) and collagen ECM (h). Linear fits are shown of transcriptome fractions for all samples across corresponding gestational ages recorded at collection times. The band around the solid line corresponds to the 95% confidence interval. All slopes for the gestational age coefficients are distinct from 0 at a confidence level of 0.05. Cohort is indicated by colour.
Fig. 3
Fig. 3. Features and model performance for prediction of pre-eclampsia.
a, Sample collection time (dashed lines) and delivery time (solid lines) for women with pre-eclampsia (purple and green) and controls (grey). Gradients illustrate timelines for developing pathophysiology and onset of clinical symptoms. b, Quantile–quantile plot of ranked Spearman P values for women with pre-eclampsia (cases) versus controls. P values were calculated from Spearman correlation on cohort-corrected data for each gene. The genes used in the model are labelled. The black dotted line represents the expectation. c, Receiver operating characteristic curve (mean and 95% confidence interval) for the logistic regression model for pre-eclampsia (n = 524). d, Kaplan–Meier curves of deliveries in test-positive and test-negative populations (n = 439), excluding spontaneous preterm deliveries.
Extended Data Fig. 1
Extended Data Fig. 1. Temporal profiles of pregnancy-related endocrine signatures during pregnancy.
Seven pregnancy-related gene ontology term signatures identified as highly significantly enriched (α=0.01) were profiled across collection times using cumulative CPM. Plasma transcriptome fractions for each gene set were averaged across all samples in each collection window with error bars corresponding to the 95% confidence interval around the mean. Panels correspond to different ranges of CPM, for the ease of comparison. CPM, counts per million. N=93 for each timepoint and gene set.
Extended Data Fig. 2
Extended Data Fig. 2. Temporal profiles of fetal gene sets from developing kidney and gastrointestinal tract.
a-c, Maternal plasma transcriptome fractions for gene sets averaged across all samples in a given collection window. Error bars correspond to the 95% confidence interval around the mean. CPM, counts per million. N=93 for each timepoint and gene set. d-f, signal across all cohorts with longitudinal data. Linear fits of transcriptome fractions for all samples across corresponding gestational ages recorded at the collection times. The band around the solid line corresponds to the 95% CI. All slopes for the gestational age coefficient are distinct from 0 at a confidence level of 0.05. Cohort is indicated by color.
Extended Data Fig. 3
Extended Data Fig. 3. Bootstrapping with and without time-scrambling.
a-d, for each of the significantly enriched gene sets, the trends were evaluated by bootstrapping (B=1,000) the original data (blue lines) and time-scrambled data (grey lines) obtained by reshuffling collection times.
Extended Data Fig. 4
Extended Data Fig. 4. Gene set enrichment analysis of preeclampsia for gene ontology (GO) gene sets.
a, Top-20 significantly upregulated gene sets. b, Top-20 significantly downregulated gene sets. Color gradient for adjusted p-value. NES, absolute normalized enrichment score.
Extended Data Figure 5
Extended Data Figure 5. Effect of correcting for total count and cohort.
Counts for ACTB as a function of total counts for the sample before (a) and after (b) correction. Counts for CAPN6 as a function of gestational age for all samples used in the gestational age model before (c) and after (d) cohort correction. Plot of first two principal components before (e) and after (f) cohort correction.
Extended Data Fig. 6
Extended Data Fig. 6. Learning curve for gestational age model.
Model for gestational age is trained with increasing sample size, error is plotted for both training set (Cross-validated, purple) and held-out test set (green). Error bars are 1 standard deviation.
Extended Data Fig. 7
Extended Data Fig. 7. Learning curve for preeclampsia model.
Model performance as a function of training set size. Error bars are 1 standard deviation.

Comment in

References

    1. Rich-Edwards JW, Fraser A, Lawlor DA, Catov JM. Pregnancy characteristics and women’s future cardiovascular health: an underused opportunity to improve women’s health? Epidemiol. Rev. 2014;36:57–70. doi: 10.1093/epirev/mxt006. - DOI - PMC - PubMed
    1. Tan MY, et al. Screening for pre-eclampsia by maternal factors and biomarkers at 11–13 weeks’ gestation: first-trimester PE screening. Ultrasound Obstet. Gynecol. 2018;52:186–195. doi: 10.1002/uog.19112. - DOI - PubMed
    1. Marinić M, Lynch VJ. Relaxed constraint and functional divergence of the progesterone receptor (PGR) in the human stem-lineage. PLoS Genet. 2020;16:e1008666. doi: 10.1371/journal.pgen.1008666. - DOI - PMC - PubMed
    1. Robillard P-Y, Dekker GA, Hulsey TC. Evolutionary adaptations to pre-eclampsia/eclampsia in humans: low fecundability rate, loss of oestrus, prohibitions of incest and systematic polyandry. Am. J. Reprod. Immunol. 2002;47:104–111. doi: 10.1034/j.1600-0897.2002.1o043.x. - DOI - PubMed
    1. McCarthy FP, Kingdom JC, Kenny LC, Walsh SK. Animal models of preeclampsia; uses and limitations. Placenta. 2011;32:413–419. doi: 10.1016/j.placenta.2011.03.010. - DOI - PubMed

Publication types