. 2021 Dec 16:13:632217.
doi: 10.3389/fnagi.2021.632217. eCollection 2021.

Lesion Distribution and Early Changes of Right Hemisphere in Chinese Patients With Post-stroke Aphasia

Affiliations

Lesion Distribution and Early Changes of Right Hemisphere in Chinese Patients With Post-stroke Aphasia

Ruiwen Fan et al. Front Aging Neurosci. .

Abstract

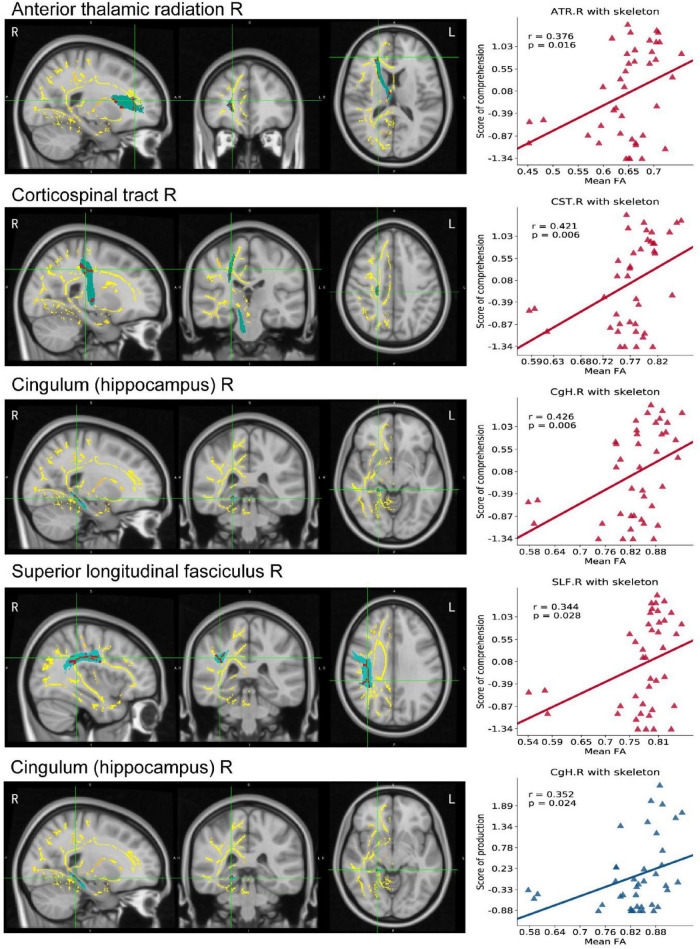
The role of the right hemisphere (RH) in post-stroke aphasia (PSA) has not been completely understood. In general, the language alterations in PSA are normally evaluated from the perspective of the language processing models developed from Western languages such as English. However, the successful application of the models for assessing Chinese-language functions in patients with PSA has not been reported. In this study, the features of specific language-related lesion distribution and early variations of structure in RH in Chinese patients with PSA were investigated. Forty-two aphasic patients (female: 13, male: 29, mean age: 58 ± 12 years) with left hemisphere (LH) injury between 1 and 6 months after stroke were included. The morphological characteristics, both at the levels of gray matter (GM) and white matter (WM), were quantified by 3T multiparametric brain MRI. The Fridriksson et al.'s dual-stream model was used to compare language-related lesion regions. Voxel-based lesion-symptom mapping (VLSM) analysis has been performed. Our results showed that lesions in the precentral, superior frontal, middle frontal, and postcentral gyri were responsible for both the production and comprehension dysfunction of Chinese patients with PSA and were quite different from the lesions described by using the dual-stream model of Fridriksson et al. Furthermore, gray matter volume (GMV) was found significantly decreased in RH, and WM integrity was disturbed in RH after LH injury in Chinese patients with PSA. The different lesion patterns between Chinese patients with PSA and English-speaking patients with PSA may indicate that the dual-stream model of Fridriksson et al. is not suitable for the assessment of Chinese-language functions in Chinese patients with PSA in subacute phase of recovery. Moreover, decreased structural integrity in RH was found in Chinese patients with PSA.

Keywords: MRI; aphasia; language; right hemisphere; stroke; structural covariation.


Conflict of interest statement

The authors declare that the research was conducted in the absence of any commercial or financial relationships that could be construed as a potential conflict of interest.

Figures

FIGURE 1
FIGURE 1
Overview of the study design.
FIGURE 2
FIGURE 2
Distribution of lesion in LH. (A) The lesion area overlap across patients was rendered on a brain template. The color bar represents the number of patients with damage in each voxel. Numbers on top of each axial map refer to the z-plane of the MNI space, respectively. (B) Distribution of the lesion volume across the patients. The average lesion volume was 27.64 ml. L, left hemisphere; R, right hemisphere.
FIGURE 3
FIGURE 3
Lesion areas related to linguistic score. (A,C) A negative correlation was found between gray matter volume and production in the left frontoparietal cortex (cluster size = 894, peak coordinates: x = –28, y = –16, z = 50, t = 3.74, Benjamini–Hochberg correction) and between comprehension in parietal cortex and insula gyrus (cluster size = 1,046, peak coordinates: x = –26, y = –26, z = 48, t = 4.41, Benjamini–Hochberg correction). Numbers on top of each axial map refer to the z-plane of the MNI space. (B,D) Scatter plot showing partial regression using language scores as the dependent measure and gray matter extractions of cluster as the independent measure. These correlations did not differ significantly after controlling for covariates of no interest such as age, gender, the level of education, and handedness. (E) The overlap rates of language-related lesions (yellow), with dorsal pathway (blue) and ventral pathway (pink) of 57.72% (57.72% of all production-related lesions located in the dorsal pathway) and 0.48% (0.48% of all comprehension-related lesions located in the ventral pathway), respectively. Rate = overlapping part with dual-stream/lesion areas.
FIGURE 4
FIGURE 4
Decreased GMV in the right hemisphere. (A) The GMV in RH of PSA group was significantly lower than that of HC group. (B,C) The maps illustrate results of structural covariance analysis between language-related lesions and significantly decreased GM in RH. The color represents the size of r value. ROL, rolandic oper; ORBsupmed, superior frontal gyrus (medial orbital); MTG, middle temporal gyrus; TPOmid, temporal pole, middle temporal gyrus; ITG, inferior temporal gyrus; PreCG, precentral gyrus; SFGdor, superior frontal gyrus (dorsolateral); MFG, middle frontal gyrus; INS, insula; PoCG, postcentral gyrus; IPL, inferior parietal. Letters L and R in (C) correspond to the left and right hemispheres, respectively. ***p < 0.001.
FIGURE 5
FIGURE 5
TBSS map in RH of PSA related to linguistic score. The mean FA template produced by TBSS pipeline, overlaid (axial, coronal, and sagittal view) with the skeleton generated using an FA threshold of 0.2. We do TBSS analysis in RH searching for the differences between the PSA group and the HC group (p < 0.05, TFCE-corrected). Red areas indicate regions with significantly reduced FA values in the PSA group compared with HC. Scatter maps represent ROI areas significantly related to the comprehension (red) or production (blue). FA, fractional anisotropy; TBSS, Tract-Based Spatial Statistics; TFCE, threshold-free cluster enhancement.
FIGURE 6
FIGURE 6
White fiber connecting reduced GM regions in RH. (A) All structural covariant regions (pink) in RH and WM fibers cross them are tracked by deterministic tracking. The scatter plots showed correlations between FA/MD and GMV. (B) The bar plot displays the voxel number of WM constructed from fiber tracing overlapped with Johns Hopkins University (JHU) WM atlas. (C) Box plots present differences in WM indexes between healthy people and patients. F6A is a schematic diagram of the fiber tracking. The purple area indicates the differences in the right hemisphere area between the healthy control group and the patient with PSA group. F6B represents the overlap between the fiber skeleton obtained by fiber tracking and the area defined by the WM template, which is used to determine the spatial position of the fiber. F6C represents the difference between FN and FA between the healthy control group and the patient with PSA group. ROL, rolandic oper; ORBsupmed, superior frontal gyrus (medial orbital); MTG, middle temporal gyrus; TPOmid, temporal pole middle temporal gyrus; ITG, inferior temporal gyrus; ILF, inferior longitudinal fasciculus; SLF, superior longitudinal fasciculus; FMi, forceps minor; Unc, uncinate fasciculus; IFO, inferior fronto-occipital fasciculus; tSLF, superior longitudinal fasciculus (temporal part); FA, fractional anisotropy; FN, fiber number. *p < 0.05.

References

    1. Abo M., Senoo A., Watanabe S., Miyano S., Doseki K., Sasaki N., et al. (2004). Language-related brain function during word repetition in post-stroke aphasics. Neuroreport 15 1891–1894. 10.1097/00001756-200408260-00011 - DOI - PubMed
    1. Anglade C., Thiel A., Ansaldo A. I. (2014). The complementary role of the cerebral hemispheres in recovery from aphasia after stroke: a critical review of literature. Brain Inj. 28 138–145. 10.3109/02699052.2013.859734 - DOI - PubMed
    1. Balter M. (2006). Bruce Lahn profile. Links between brain genes, evolution, and cognition challenged. Science 314 1872. 10.1126/science.314.5807.1872 - DOI - PubMed
    1. Barlow T. (1877). On a Case of Double Hemiplegia, with Cerebral Symmetrical Lesions. Br Med J. 2 103–104. 10.1136/bmj.2.865.103 - DOI - PMC - PubMed
    1. Bates E., Wilson S. M., Saygin A. P., Dick F., Sereno M. I., Knight R. T., et al. (2003). Voxel-based lesion-symptom mapping. Nat. Neurosci. 6, 448–450. 10.1038/nn1050 - DOI - PubMed