. 2021 Dec 20:12:772909.
doi: 10.3389/fendo.2021.772909. eCollection 2021.

Fibroblast Growth Factor-1 Activates Neurons in the Arcuate Nucleus and Dorsal Vagal Complex

Affiliations

Fibroblast Growth Factor-1 Activates Neurons in the Arcuate Nucleus and Dorsal Vagal Complex

Brandon L Roberts et al. Front Endocrinol (Lausanne). .

Abstract

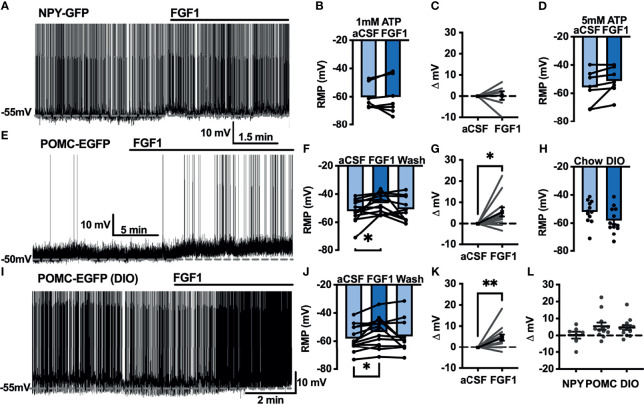
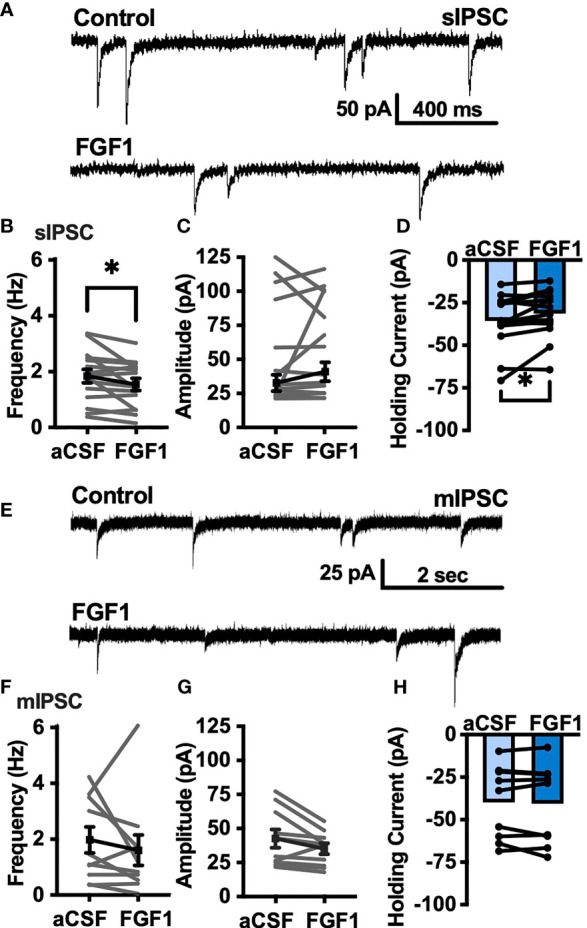
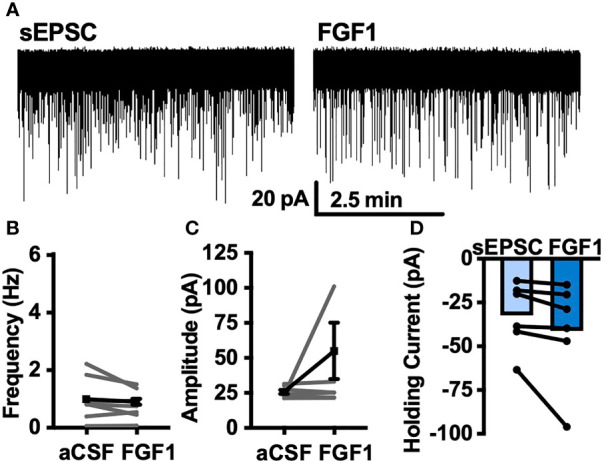
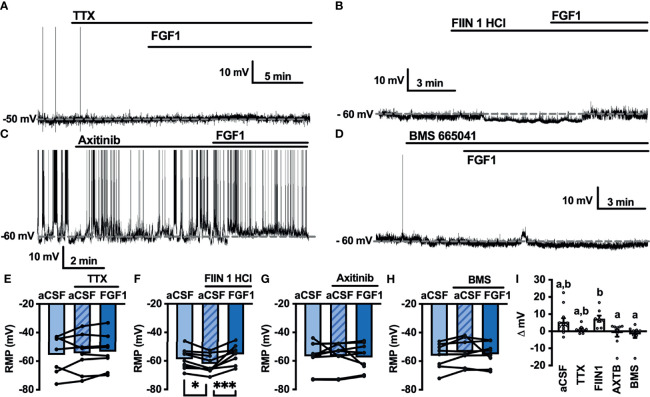
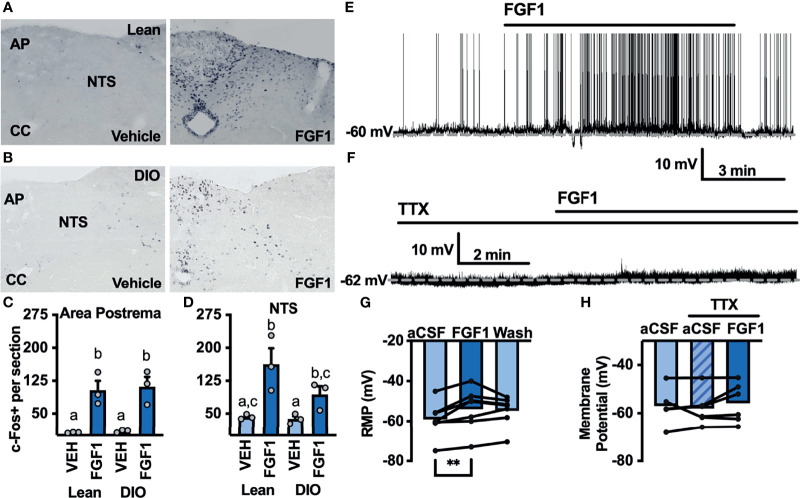
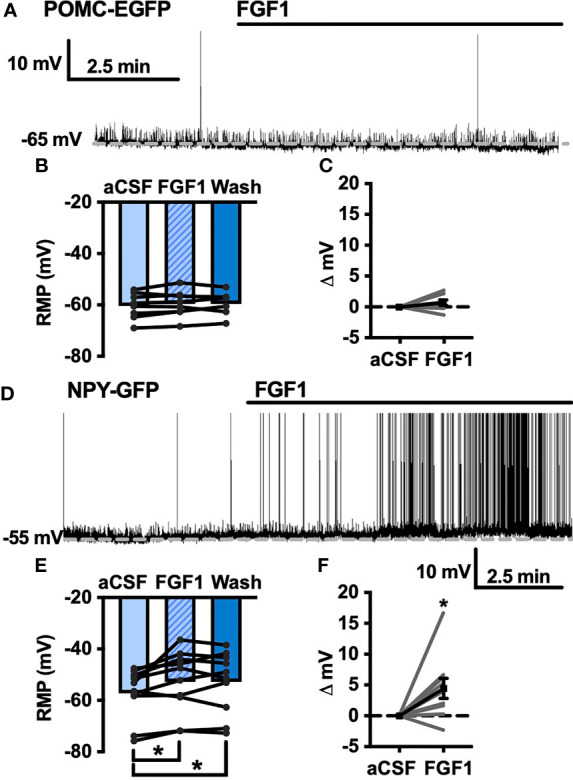
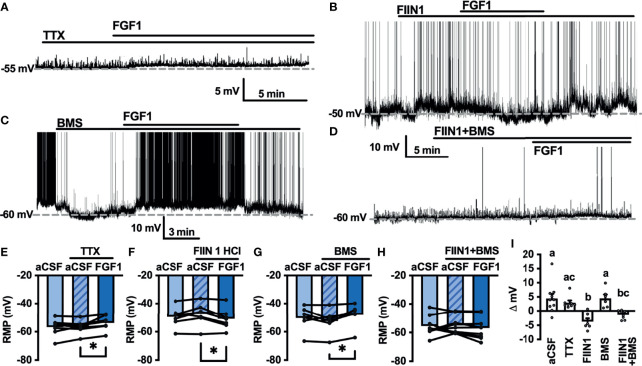
Central administration of fibroblast growth factor-1 (FGF1) results in long-lasting resolution of hyperglycemia in various rodent models, but the pre- and postsynaptic mechanisms mediating the central effects of FGF1 are unknown. Here we utilize electrophysiology recordings from neuronal populations in the arcuate nucleus of the hypothalamus (ARH), nucleus of the solitary tract (NTS), and area postrema (AP) to investigate the mechanisms underlying FGF1 actions. While FGF1 did not alter membrane potential in ARH-NPY-GFP neurons, it reversibly depolarized 83% of ARH-POMC-EGFP neurons and decreased the frequency of inhibitory inputs onto ARH-POMC-EGFP neurons. This depolarizing effect persisted in the presence of FGF receptor (R) blocker FIIN1, but was blocked by pretreatment with the voltage-gated sodium channel (VGSC) blocker tetrodotoxin (TTX). Non-FGF1 subfamilies can activate vascular endothelial growth factor receptors (VEGFR). Surprisingly, the VEGFR inhibitors axitinib and BMS605541 blocked FGF1 effects on ARH-POMC-EGFP neurons. We also demonstrate that FGF1 induces c-Fos in the dorsal vagal complex, activates NTS-NPY-GFP neurons through a FGFR mediated pathway, and requires VGSCs to activate AP neurons. We conclude that FGF1 acts in multiple brain regions independent of FGFRs. These studies present anatomical and mechanistic pathways for the future investigation of the pharmacological and physiological role of FGF1 in metabolic processes.

Keywords: arcuate nucleus of the hypothalamus (ARH); diabetes; dorsal vagal complex (DVC); fibroblast growth factor-1 (FGF1); neuropeptide Y (NPY); proopiomelanocortin (POMC).


Conflict of interest statement

The authors declare that the research was conducted in the absence of any commercial or financial relationships that could be construed as a potential conflict of interest.

Figures

Figure 1
Figure 1
FGF1 depolarizes ARH-POMC-EGFP neurons in chow-fed and DIO mice. (A) Representative trace and (B) mean membrane potential (RMP; n = 7; F(2, 11) = 0.174, p = 0.842 Wash not shown) from ARH-NPY-GFP neurons before and after bath application of FGF1 (100 nM) with 1mM and (D) 5mM internal ATP (n = 7; F(2, 12) = 3.20, p = 0.077 Wash not shown). (E) Representative trace and (F) mean membrane potential of ARH-POMC-EGFP neurons from lean (n = 12; F(2, 20) = 4.25; p = 0.029) and (I, J) DIO mice (n = 13; F(2, 22) = 3.79, p = 0.038) before and after bath application of FGF1 (100 nM). (C) Distribution plot of mV change in individual neurons from chow-fed NPY-GFP (FGF1: 4.7 ± 1.4 mV; t = 0.128, p = 0.902), (G) POMC-EGFP (FGF1: 5.5 ± 2.1 mV; t = 2.60, p = 0.025), and (K) DIO POMC-EGFP (FGF1: 4.5 ± 1.6 mV; t = 3.28, p = 0.007) mice. (H) Baseline membrane potential in chow vs DIO [t(23) = 1.79, p = 0.087] and (L) mV change after FGF1 application compared between NPY-GFP, POMC-EGFP, and DIO POMC-EGFP cells. *p < 0.05, **p < 0.01.
Figure 2
Figure 2
FGF1 decreases sIPSC frequency in ARH-POMC-EGFP neurons. (A) Representative trace from a voltage-clamp experiment showing sIPSC frequency and amplitude after bath application of FGF1 (100 nM) in ARH-POMC-EGFP neurons. (B) sIPSC mean frequency [n = 15, t(14) = 2.37, p = 0.033], (C) amplitude [t(14) = 1.27, p = 0.223] and (D) holding current [t(14) = 2.72, p = 0.017] before and after bath application of FGF1. (E) Representative trace and (F) mIPSC mean frequency [n = 10; t(9) = 0.814, p = 0.437], (G) amplitude [t(9) = 2.11, p =0.064] and (H) holding current [t(9) = 0.574, p = 0.582] before and after bath application of FGF1. *p < 0.05.
Figure 3
Figure 3
FGF1 does not alter sEPSC frequency or amplitude in ARH-POMC-EGFP neurons. (A) Representative trace from a voltage-clamp experiment showing sEPSC frequency and amplitude after bath application of FGF1 (100 nM) in ARH-POMC-EGFP neurons. (B) sEPSC mean frequency [n = 7, t(6) = 1.57, p = 0.167], (C) amplitude [t(6) = 149, p = 0.186] and (D) holding current [t(5) = 1.78, p = 0.135] before and after bath application of FGF1.
Figure 4
Figure 4
FGF1 depolarizes ARH-POMC-EGFP neurons independent of FGF receptors. (A) Representative trace of a POMC-EGFP neuron after bath application of FGF1 in the presence of TTX, (B) FIIN 1 HCl (C), axitinib and (D), BMS 665041. (E) Mean membrane potential (RMP) after bath application of FGF1 in the presence of TTX (n = 8, F(2, 13) = 0.798, p = 0.471). (F) FIIN HCl (n = 8, F(2, 15) = 13.44, p < 0.0001), (G) axitinib (n = 9, F(2, 16) = 0.861, p = 0.861) and (H) BMS 665041 (n = 8, F(2, 13) = 0.798, p = 0.471) (I) Comparison of mV change after bath application of FGF1 in aCSF (5.5 ± 2.1 mV), TTX (1.1 ± 0.8 mV), FIIN 1 HCl (7.4 ± 1.8 mV), axitinib (-1.0 ± 2.1 mV), and BMS 665041 (-1.7 ± 2.1 mV; F(4, 40) = 4.161, p = 0.007). *p < 0.05, ***p < 0.001 (groups not sharing a letter are significantly different from each other as determined by Tukey’s post hoc).
Figure 5
Figure 5
ICV FGF1 injection induces c-Fos in the dorsal DVC (A) Representative images of FGF1 induces c-Fos activation in the area postrema and NTS of lean and (B) DIO mice (C) Mean c-Fos counts (2-3 sections/mouse) in the area postrema (two-way ANOVA, drug effect: F(1, 9) = 47.65, p < 0.0001; diet effect: F(1, 9) = 0.140, p = 0.717) and (D) NTS (drug effect: F(1, 9) = 18.35, p = 0.003; diet effect: F(1, 8) = 3.19, p = 0.112) of lean (n = 3) and DIO (n = 3) mice. (E) Representative trace and (F) mean membrane potential after FGF1 application onto unidentified area postrema neurons (RMP; n = 7, F(2, 12) = 7.08, p = 0.009) and (G, H) after FGF1 application in the presence of TTX (n = 7, F(2, 9) = 0.855, p = 0.457). (**p < 0.01, groups not sharing a letter are significantly different from each other as determined by Tukey's post hoc).
Figure 6
Figure 6
FGF1 activates NTS-NPY-GFP neurons. (A) Representative trace, (B) mean membrane potential (RMP; n = 7, F(2, 12) = 1.05, p = 0.379), and (C) Plot of net mV change in NTS-POMC-EGFP neurons before and after bath application of FGF1 [0.73 ± 1.3 mV; t(8) = 1.63, p = 0.147]. (D) Representative trace and (E) mean membrane potential change for NTS-NPY-GFP neurons (n = 10, F(2, 12) = 5.91, p = 0.011). (F) Plot of net mV change in NTS-NTS-GFP neurons before and after bath application of FGF1 [4.5 ± 1.6 mV; t(9) = 2.75, p = 0.022]. *p < 0.05.
Figure 7
Figure 7
FGF1 acts on NTS-NPY-GFP neurons through multiple mechanisms. (A) Representative trace and (E) mean membrane potential (RMP) before and after bath application of FGF1 in the presence of TTX (n = 8, F(2, 13) = 5.37, p = 0.020) (B, F) FIIN 1 HCl (n = 7, F(2,12) = 4.86, p = 0.029) (C, G) BMS (n = 6, F(2, 10) = 6.11, p = 0.019) and (D, H) FIIN1 + BMS (n = 9, F(2, 16) = 0.934, p = 0.413). (I) Comparison of mV change after bath application of FGF1 (F(4, 33) = 8.28, p < 0.0001) in aCSF (4.5 ± 1.6 mV), TTX (3.0 ± 0.9 mV), FIIN1 (-3.7 ± 1.2 mV), BMS (4.5 ± 1.3 mV), and FIIN + BMS (-1.3 ± 0.5 mV). *p < 0.05 (groups not sharing letters represent a significant difference of p < 0.05 using Tukey’s post hoc].

References

    1. Yun Y-R, Won JE, Jeon E, Lee S, Kang W, Jo H, et al. . Fibroblast Growth Factors: Biology, Function, and Application for Tissue Regeneration. J Tissue Eng (2010) 2010:218142. doi: 10.4061/2010/218142 - DOI - PMC - PubMed
    1. Korc M, Friesel RE. The Role of Fibroblast Growth Factors in Tumor Growth. Curr Cancer Drug Targets (2009) 9(5):639–51. doi: 10.2174/156800909789057006 - DOI - PMC - PubMed
    1. Hutley L, Shurety W, Newell F, McGeary R, Pelton N, Grant J, et al. . Fibroblast Growth Factor 1: A Key Regulator of Human Adipogenesis. Diabetes (2004) 53(12):3097–106. doi: 10.2337/diabetes.53.12.3097 - DOI - PubMed
    1. Murphy M, Drago J, Bartlett PF. Fibroblast Growth Factor Stimulates the Proliferation and Differentiation of Neural Precursor Cells In Vitro . J Neurosci Res (1990) 25(4):463–75. doi: 10.1002/jnr.490250404 - DOI - PubMed
    1. Brown JM, Scarlett JM, Matsen ME, Nguyen HT, Secher AL, Jorgensen R, et al. . The Hypothalamic Arcuate Nucleus–Median Eminence Is a Target for Sustained Diabetes Remission Induced by Fibroblast Growth Factor 1. Diabetes (2019) 68(5):1054–61. doi: 10.2337/db19-0025 - DOI - PMC - PubMed

Publication types

MeSH terms

Substances

LinkOut - more resources