. 2021 Dec 20:12:791319.
doi: 10.3389/fimmu.2021.791319. eCollection 2021.

Thromboxane Mobilizes Insect Blood Cells to Infection Foci

Affiliations

Thromboxane Mobilizes Insect Blood Cells to Infection Foci

Miltan Chandra Roy et al. Front Immunol. .

Abstract

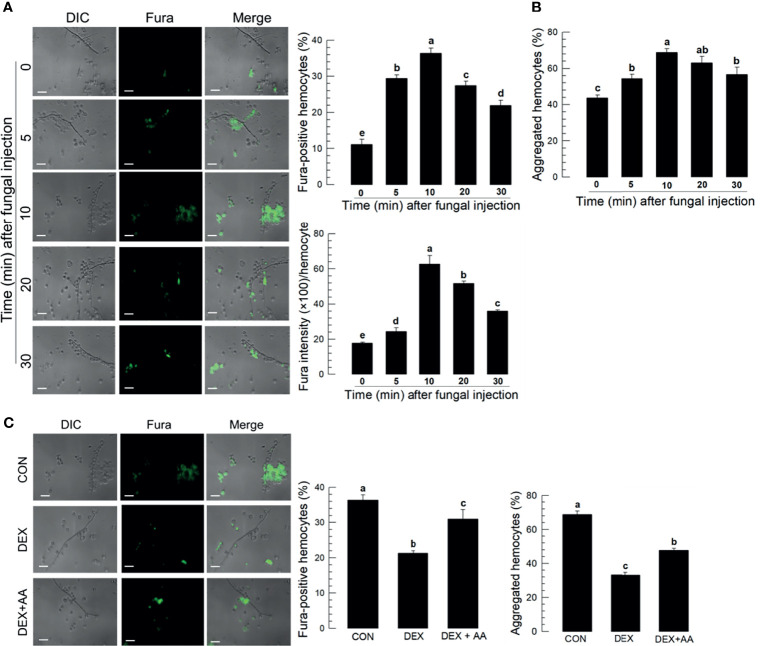
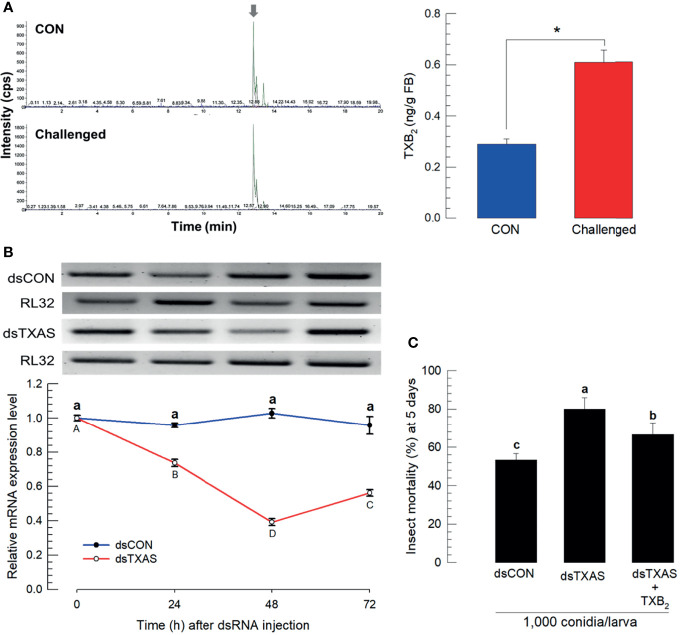
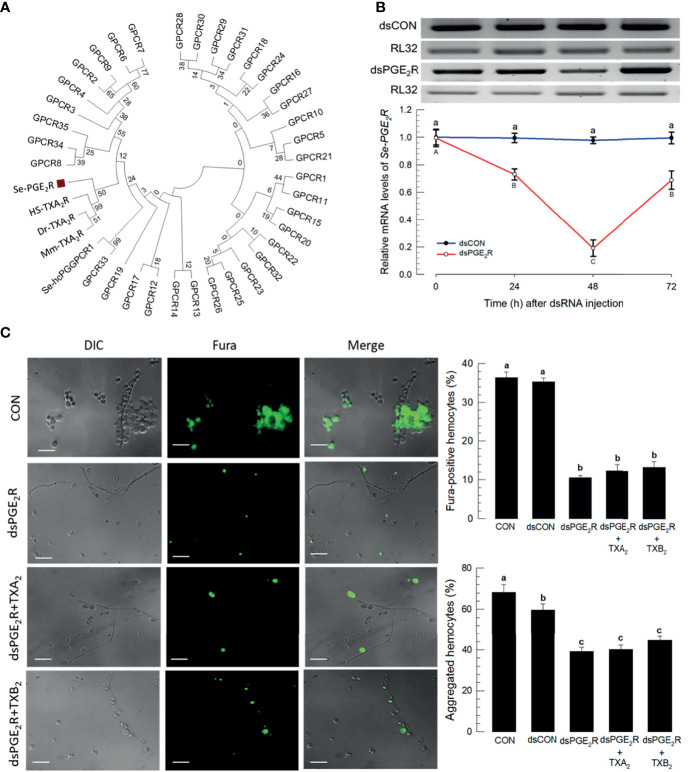
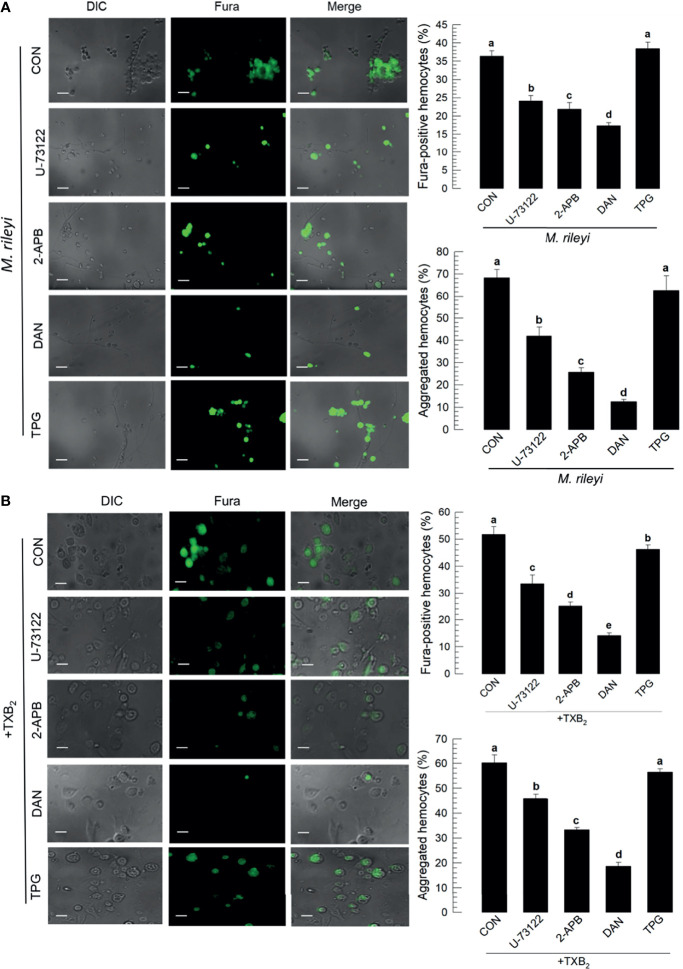
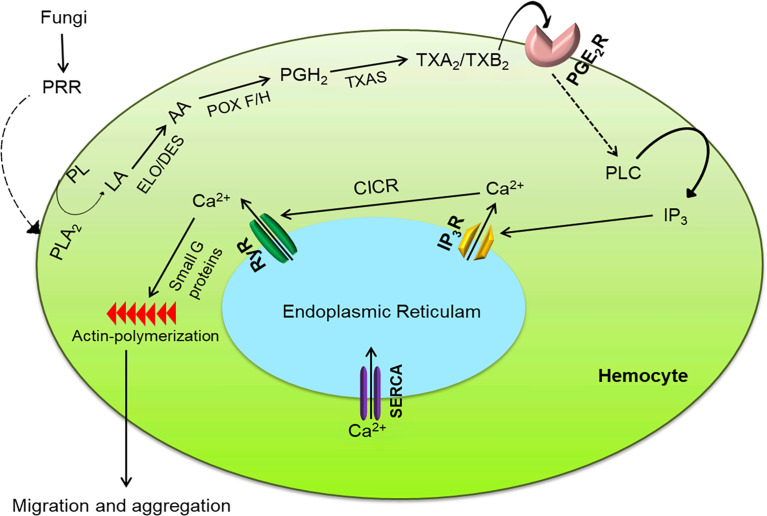
Innate immune responses are effective for insect survival to defend against entomopathogens including a fungal pathogen, Metarhizium rileyi, that infects a lepidopteran Spodoptera exigua. In particular, the fungal virulence was attenuated by cellular immune responses, in which the conidia were phagocytosed by hemocytes (insect blood cells) and hyphal growth was inhibited by hemocyte encapsulation. However, the chemokine signal to drive hemocytes to the infection foci was little understood. The hemocyte behaviors appeared to be guided by a Ca2+ signal stimulating cell aggregation to the infection foci. The induction of the Ca2+ signal was significantly inhibited by the cyclooxygenase (COX) inhibitor. Under the inhibitory condition, the addition of thromboxane A2 or B2 (TXA2 or TXB2) among COX products was the most effective to recover the Ca2+ signal and hemocyte aggregation. TXB2 alone induced a microaggregation behavior of hemocytes under in vitro conditions. Indeed, TXB2 titer was significantly increased in the plasma of the infected larvae. The elevated TXB2 level was further supported by the induction of phospholipase A2 (PLA2) activity in the hemocytes and subsequent up-regulation of COX-like peroxinectins (SePOX-F and SePOX-H) in response to the fungal infection. Finally, the expression of a thromboxane synthase (Se-TXAS) gene was highly expressed in the hemocytes. RNA interference (RNAi) of Se-TXAS expression inhibited the Ca2+ signal and hemocyte aggregation around fungal hyphae, which were rescued by the addition of TXB2. Without any ortholog to mammalian thromboxane receptors, a prostaglandin receptor was essential to mediate TXB2 signal to elevate the Ca2+ signal and mediate hemocyte aggregation behavior. Specific inhibitor assays suggest that the downstream signal after binding TXB2 to the receptor follows the Ca2+-induced Ca2+ release pathway from the endoplasmic reticulum of the hemocytes. These results suggest that hemocyte aggregation induced by the fungal infection is triggered by TXB2via a Ca2+ signal through a PG receptor.

Keywords: Spodoptera exigua; fungi; hemocyte; insect; thromboxane.


Conflict of interest statement

The authors declare that the research was conducted in the absence of any commercial or financial relationships that could be construed as a potential conflict of interest.

Figures

Figure 1
Figure 1
S. exigua immune responses to a M. rileyi fungal infection. For all panels, control (‘CON’) represents solvent (DMSO) injection. Panel (A) shows the influence of fungal topical application or injection (1,000 conidia per L5 larva) on mortality at 5 DPF. Co-injections of DEX (10 μg/larva)+conidia led to increased mortality. Each treatment was replicated three times with 10 larvae per replication. Panel (B) reports the influence of DEX on phagocytosis, determined by fluorescence emitted from internalized FITC-labeled conidia. The assays were replicated at the indicated time points with biologically independent samples. Scale bar represents 10 μm. The accompanying histogram shows proportions of phagocytic hemocytes at the indicated times. Panel (C) shows mean nodules/larvae at the indicated times PFI. L5 larvae were injected with 2 µL of conidia (1×10⁵ conidia/mL). The number of nodules were counted in three larvae at each time point. Panel (D) shows sPLA2 activities in plasma and cPLA2 activities in fat body at the indicated times PFI (n = 3 biologically independent replicates with 10 larvae/replicate). Panel (E) exhibits relative accumulations of mRNAs encoding the indicated PLA2s at 1, 3, 5, and 10 h PFI. ‘NS’, no significant difference. Data analyzed and presented as described in Methods. Different letters or asterisks above standard deviation bars indicate significant difference among means at Type I error = 0.05 (LSD test).
Figure 2
Figure 2
Ca2+ signal in aggregating hemocytes to fungal hyphae of M. rileyi in S. exigua. Panel (A) conveys the induction of Ca2+ signals in S. exigua hemocytes. Larvae were injected with 1,000 conidia/L5 larva at 30 min after injecting 2 µL Fura, 1 mM). At the indicated time points, hemolymph was collected and fixed with 2.5% paraformaldehyde. Fluorescent hemocytes were counted and changes in fluorescence intensity were recorded as described in Methods. Panel (B) shows proportions of Fura-positive hemocytes (upper left), proportions of aggregated hemocytes (upper right), and Fura intensities/100 hemoytes at the indication times PFI. Panel (C) presents the influence of DEX (10 μg/larva) on hemocyte Ca2+ signals and hemocyte aggregating behavior after fungal infection. The left panel presents visual images hemocytes after the indicated treatments. The middle histogram reports proportions of Fura-positive hemocytes in controls, hemocytes after DEX exposure, and hemocytes after DEX+AA (10 μg/larva). Each treatment was replicated three times. Data analyzed and presented as described in Methods. Scale bar represents 10 μm. ‘DIC’ represents differential interference contrast. ‘CON’ represents solvent (DMSO) control. Different letters above standard deviation bars indicate significant difference among means at Type I error = 0.05 (LSD test).
Figure 3
Figure 3
Thromboxanes (TXA2 and TXB2) induce Ca2+ signaling and hemocyte aggregation in S. exigua. Panel (A) reports that the COX inhibitor, NAP, but not LOX inhibitor, ESC, led to reduced proportions of Fura-positive hemocytes and reduced proportions of aggregated hemocytes. Co-injections with NAP+PGE2 (1 µg/µL) rescued the influence of inhibiting COX. Panel (B) displays the influence of DEX on Ca2+ signaling and hemocyte aggregation, which were reversed in larvae treated with DEX+the indicated prostanoids. Panel (C) shows the influence of the thromboxane biosynthesis inhibitor DAZ and the thromboxane receptor antagonist, TTB, on Ca2+ signaling and hemocyte aggregation. The micrographs convey visual images, with reduced Fura signaling and the accompanying histograms show quantitative data with statistical analysis. Each treatment was replicated three times. Data analyzed and presented as described in Methods. Different letters above standard deviation bars indicate significant difference among means at Type I error = 0.05 (LSD test).
Figure 4
Figure 4
Up-regulation of thromboxane biosynthesis in S. exigua hemocytes following M. rileyi infection. Panel (A) presents a likely thromboxane biosynthetic pathway. AA is oxygenated to PGH2 by two peroxinectins, SePOX-F’ and SePOX-H. Thromboxane A2 (‘TXA2’) is then formed by Se-TXAS and non-enzymatically converted to thromboxane B2 (‘TXB2’). Panel (B) reports the influence of M. rileyi infection on accumulations of mRNAs encoding SePOX-A, SePOX-F, SePOX-H, and Se-TXAS. Each treatment was replicated three times. Data analyzed and presented as described in Methods. ‘NS’, no significant difference. Asterisks above standard deviation bars indicate significant difference among means at Type I error = 0.05 (LSD test).
Figure 5
Figure 5
Mass spectral determination of TXB2 and influence of silencing SeTXAS on mortality. Panel (A) shows that the fungal challenge led to increased concentrations of larval fat body TXB2 at 16 h PFI. An arrow shows TXB2 peaks on LC-MS chromatograms Panel (B) shows the influence of injecting an RNAi construct designed to SeTXAS on accumulations of SeTXAS mRNAs. Control dsRNA (‘dsCON’) used dsRNA specific to GFP. Panel (C) shows the influence of dsTXAS on L4 larval mortality at 5 days PFI. Each treatment was replicated three times. Data analyzed and presented as described in Methods. Different letters or asterisks above standard deviation bars indicate significant difference among means at Type I error = 0.05 (LSD test).
Figure 6
Figure 6
Influence of time on hemocytic immunity in S. exigua. Panel (A) depicts time-dependent up-regulation of total hemocyte count (THC) in L5 larvae after TXB2 injection at 1.0 µg/larva. Panel (B) displays hemocyte migration activated by TXB2 as a function of time after hemolymph collection, inhibited in DEX-treated larvae, and rescued in DEX+TXB2-treated larvae. Dotted circles indicate hemocyte migration. Panel (C) shows the influence of PGD2, PGE2, and the two thromboxanes on hemocyte microaggregation. Panel (D) depicts the time-dependent hemocyte microaggregation following larval TXB2 injection 1 µg/mL in in vitro hemocyte preparations. Panel (E) shows dose response of the hemocyte migration 10 min after TXB2 treatment in in vitro hemocyte preparations from naïve larvae. The white arrows point to microaggregates. ‘DIC’ represents differential interference contrast. Each treatment was replicated three times. Data analyzed and presented as described in Methods. Different letters above standard deviation bars indicate significant difference among means at Type I error = 0.05 (LSD test).
Figure 7
Figure 7
A PGE2 receptor mediates thromboxane signaling in S. exigua. Panel (A) shows a phylogenetic analysis of 35 S. exigua G-protein coupled receptors (GPCRs) indicating two PGE2 receptors (‘Se-PGE2R’ and Se-hcPGGPCR1’). The Se receptors are closely aligned with human (‘Hs’), mouse (‘Mm’), and fish (‘Dr’) TXA2 receptors (‘TXA2R’) using the Neighbor-Joining method with MEGA6.06. GenBank accession numbers of these genes are presented in Supplementary data ( Table S4 ). Bootstrap values on the branches were estimated with 1,000 repetitions. The black square indicates a clustering with vertebrate TXA2Rs. Panel (B) indicates the influence of a dsPGE2R construct on accumulations of mRNAs encoding Se-PGE2R as a function of time post-injections. Control dsRNA (‘dsCON’) used dsRNA specific to GFP. Panel (C) shows the influence of dsPGE2R on Ca2+ signaling and hemocyte aggregation, which was not reversed after co-injection of dsPGE2R+TXA2 and dsPGE2R+TXB2. ‘DIC’ represents differential interference contrast. ‘CON’ represents the fungal infection alone. Each treatment was replicated three times. Data analyzed and presented as described in Methods. Different letters above standard deviation bars indicate significant difference among means at Type I error = 0.05 (LSD test).
Figure 8
Figure 8
Influence of Ca2+ signaling inhibitors on Ca2+ signaling in S. exigua hemocytes. Panel (A) depicts the influences of separate treatments with DAN, a ryanodine receptor inhibitor, 2-APB an IP3 receptor inhibitor, U-73122, a PLC inhibitor, and TPG, a SERCA inhibitor on proportions of Fura-positive hemocytes and proportions of aggregated hemocytes following M. rileyi injections. The micrographs show Fura-positive hemocytes and the accompanying histograms present the results in quantitative terms. Panel (B) indicates the negative influence of the Ca2+ signaling inhibitors was not rescued by TXB2 treatments. CON represents the fungal infection or TXB2 alone. Each treatment was replicated three times. Data analyzed and presented as described in Methods. Different letters above standard deviation bars indicate significant difference among means at Type I error = 0.05 (LSD test).
Figure 9
Figure 9
Intracellular immune signaling in S. exigua hemocytes following fungal infection. Fungal hyphae or conidia are recognized by pattern recognition receptor (‘PRR’), which activates the Toll pathway to increase PLA2 activity. The activated PLA2 releases linoleic acid (‘LA’), which is desaturated and elongated into arachidonic acid (‘AA’). AA is then oxygenated by two peroxinectins (‘POX F/H’) into PGH2, which is isomerized into TXA2/TXB2 by TXA2 synthase (‘TXAS’). TXA2/TXB2 is transferred out of the cell to bind with its GPCR (‘PGE2R’) and activate phospholipase C (‘PLC’). PLC increases intracellular inositol triphosphate (‘IP3’) concentrations which binds to its receptor (‘IP3R’) on endoplasmic reticulum, thereby releasing Ca2+ into the cytoplasm Ca2+ triggers calcium-induced calcium release (‘CICR’) from a ryanodine receptor (‘RyR’). The free Ca2+ is a secondary signal to activate small G proteins for actin polymerization to facilitate hemocyte behavior.

Similar articles

Cited by

References

    1. Lemaitre B, Hoffmann J. The Host Defense of Drosophila Melanogaster . Annu Rev Immunol (2007) 25:697–743. doi: 10.1146/annurev.immunol.25.022106.141615 - DOI - PubMed
    1. Kwon H, Bang K, Cho S. Characterization of the Hemocytes in Larvae of Protaetia Brevitarsis Seulensis: Involvement of Granulocyte-Mediated Phagocytosis. PloS One (2014) 9:e103620. doi: 10.1371/journal.pone.0103620 - DOI - PMC - PubMed
    1. Lee J, Hwang S, Cho S. Immune Tolerance to an Intestine-Adapted Bacterium, Chryseobacterium Sp., Injected Into the Hemocoel of Protaetia Brevitarsis Seulensis . Sci Rep (2016) 6:31722. doi: 10.1038/srep31722 - DOI - PMC - PubMed
    1. Kim H, Choi D, Jung J. Kim Y Eicosanoid Mediation of Immune Responses at Early Bacterial Infection Stage and its Inhibition by Photorhabdus Temperata Subsp. Temperata, an Entomopathogenic Bacterium. Arch Insect Biochem Physiol (2018) 99:e21502. doi: 10.1002/arch.21502 - DOI - PubMed
    1. Shrestha S, Kim Y. Various Eicosanoids Modulate the Cellular and Humoral Immune Responses of the Beet Armyworm, Spodoptera Exigua . Biosci Biotechnol Biochem (2009) 73:2077–84. doi: 10.1271/bbb.90272 - DOI - PubMed

Publication types

Supplementary concepts