. 2021 Dec 20:12:809208.
doi: 10.3389/fimmu.2021.809208. eCollection 2021.

Adaptive Immune Response Signaling Is Suppressed in Ly6Chigh Monocyte but Upregulated in Monocyte Subsets of ApoE-/- Mice - Functional Implication in Atherosclerosis

Affiliations

Adaptive Immune Response Signaling Is Suppressed in Ly6Chigh Monocyte but Upregulated in Monocyte Subsets of ApoE-/- Mice - Functional Implication in Atherosclerosis

Pingping Yang et al. Front Immunol. .

Abstract

Rationale: Inflammatory monocyte (MC) subset differentiation is a major feature in tissue inflammatory and atherosclerosis. The underlying molecular mechanism remains unclear.

Objective: This study aims to explore molecule targets and signaling which determinate immunological features in MC subsets.

Methods and results: Blood Ly6Chigh and Ly6Clow MC subsets from control and ApoE-/- mice were isolated by flow cytometry sorting and subjected for bulk high-throughput RNA-sequencing. Intensive bioinformatic studies were performed by analyzing transcriptome through four pairs of comparisons: A) Ly6Chigh vs Ly6Clow in control mice; B) Ly6Chigh vs Ly6Clow in ApoE-/- mice; C) ApoE-/- Ly6Chigh vs control Ly6Chigh MC; D) ApoE-/- Ly6Clow vs control Ly6Clow MC. A total of 80 canonical pathways and 16 enriched pathways were recognized by top-down analysis using IPA and GSEA software, and further used for overlapping analysis. Immunological features and signaling were assessed on four selected functional groups, including MHCII, immune checkpoint, cytokine, and transcription factor (TF). Among the total 14578 significantly differentially expressed (SDE) genes identified though above four comparison, 1051 TF and 348 immunological genes were discovered. SDE immunological genes were matched with corresponding upstream SDE TF by IPA upstream analysis. Fourteen potential transcriptional axes were recognized to modulate immunological features in the Ly6C MC subset. Based on an intensive literature search, we found that the identified SDE immune checkpoint genes in Ly6Chigh MC are associated with pro-inflammatory/atherogenic balance function. Immune checkpoint genes GITR, CTLA4, and CD96 were upregulated in Ly6Clow MC from all mice and presented anti-inflammatory/atherogenic features. Six cytokine genes, including Ccl2, Tnfsf14, Il1rn, Cxcl10, Ccl9, and Cxcl2, were upregulated in Ly6Chigh MC from all mice and associated with pro-inflammatory/atherogenic feature. Cytokine receptor gene Il12rb2, Il1r1, Il27ra, Il5ra, Ngfr, Ccr7, and Cxcr5 were upregulated in Ly6Clow MC from all mice and presented anti-inflammatory/atherogenic features. MHCII genes (H2-Oa, H2-DMb2, H2-Ob, H2-Eb2, H2-Eb1, H2-Aa, and Cd74) were elevated in Ly6Clow MC from all mice. ApoE-/- augmented pro-atherogenic/inflammatory and antigen-presenting cells (APC) feature in both subsets due to elevated expression of cytokine genes (Cxcl11, Cntf, Il24, Xcl, Ccr5, Mpl, and Acvr2a) and MHCII gene (H2-Aa and H2-Ea-ps). Finally, we modeled immunological gene expression changes and functional implications in MC differentiation and adaptive immune response for MC subsets from control and ApoE-/- mice.

Conclusions: Ly6Chigh MC presented pro-inflammatory/atherogenic features and lower APC potential. Ly6Clow MC displayed anti-inflammatory/atherogenic features and higher APC potential. ApoE-/- confers upon both subsets with augmented pro-atherogenic/inflammatory function and APC potential.

Keywords: ApoE; Ly6C MC; adaptive immune response; atherosclerosis; inflammatory.


Conflict of interest statement

The authors declare that the research was conducted in the absence of any commercial or financial relationships that could be construed as a potential conflict of interest.

Figures

Figure 1
Figure 1
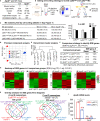
Overall strategy of the identification of molecular signaling in Ly6C MC subset differentiation and adaptive immune response in control and ApoE -/- mice. RNA-Seq were performed in Ly6Chigh (CD11b+Ly6GLy6Chigh) and Ly6Clow (CD11b+Ly6GLy6Clow) MC isolated by flow cytometry sorting from peripheral blood of C57/BL6 control and ApoE -/- mice. Transcriptome data were analyzed by performing four pairs of comparisons: (A) Ly6Chigh vs Ly6Clow (CT), (B) Ly6Chigh vs Ly6Clow (ApoE-/- ), (C) ApoE-/- vs CT (Ly6Chigh), (D) ApoE-/- vs CT (Ly6Clow). SDE genes were identified by using the criteria of |Log2FC| more than 1 (2-FC) and adjusted P value less than 0.01. Top canonical pathways were recognized by top-down analysis using IPA with |Z-score|>2, P value<0.05. Overlapped analysis were performed for canonical pathways between groups. SDE TF and three sets of SDE immunological genes (MHCII, immune checkpoint and cytokine genes) were identified. Immunological SDE genes were matched with corresponding upstream SDE TF by IPA upstream analysis. Models of signal pathway and transcriptional signaling of Ly6C MC subset differentiation were developed. Expression profile and functional feature of immunological SDE genes were characterized. Model of immunological gene expression change and functional implication in MC differentiation and adaptive immune response in MC subsets of both mice were developed. CT, control, ApoE, Apolipoprotein E; FC, fold change; RNA-seq, RNA-sequencing; MC, monocyte; SDE, significant differentially expressed; IPA, Ingenuity Pathway Analysis; GSEA, gene set enrichment analysis; TF, transcription factor.
Figure 2
Figure 2
RNA-Seq analysis and SDE gene identification from blood Ly6Chigh and Ly6Clow MC of control and ApoE -/- mice. (A) ApoE -/- and CT mice. Eleven mice at the age of 20 weeks were used in each group. C57/BL6 mice on rodent chaw were used as CT. ApoE -/- mice were fed a high-fat diet for 8 weeks. (B) Gating and sorting strategy to isolate Ly6Chigh and Ly6Clow MC. Mouse white blood cell were prepared from peripheral blood, pooled, stained with antibody against CD11b, Ly6G and Ly6C and subjected for flow cytometry cell sorting. CD11b+Ly6G- cells were characterized as MC. MC subsets (CD11b+Ly6G-Ly6Chigh, and CD11b+Ly6G-Ly6Clow) were sorted and used for bulk RNA-seq analysis. (C) MC subsets yield by cell sorting. MC (100,000 cells) were sorted by flow cytometry with 43.7% Ly6Chigh, 23.7% Ly6Cmiddle and 32.3% Ly6Clow MC from ApoE -/- mice, and 30.3% Ly6Chigh, 33.1% Ly6Cmiddle and 36% Ly6Clow MC in CT mice. The detail of flow cytometry sorting cell subset was presented in Supplementary Figure 1 . (D) Principal component analysis. PCA analysis incorporated 8 samples from 4 groups of MC subsets {Ly6Chigh (CT), Ly6Clow (CT), Ly6Chigh (ApoE-/- ) and Ly6Clow (ApoE-/- )}. (E) Hierarchical cluster analysis. The similarity of gene expression between different samples is represented by the vertical distances on each branch of the dendrogram. Biological replicates show the highest degree of correlation within samples, represented by short vertical distances. (F) Comparison strategy to identified SDE genes. Four group comparisons (A–D) were performed. Down-regulated and up-regulated SDE genes were identified using the criteria of |Log2FC| more than 1 (2-FC) and adjusted P value less than 0.01. (G) Heatmap of SDE gene in 4 comparison groups. Heatmap shows the expression levels of the SDE gene in Ly6C MC. The color density indicates the average expression of a given gene normalized by z-score. (H) Overlap analysis for SDE gene. Venn diagram summarized the total SDE genes from four pairs of comparisons. Numbers depict the amount of SDE genes. (I) ApoE mRNA levels. MC, monocyte; CT, wild type; ApoE, Apolipoprotein E; FACS, fluorescent-activated cell sorting; PCA, principal component analysis; PC, principal component; SDE, significantly differentially expressed; FC, fold change. *P < 0.05.
Figure 3
Figure 3
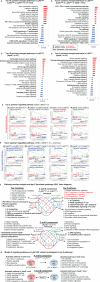
Canonical pathway analysis for SDE genes in four comparison groups (Top 10 up/down changed pathways), (A). CT Ly6Chigh vs CT Ly6Clow; (B). ApoE-/- Ly6Chigh vs ApoE-/- Ly6Clow; (C). Ly6Chigh (ApoE-/- vs CT); (D). Ly6Clow (ApoE-/- vs CT). Top up/down changed canonical pathways were identified by using IPA software with the criteria of adjusted P value<0.05. Blue bar indicates a negative z-score and down-regulated pathways. Red bar indicates a positive z-score and up-regulated pathways. Bold letters indicate overlapped pathway in the same subset. (E) Top 2 up/down regulated pathway. The most enriched significant pathways from GSEA study with threshold of |NES|>1.5 are marked (red=up-regulated, blue=down-regulated). The green curve corresponds to the enriched score. The y-axis indicates the enriched score. The x-axis displaces genes (vertical black lines) represented in their pathway gene set. Rainbow bands represent the corresponding enriched score of the genes (red for positive and blue for negative correlation). The top 20 upregulated or downregulated GSEA pathways were shown in Supplementary Table 1 . (F) Pathway overlap analysis and top 5 functional pathways. Venn diagram summarized the overlap of top 10 pathway presented in (A–D) and listed the top 5 pathways in four pairs of comparisons. (G) Model of signaling pathway in Ly6C MC subset (overlapped or top 5 pathway). Four activated pathways in Ly6Chigh MC and 5 activated pathway in Ly6Clow MC were overlapped in A and B comparison. ApoE -/- induced top 5 activated pathway in both Ly6Chigh MC and Ly6Clow MC. MC, monocyte; MΦ, macrophage; TREM1, The triggering receptor expressed on myeloid cells 1; GPCRs, G-protein-coupled receptors; PFKFB4, 6-phosphofructo-2-kinase/fructose-2,6-biphosphatase 4; SLE, Systemic Lupus Erythematosus, Th1, T helper 1; PKCθ, Protein Kinase C Theta; IL-7, Interleukin 7; NFAT, Nuclear factor of activated T-cells; CHK, Csk-homologous kinase; nNOS, neuronal nitric oxide synthase; PXR, pregnane X receptor; CAR, constitutive androstane receptor. NO, Nitric Oxide; ROS, Reactive Oxygen Species; PRRs, Pattern Recognition Receptors.
Figure 4
Figure 4
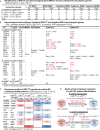
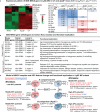
Identification of SDE TF, immunological gene and transcriptional regulatory models. (A) Identification of SDE TF and immunological genes. SDE TF (1150) and MHCII (28), immune checkpoint (82), cytokine ligand (135) and receptor (89) were identified using the criteria of |Log2FC|>1 (2-FC) and adjusted P<0.01. (B) Immunological transcriptional signaling. SDE immunological genes were matched with SDE TF by IPA upstream analysis. Transcriptional regulatory relationship between SDE TF and SDE immunological genes was justified by p-value<0.01 and |z-score|>2. The detailed list of SDE TF matching with the corresponding SDE gene is presented in Supplementary Table 2 . ↑, upregulated; ↓, downregulated (C) Expression profile of SDE TF reported to induce MC proliferation/differentiation. Twelve SDE TF involved in MC generation are differentially expressed in four comparison groups in these subsets. Numbers with red-colored background indicate fold change>2 (log2FC>1). Numbers with blue-colored background indicate fold change<0.5 (log2FC<-1). The completed list of TF reported to induce MC proliferation/differentiation is in Supplementary Table 3 . (D) Model of transcriptional regulation in Ly6C MC subset differentiation. Model describes potential transcriptional regulatory machinery. In A and B comparison, we identified 7-upregulated and 5-downregulated overlapped TF regulating Ly6C MC differentiation. In comparison C, 11 SDE TF (6 up and 5 down) are identified in ApoE-/- Ly6Chigh MC. While, in comparison D, 12 SDE TF (6 up and 6 down) are identified in ApoE-/- Ly6Clow MC. Red letter highlighted the representative up-regulated gene. Blue letter highlighted down-regulated genes.
Figure 5
Figure 5
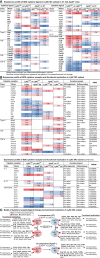
Identification of SDE immune checkpoint gene and function implication in Ly6C MC subset in CT and ApoE -/- mice. (A) Expression profile of SDE immune checkpoint gene. Sixteen pairs of SDE co-stimulatory and 11 pairs of SDE co-inhibitory molecules are identified in four comparison groups. (B) SDE immune checkpoint gene functional implication in Ly6C MC subsets in ApoE -/- mice. ↑ refers to induce expression by ApoE -/-. ↓ refers to reduce expression by ApoE -/-, ± refers to no changes in ApoE -/-. (C) Model of SDE immune checkpoint gene and functional implication. Red letter highlighted the representative up-regulated gene. Blue letter highlighted down-regulated genes. Bold letter emphasized pro-atherogenic function. NA, Not applicable.
Figure 6
Figure 6
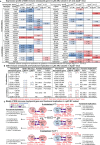
Identification of SDE cytokine gene and function implication in Ly6C MC subset in CT and ApoE -/- mice. (A) Expression profile of SDE cytokine ligand. Fifty-eight SDE cytokine ligand are identified in four comparison groups. (B) Expression profile of SDE cytokine receptor and function implication. Fifty-two SDE cytokine receptor are identified in four comparison groups. There function implication are summarized based on literature search (PMID cited). Red/blue rainbow background represents the gradient of increased/reduced fold change (log2FC>1 and log2FC<-1, respectively). (C) Model of cytokine receptor/ligand change and functional implication. Functional implication is conclude based on cytokine ligand and receptor change. Bold letter emphasized pro-inflammatory and pro-atherogenic function. NA, Not applicable.
Figure 7
Figure 7
APC potential is higher in Ly6Clow MC and elevated by ApoE -/- in Ly6Clow and Ly6Clow MC. (A) Expression pattern of SDE MHCII gene in Ly6C MC in CT and ApoE -/- mice. Heatmap color density indicates the average expression level of a given gene normalized by z-score. Red/blue rainbow background in the table represents the gradient of increased/reduced fold change (log2FC>1, log2FC<-1). (B) SDE MHCII gene orthologous to human HLA, location and function implication. Identified mouse SDE MHCII gene orthologous to human corresponding HLA gene, gene locus and function implication were search from large database (https://www.alliancegenome.org). (C) Model of MHCII complex and APC feature and functional implication in Ly6C MC subset. Model outlines that eight SDE MHCII molecules were upregulated in Ly6Clow MC in both mice and that ApoE -/- further induced MHCII gene expression. Cloud-like cell shape indicade APC potential. MHCII, major histocompatibility complex class II; Ag, antigen; IFN-γ, Interferon gamma; CLIP, class II-associated invariant chain peptide; NOS, Nitrous Oxide Systems.
Figure 8
Figure 8
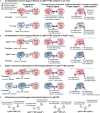
Summarized functional feature of innate-adaptive immunological interplay of Ly6C MC in CT and ApoE -/- mice. Model summarized functional changes derived from molecule signaling presented in Figures 57 . (A) Innate/adaptive immunological feature of Ly6Chigh MC subsets in CT mice. (B) Innate/adaptive immunological feature of Ly6Chigh MC subsets in ApoE -/- mice. (C) ApoE -/–induced innate/adaptive immunological feature of Ly6Chigh MC subsets. (D) Inflammatory and atherogenic functional balance in Ly6C MC. APC, antigen presenting cell; TCR, T cell receptor.

Similar articles

Cited by

References

    1. Hansson GK, Hermansson A. The Immune System in Atherosclerosis. Nat Immunol (2011) 12:204–12. doi: 10.1038/ni.2001 - DOI - PubMed
    1. Zhang J, Zu Y, Dhanasekara CS, Li J, Wu D, Fan Z, et al. . Detection and Treatment of Atherosclerosis Using Nanoparticles. Wiley Interdisciplinary Reviews. Nanomed Nanobiotechnol (2017) 9:10.1002/wnan.1412. doi: 10.1002/wnan.1412 - DOI - PMC - PubMed
    1. Fang P, Li X, Shan H, Saredy JJ, Cueto R, Xia J, et al. . Ly6c(+) Inflammatory Monocyte Differentiation Partially Mediates Hyperhomocysteinemia-Induced Vascular Dysfunction in Type 2 Diabetic Db/Db Mice. Arterioscler Thromb Vasc Biol (2019) 39:2097–119. doi: 10.1161/ATVBAHA.119.313138 - DOI - PMC - PubMed
    1. Zhang D, Jiang X, Fang P, Yan Y, Song J, Gupta S, et al. . Hyperhomocysteinemia Promotes Inflammatory Monocyte Generation and Accelerates Atherosclerosis in Transgenic Cystathionine Beta-Synthase-Deficient Mice. Circulation (2009) 120:1893–902. doi: 10.1161/CIRCULATIONAHA.109.866889 - DOI - PMC - PubMed
    1. Sun L, Yang X, Yuan Z, Wang H. Metabolic Reprogramming in Immune Response and Tissue Inflammation. Arterioscler Thromb Vasc Biol (2020) 40:1990–2001. doi: 10.1161/ATVBAHA.120.314037 - DOI - PMC - PubMed

Publication types

MeSH terms