

Assessment of animal diseases caused by bacteria resistant to antimicrobials: Swine
- PMID: 34987628
- PMCID: PMC8703240
- DOI: 10.2903/j.efsa.2021.7113
Assessment of animal diseases caused by bacteria resistant to antimicrobials: Swine
Abstract
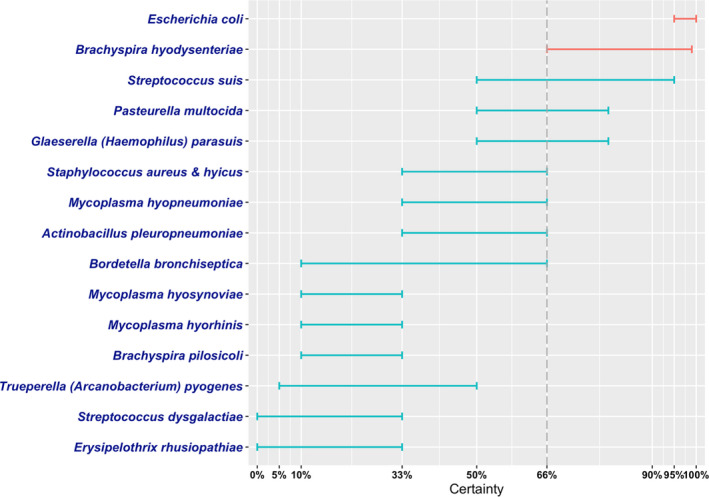
In this opinion, the antimicrobial-resistant bacteria responsible for transmissible diseases that constitute a threat to the health of pigs have been assessed. The assessment has been performed following a methodology based on information collected by an extensive literature review and expert judgement. Details of the methodology used for this assessment are explained in a separate opinion. A global state of play of antimicrobial resistant Escherichia coli, Streptococcus suis, Actinobacillus pleuropneumoniae, Pasteurella multocida, Glaeserella parasuis, Bordetella bronchiseptica, Staphylococcus aureus, Staphylococcus hyicus, Brachyspira hyodysenteriae, Trueperella pyogenes, Erysipelothrix rhusiopathiae, Streptococcus dysgalactiae, Mycoplasma hyosynoviae, Mycoplasma hyorhinis, Mycoplasma hyopneumoniae and Brachyspira pilosicoli has been provided. Among those bacteria, EFSA identified E. coli and B. hyodysenteriae with > 66% certainty as being the most relevant antimicrobial resistant bacteria in the EU based on the available evidence. The animal health impact of these most relevant bacteria, as well as their eligibility for being listed and categorised within the animal health law framework will be assessed in separate scientific opinions.
Keywords: animal health law; antimicrobial resistance; extensive literature review; pig; swine.
© 2021 European Food Safety Authority. EFSA Journal published by John Wiley and Sons Ltd on behalf of European Food Safety Authority.
Figures
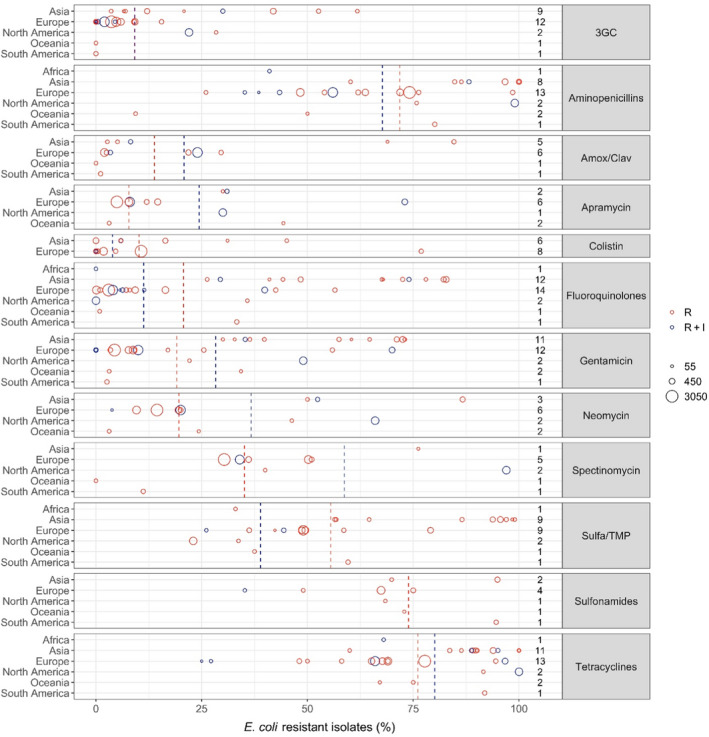
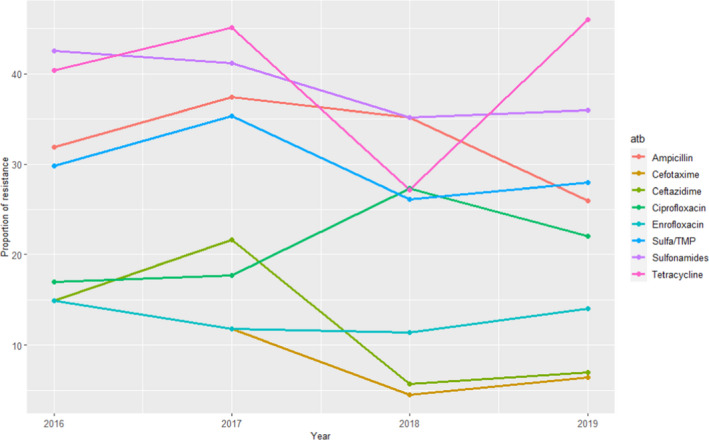
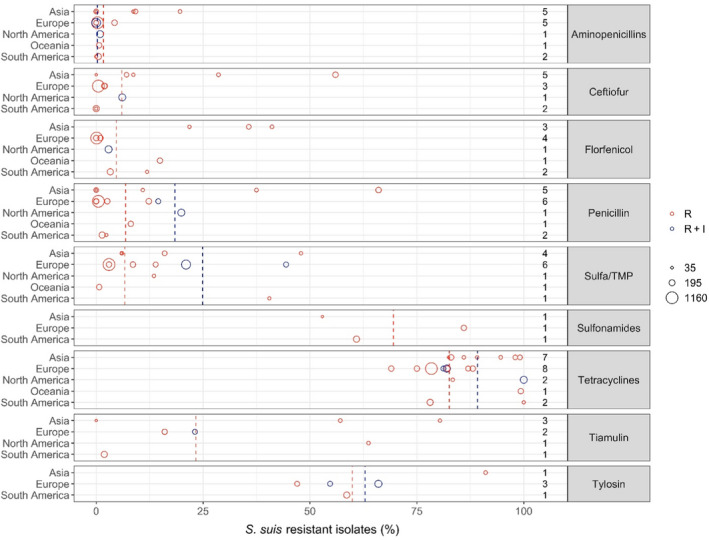
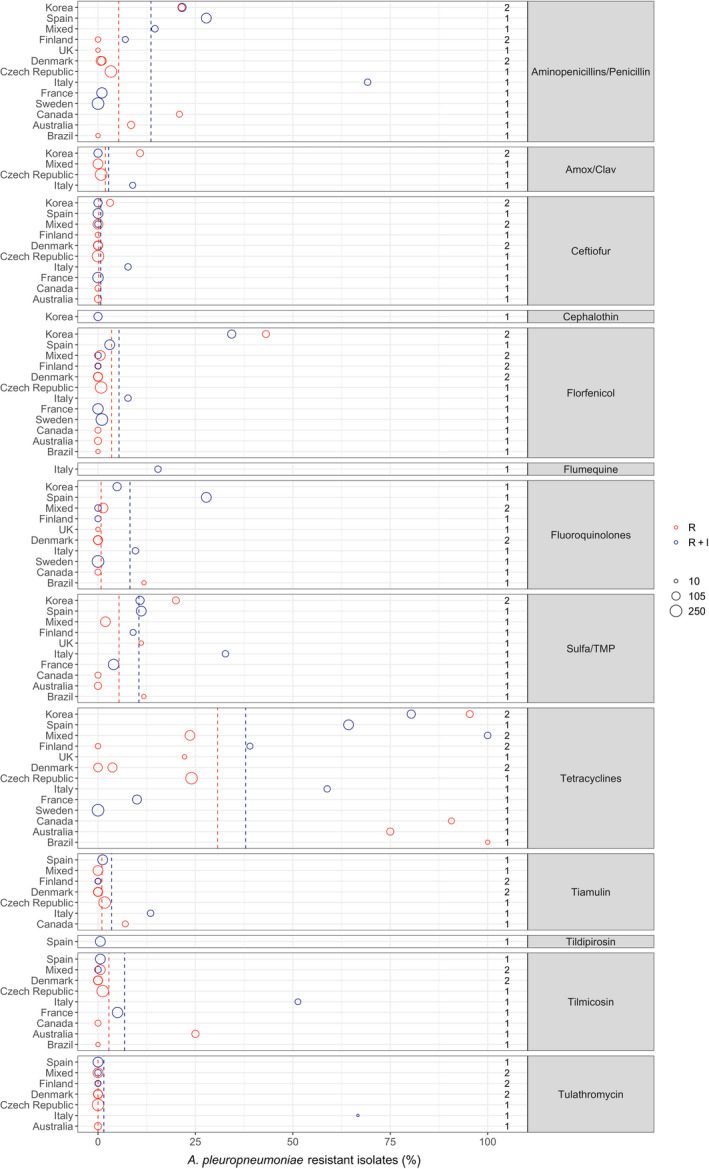
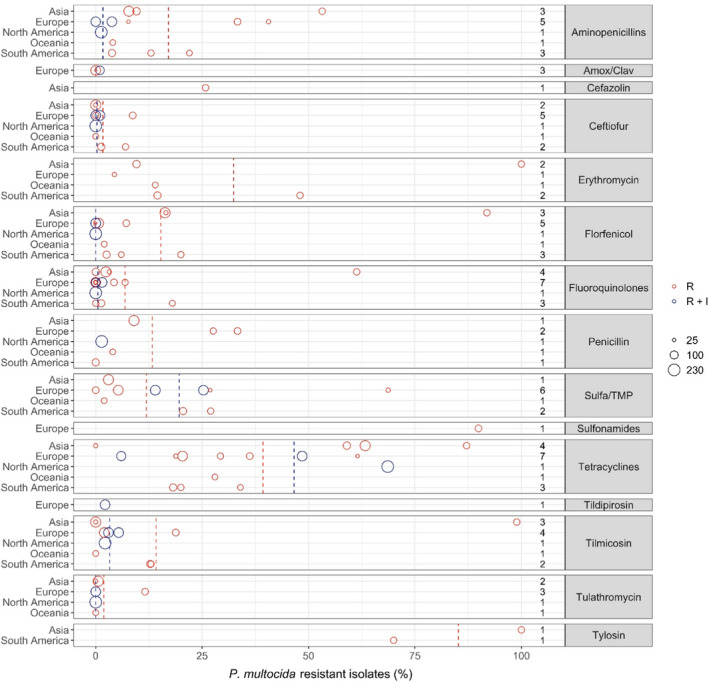
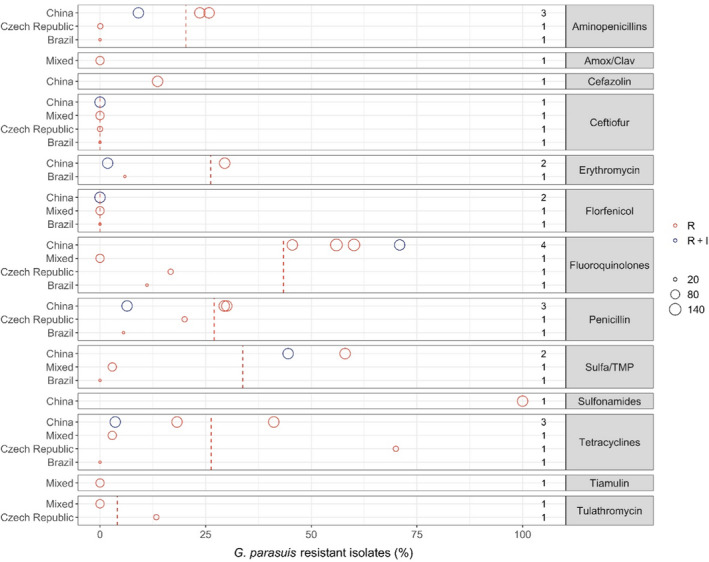
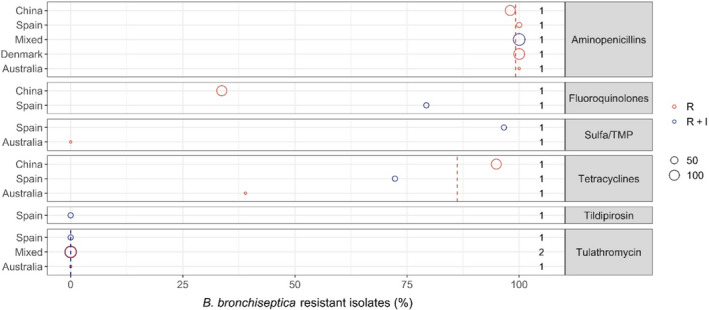
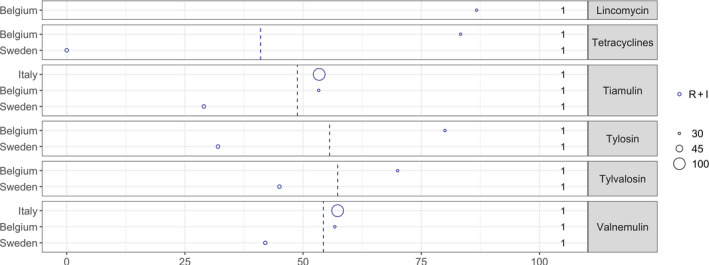
Each circle represents one study, and the size of each circle reflects how many isolates were included in the study. The colour of the circle illustrates resistance only (red circle) or resistance merged with intermediate (blue circle). The dashed lines indicate, for each antibiotic, the weighted arithmetic mean of %R (red dashed line) or %R+I (blue dashed line). The exact percentages these lines represent are listed in Appendix E. Numbers written to the left of the antibiotic names reflect the number of studies for a certain drug/continent combination.
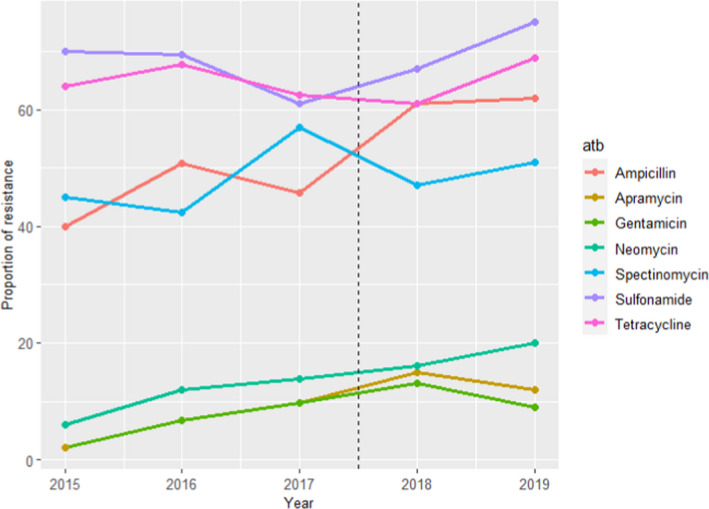
Each circle represents one study, and the size of each circle reflects how many isolates were included in the study. The colour of a circle illustrates resistance only (red circle) or resistance merged with intermediate (blue circle). The dashed lines indicate, for each antibiotic, the weighted arithmetic mean of %R (red dashed line) or %R + I (blue dashed line). The exact percentages these lines represent are listed in Appendix E. Numbers written to the left of the antibiotic names reflect the number of studies for a certain drug/continent combination.
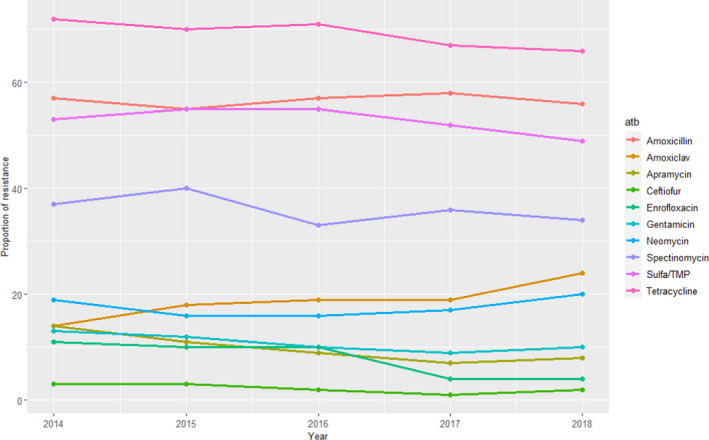
Each circle represents one study, and the size of each circle reflects how many isolates were included in the study. The colour of a circle illustrates resistance only (red circle) or resistance merged with intermediate (blue circle). The dashed lines indicate, for each antibiotic, the weighted arithmetic mean of %R (red dashed line) or %R + I (blue dashed line). The exact percentages these lines represent are listed in Appendix E. Numbers written to the left of the antibiotic names reflect the number of studies for a certain drug/continent combination.
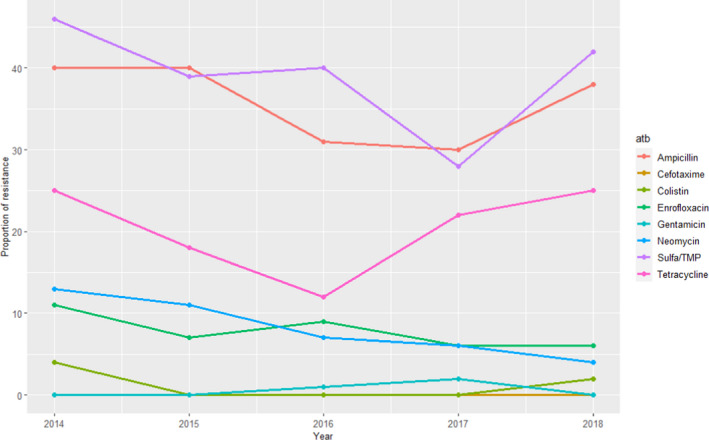
Each circle represents one study, and the size of each circle reflects how many isolates were included in the study. The colour of a circle illustrates resistance only (red circle) or resistance merged with intermediate (blue circle). The dashed lines indicate, for each antibiotic, the weighted arithmetic mean of %R (red dashed line) or %R + I (blue dashed line). The exact percentages these lines represent are listed in Appendix E. Numbers written to the left of the antibiotic names reflect the number of studies for a certain drug/continent combination.
Each circle represents one study, and the size of each circle reflects how many isolates were included in the study. The colour of a circle illustrates resistance only (red circle) or resistance merged with intermediate (blue circle). The dashed lines indicate, for each antibiotic, the weighted arithmetic mean of %R (red dashed line) or %R + I (blue dashed line). The exact percentages these lines represent are listed in Appendix E. Numbers written to the left of the antibiotic names reflect the number of studies for a certain drug/country combination.
Each circle represents one study, and the size of each circle reflects how many isolates were included in the study. The colour of a circle illustrates resistance only (red circle) or resistance merged with intermediate (blue circle). The dashed lines indicate, for each antibiotic, the weighted arithmetic mean of %R (red dashed line) or %R + I (blue dashed line). The exact percentages these lines represent are listed in Annex V. Numbers written to the left of the antibiotic names reflect the number of studies for a certain drug/country combination.
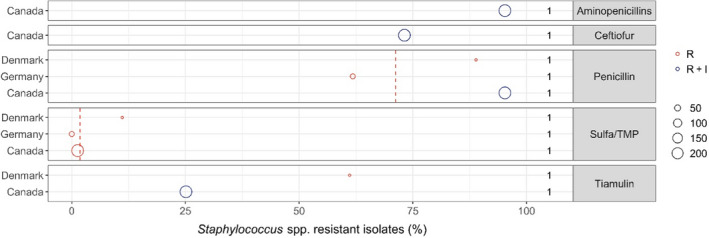
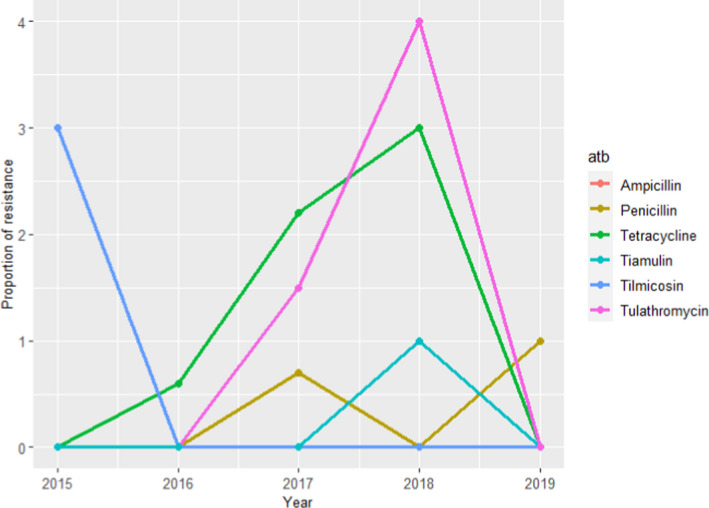
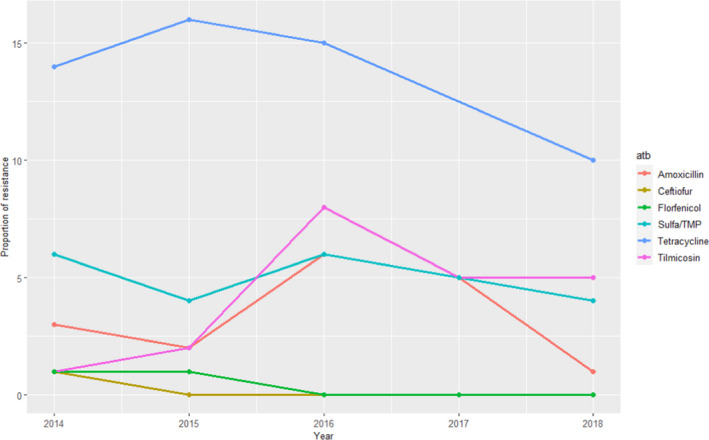
Each circle represents one study, and the size of each circle reflects how many isolates were included in the study. The colour of a circle illustrates resistance only (red circle) or resistance merged with intermediate (blue circle). The red dashed lines indicate, for each antibiotic, the weighted arithmetic mean of %R. The exact percentages these lines represent are listed in Appendix E. Numbers written to the left of the antibiotic names reflect the number of studies for a certain drug/country combination.
References
-
- Abraham S, Jordan D, Wong HS, Johnson JR, Toleman MA, Wakeham DL, Gordon DM, Turnidge JD, Mollinger JL, Gibson JS and Trott DJ, 2015. First detection of extended‐spectrum cephalosporin‐ and fluoroquinolone‐resistant Escherichia coli in Australian food‐producing animals. Journal of Global Antimicrobial Resistance, 3, 273–277. - PubMed
-
- Amaral AF, Rebelatto R, Klein CS, Takeuti KL, Filho JXO, Morés N, Cardoso MRI and Barcellos DESN, 2019. Antimicrobial susceptibility profile of historical and recent Brazilian pig isolates of Pasteurella multocida. Pesquisa Veterinária Brasileira, 39, 107–111. 10.1590/1678-5150-pvb-5810 - DOI
-
- Bessone FA, Perez MLS, Zielinski G, Dibarbora M, Conde MB, Cappuccio J and Alustiza F, 2019. Characterization and comparison of strains of Pasteurella multocida associated with cases of progressive atrophic rhinitis and porcine pneumonia in Argentina. Veterinary World, 12, 434–439. 10.14202/vetworld.2019.434-439 - DOI - PMC - PubMed
-
- Burow E, Rostalski A, Harlizius J, Gangl A, Simoneit C, Grobbel M, Kollas C, Tenhagen B-A and Käsbohrer A, 2019. Antibiotic resistance in Escherichia coli from pigs from birth to slaughter and its association with antibiotic treatment. Preventive Veterinary Medicine, 165, 52–62. - PubMed
-
- Callens B, Faes C, Maes D, Catry B, Boyen F, Francoys D, de Jong E, Haesebrouck F and Dewulf J, 2015. Presence of antimicrobial resistance and antimicrobial use in sows are risk factors for antimicrobial resistance in their offspring. Microbial Drug Resistance, 21, 50–58. 10.1089/mdr.2014.0037 - DOI - PubMed