

Comprehensive omics analyses profile genesets related with tumor heterogeneity of multifocal glioblastomas and reveal LIF/CCL2 as biomarkers for mesenchymal subtype
- PMID: 34987659
- PMCID: PMC8690928
- DOI: 10.7150/thno.65739
Comprehensive omics analyses profile genesets related with tumor heterogeneity of multifocal glioblastomas and reveal LIF/CCL2 as biomarkers for mesenchymal subtype
Abstract
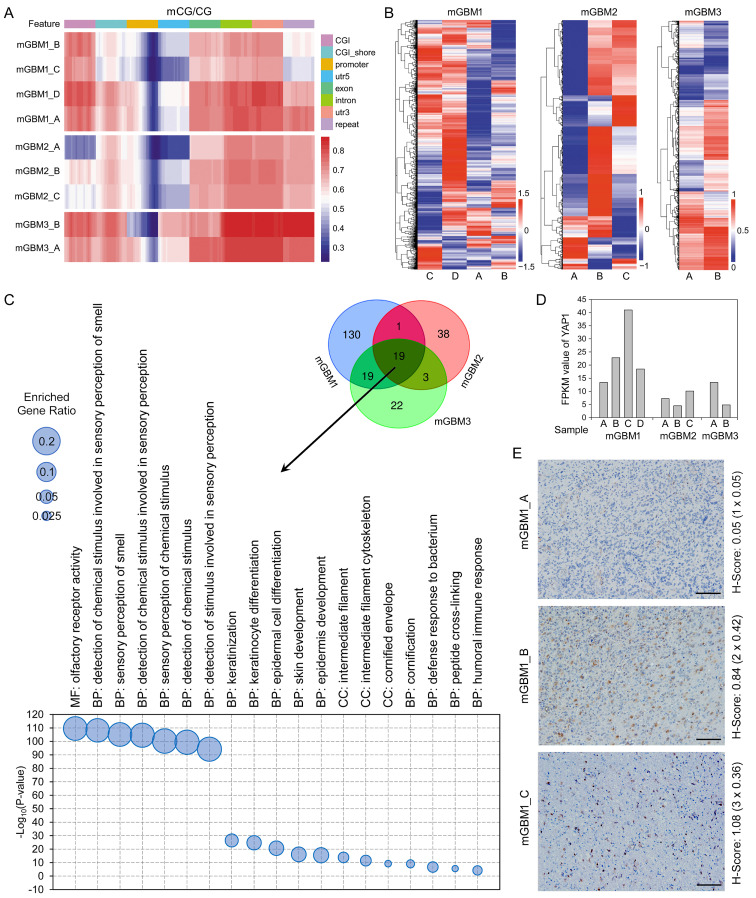
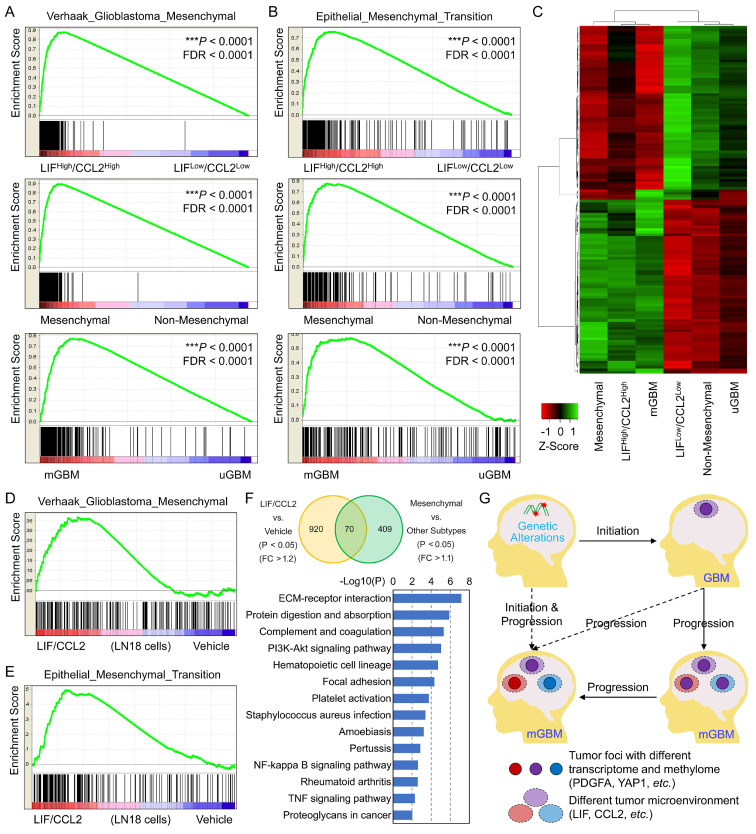
Rationale: Around 10%-20% patients with glioblastoma (GBM) are diagnosed with more than one tumor lesions or multifocal GBM (mGBM). However, the understanding on genetic, DNA methylomic, and transcriptomic characteristics of mGBM is still limited. Methods: In this study, we collected nine tumor foci from three mGBM patients followed by whole genome sequencing, whole genome bisulfite sequencing, RNA sequencing, and immunohistochemistry. The data were further examined using public GBM databases and GBM cell line. Results: Analysis on genetic data confirmed common features of GBM, including gain of chr.7 and loss of chr.10, loss of critical tumor suppressors, high frequency of PDGFA and EGFR amplification. Through profiling DNA methylome of individual tumor foci, we found that promoter methylation status of genes involved in detection of chemical stimulus, immune response, and Hippo/YAP1 pathway was significantly changed in mGBM. Although both CNV and promoter methylation alteration were involved in heterogeneity of different tumor foci from same patients, more CNV events than promoter hypomethylation events were shared by different tumor foci, implying CNV were relatively earlier than promoter methylation alteration during evolution of different tumor foci from same mGBM. Moreover, different tumor foci from same mGBM assumed different molecular subtypes and mesenchymal subtype was prevalent in mGBM, which might explain the worse prognosis of mGBM than single GBM. Interestingly, we noticed that LIF and CCL2 was tightly correlated with mesenchymal subtype tumor focus in mGBM and predicted poor survival of GBM patients. Treatment with LIF and CCL2 produced mesenchymal-like transcriptome in GBM cells. Conclusions: Together, our work herein comprehensively profiled multi-omics features of mGBM and emphasized that components of extracellular microenvironment, such as LIF and CCL2, contributed to the evolution and prognosis of tumor foci in mGBM patients.
Keywords: CCL2; LIF; extracellular matrix; immune response; molecular subtype; multifocal GBM.
© The author(s).
Conflict of interest statement
Competing Interests: The authors have declared that no competing interest exists.
Figures


Similar articles
-
Comprehensive understanding of glioblastoma molecular phenotypes: classification, characteristics, and transition.Cancer Biol Med. 2024 May 6;21(5):363-81. doi: 10.20892/j.issn.2095-3941.2023.0510. Cancer Biol Med. 2024. PMID: 38712813 Free PMC article. Review.
-
Machine learning and multi-omics analysis reveal key regulators of proneural-mesenchymal transition in glioblastoma.Sci Rep. 2025 Jun 5;15(1):19731. doi: 10.1038/s41598-025-04862-z. Sci Rep. 2025. PMID: 40473799 Free PMC article.
-
Genome-wide methylomic and transcriptomic analyses identify subtype-specific epigenetic signatures commonly dysregulated in glioma stem cells and glioblastoma.Epigenetics. 2018;13(4):432-448. doi: 10.1080/15592294.2018.1469892. Epub 2018 Aug 6. Epigenetics. 2018. PMID: 29927689 Free PMC article.
-
Comprehensive molecular characterization of multifocal glioblastoma proves its monoclonal origin and reveals novel insights into clonal evolution and heterogeneity of glioblastomas.Neuro Oncol. 2017 Apr 1;19(4):546-557. doi: 10.1093/neuonc/now231. Neuro Oncol. 2017. PMID: 28201779 Free PMC article.
-
Current Insights into Mesenchymal Signatures in Glioblastoma.Acta Med Okayama. 2022 Oct;76(5):489-502. doi: 10.18926/AMO/64024. Acta Med Okayama. 2022. PMID: 36352795 Review.
Cited by
-
Inhibitory effects of temozolomide on glioma cells is sensitized by RSL3-induced ferroptosis but negatively correlated with expression of ferritin heavy chain 1 and ferritin light chain.Lab Invest. 2022 Jul;102(7):741-752. doi: 10.1038/s41374-022-00779-7. Epub 2022 Mar 28. Lab Invest. 2022. PMID: 35351965
-
Single-cell multi-omics sequencing uncovers region-specific plasticity of glioblastoma for complementary therapeutic targeting.Sci Adv. 2024 Nov 22;10(47):eadn4306. doi: 10.1126/sciadv.adn4306. Epub 2024 Nov 22. Sci Adv. 2024. PMID: 39576855 Free PMC article.
-
Comprehensive understanding of glioblastoma molecular phenotypes: classification, characteristics, and transition.Cancer Biol Med. 2024 May 6;21(5):363-81. doi: 10.20892/j.issn.2095-3941.2023.0510. Cancer Biol Med. 2024. PMID: 38712813 Free PMC article. Review.
-
EPHA2 mediates PDGFA activity and functions together with PDGFRA as prognostic marker and therapeutic target in glioblastoma.Signal Transduct Target Ther. 2022 Feb 2;7(1):33. doi: 10.1038/s41392-021-00855-2. Signal Transduct Target Ther. 2022. PMID: 35105853 Free PMC article.
-
HOXD-AS2-STAT3 feedback loop attenuates sensitivity to temozolomide in glioblastoma.CNS Neurosci Ther. 2023 Nov;29(11):3430-3445. doi: 10.1111/cns.14277. Epub 2023 Jun 12. CNS Neurosci Ther. 2023. PMID: 37308741 Free PMC article.
References
-
- Louis DN, Perry A, Reifenberger G, von Deimling A, Figarella-Branger D, Cavenee WK. et al. The 2016 World Health Organization Classification of Tumors of the Central Nervous System: a summary. Acta Neuropathol. 2016;131:803–20. - PubMed
-
- Hassaneen W, Levine NB, Suki D, Salaskar AL, de Moura Lima A, McCutcheon IE. et al. Multiple craniotomies in the management of multifocal and multicentric glioblastoma. Clinical article. J Neurosurg. 2011;114:576–84. - PubMed
-
- Patil CG, Yi A, Elramsisy A, Hu J, Mukherjee D, Irvin DK. et al. Prognosis of patients with multifocal glioblastoma: a case-control study. J Neurosurg. 2012;117:705–11. - PubMed
-
- Krex D, Mohr B, Appelt H, Schackert HK, Schackert G. Genetic analysis of a multifocal glioblastoma multiforme: a suitable tool to gain new aspects in glioma development. Neurosurgery. 2003;53:1377–84. discussion 84. - PubMed
Publication types
MeSH terms
Substances
LinkOut - more resources
Full Text Sources
Other Literature Sources
Medical
Research Materials
Miscellaneous
