. 2021 Dec 4;25(1):103570.
doi: 10.1016/j.isci.2021.103570. eCollection 2022 Jan 21.

AMP-activated protein kinase alpha1 promotes tumor development via FOXP3 elevation in tumor-infiltrating Treg cells

Affiliations

AMP-activated protein kinase alpha1 promotes tumor development via FOXP3 elevation in tumor-infiltrating Treg cells

Junqing An et al. iScience. .

Abstract

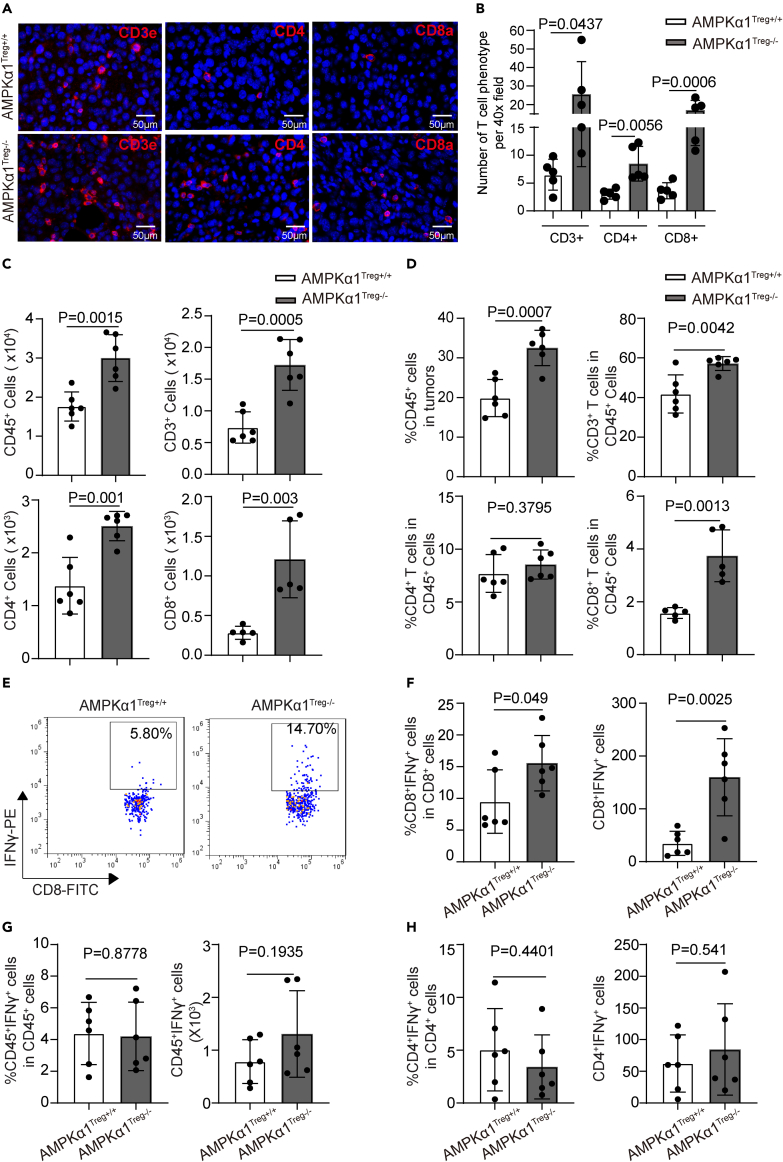
Overwhelming evidence indicates that infiltration of tumors by Treg cells with elevated levels of FOXP3 suppresses the host antitumor immune response. However, the molecular mechanisms that maintain high expression of FOXP3 in tumor-infiltrating Treg cells remain elusive. Here, we report that AMP-activated protein kinase alpha1 (AMPKα1) enables high FOXP3 expression in tumor-infiltrating Treg cells. Mice with Treg-specific AMPKα1 deletion showed delayed tumor progression and enhanced antitumor T cell immunity. Further experiments showed that AMPKα1 maintains the functional integrity of Treg cells and prevents interferon-γ production in tumor-infiltrating Treg cells. Mechanistically, AMPKα1 maintains the protein stability of FOXP3 in Treg cells by downregulating the expression of E3 ligase CHIP (STUB1). Our results suggest that AMPKα1 activation promotes tumor growth by maintaining FOXP3 stability in tumor-infiltrating Treg cells and that selective inhibition of AMPK in Treg cells might be an effective anti-tumor therapy.

Keywords: Cancer; Immunology; Molecular biology.


Conflict of interest statement

The authors declare no conflicts of interest.

Figures

None
Graphical abstract
Figure 1
Figure 1
AMPKα1 is upregulated in tumor-infiltrating Tregs and promotes tumor development (A) Representative flow cytometry images and quantification of CD4+Foxp3+ frequency in mouse spleens and tumors on day 10 after B16F10 melanoma implantation (n = 4 in each group; data are presented as individual values and mean ± SD and analyzed by Student's t test). (B) Representative flow cytometry images and quantification of AMPKα1 mean fluorescence intensity (MFI) in Treg cells from mouse spleens and tumors (n = 4 in each group; data are presented as individual values and mean ± SD and analyzed by Student's t test). (C) Representative images of tumors from AMPKα1Treg+/+ and AMPKα1Treg-/- mice on day 13 after implantation with B16F10 cells. (D) Tumor volume in AMPKα1Treg+/+ and AMPKα1Treg-/- mice after implantation with B16F10 cells (n = 13 in AMPKα1Treg+/+ group and n = 15 in AMPKα1Treg-/- group; data are presented as mean ± SEM and analyzed by two-way ANOVA). (E) Tumor weight in AMPKα1Treg+/+ and AMPKα1Treg-/- mice on day-13 after implantation with B16F10 cells (n = 13 in AMPKα1Treg+/+ group and n = 15 in AMPKα1Treg-/- group; data are presented as individual values and mean ± SD and analyzed by Student's t test). (F) Representative images of immunofluorescence and quantification of CD31 intensity in tumors from AMPKα1Treg+/+ and AMPKα1Treg-/-mice on day 10 after implantation with B16F10 cells (n = 6 in each group; data are presented as individual values and mean ± SD and analyzed by Student's t test). Three or more fields per tumor were quantified. Scale bar: 100 μm. (G) Representative images of immunofluorescence and percentage of Ki67+ cells in tumors from AMPKα1Treg+/+ and AMPKα1Treg-/-mice on day 10 after implantation with B16F10 cells (n = 5 in AMPKα1Treg+/+ group and n = 6 in AMPKα1Treg−/− group; data are presented as individual values and mean ± SD and analyzed by Student's t test). Three or more fields per tumor were quantified. Scale bar: 50 μm.
Figure 2
Figure 2
Treg-specific AMPKα1 deficient mice show increased antitumor immunity (A) Representative immunofluorescence staining images of CD3e, CD4, and CD8a in tumor sections from AMPKα1Treg+/+ and AMPKα1Treg-/- mice. Scale bar: 50 μm. (B) Cell numbers of CD3+, CD4+, and CD8+ T cells per 40× field in tumor sections from AMPKα1Treg+/+ and AMPKα1Treg-/- mice (n = 5 in each group; data are presented as individual values and mean ± SD and analyzed by Student's t test). Five or more fields per tumor were quantified. (C) Numbers of CD45+ (n = 6), CD3+ (n = 6), CD4+ (n = 6), and CD8+ (n = 5) T cells per 1 × 106 tumor cells from day-13 tumor tissues of AMPKα1Treg+/+ and AMPKα1Treg-/- mice measured by flow cytometry (data are presented as individual values and mean ± SD and analyzed by Student's t test). (D) Proportions of CD45+ (n = 6), CD3+ (n = 6), CD4+ (n = 6), and CD8+ (n = 5) T cells in day-13 tumor tissues of AMPKα1Treg+/+ and AMPKα1Treg-/- mice analyzed by flow cytometry (data are presented as individual values and mean ± SD and analyzed by Student's t test). (E) Representative FACS images of IFN-γ–producing CD8+ cells from day-13 tumor tissues of AMPKα1Treg+/+ and AMPKα1Treg-/- mice. (F) Frequency and numbers of IFN-γ–producing CD8+ cells per 1×10⁶ tumor cells from tumor tissues of AMPKα1Treg+/+ and AMPKα1Treg-/- mice (n = 6 in each group; data are presented as individual values and mean ± SD and analyzed by Student's t test). (G) Frequency and numbers of IFN-γ–producing CD45+ cells per 1 × 106 tumor cells from tumor tissues of AMPKα1Treg+/+ and AMPKα1Treg-/- mice (n = 6 in each group; data are presented as individual values and mean ± SD and analyzed by Student's t test). (H) Frequency and numbers of IFN-γ–producing CD4+ cells per 1 × 106 tumor cells from tumor tissues of AMPKα1Treg+/+ and AMPKα1Treg-/- mice (n = 6 in each group; data are presented as individual values and mean ± SD and analyzed by Student's t test).
Figure 3
Figure 3
AMPKα1-deficient Treg cells present a ‘fragile’ phenotype in TME (A) Gating strategy of CD4+YFP+ Treg cells from tumor tissues. (B) Representative FACS images of ICOS, CD25, CTLA-4, GITR, PD1, and Nrp1 expression on CD4+Foxp3-YFP+ Treg cells from day 13 tumor tissues of AMPKα1Treg+/+ and AMPKα1Treg-/- mice. (C) Relative MFI of cell surface ICOS (n = 5), CD25 (n = 6), CTLA-4 (n = 6), GITR (n = 6), PD1 (n = 6) and Nrp1 (n = 5) on CD4+Foxp3-YFP+ Treg cells from day 13 tumor tissues of AMPKα1Treg+/+and AMPKα1Treg-/- mice. (Data are presented as individual values and mean ± SD and analyzed by Student's t test). (D) Representative FACS images and frequency of YFP+IL-10+ Treg cells in CD4+Foxp3-YFP+ Treg cells from day 13 tumor tissues of AMPKα1Treg+/+and AMPKα1Treg-/- mice. (n = 6 in each group, data are presented as individual values and mean ± SD and analyzed by Student's t test). (E) Relative MFI of IL-10 in CD4+Foxp3-YFP+ Treg cells from day 13 tumor tissues of AMPKα1Treg+/+and AMPKα1Treg-/- mice. (n = 6 in each group, data are presented as individual values and mean ± SD). (F) Representative FACS images and frequency of YFP+IFN-γ+ Treg cells in CD4+Foxp3-YFP+ Treg cells from day 13 tumor tissues of AMPKα1Treg+/+and AMPKα1Treg-/- mice. (n = 6 in each group, data are presented as individual values and mean ± SD and analyzed by Student's t test). (G) Relative MFI of IFN-γ in CD4+Foxp3-YFP+ Treg cells from day 13 tumor tissues of AMPKα1Treg+/+and AMPKα1Treg-/- mice. (n = 6 in each group, data are presented as individual values and mean ± SD and analyzed by Student's t test).
Figure 4
Figure 4
AMPKα1 deficiency impairs FOXP3 expression in Treg cells (A) Representative immunofluorescence images of FOXP3 and quantification of Foxp3+ cell numbers on tumor sections from AMPKα1Treg+/+ and AMPKα1Treg-/- mice (n = 5 in each group; data are presented as individual values and mean ± SD and analyzed by Student's t test). Five or more fields per tumor were quantified. Scale bar: 50 μm. (B) Quantification of FOXP3 fluorescence intensity in Foxp3+ cells. (n = 5 in each group; data are presented as individual values and mean ± SD and analyzed by Student's t test). Five or more fields per tumor were quantified. (C) Representative FACS images and percentage of CD4+YFP+ Treg cells in day-13 tumor tissues of AMPKα1Treg+/+ and AMPKα1Treg-/- mice (n = 7 in each group; data are presented as individual values and mean ± SD and analyzed by Student's t test). (D) Relative MFI of YFP and FOXP3 in tumor infiltrated CD4+YFP+ Treg cells of AMPKα1Treg+/+ and AMPKα1Treg-/- mice (n = 7 in each group; data are presented as individual values and mean ± SD and analyzed by Student's t test). (E) Representative FACS images and frequency of CD4+YFP+ Treg cells in the spleens of AMPKα1Treg+/+ and AMPKα1Treg-/- mice under steady state (n = 8 in each group; data are presented as individual values and mean ± SD and analyzed by Student's t test). (F) Relative MFI of YFP in CD4+YFP+ Treg cells from AMPKα1Treg+/+ and AMPKα1Treg-/- mice under steady state (n = 8 in each group; data are presented as individual values and mean ± SD and analyzed by Student's t test). (G) Representative FACS images and frequency of CD4+Foxp3+ Treg cells in the spleens of AMPKα1Treg+/+ and AMPKα1Treg-/- mice under steady state (n = 8 in each group; data are presented as individual values and mean ± SD and analyzed by Student's t test). (H) Relative MFI of FOXP3 in Treg cells from AMPKα1Treg+/+ and AMPKα1Treg-/- mice under steady state (n = 8 in each group; data are presented as individual values and mean ± SD and analyzed by Student's t test).
Figure 5
Figure 5
AMPKα1 maintains the protein stability of FOXP3 (A) Isolated primary Treg cells (CD4+YFP+) from AMPKα1Treg+/+ (WT) and AMPKα1Treg-/- (KO)mice were treated with Dynabeads CD3/CD28 beads at 1:1 ratio for 24 h. The expression of AMPKα1 and FOXP3 were detected by Western blot. (B) Quantification of relative AMPKα1 expression in Treg cells from AMPKα1Treg+/+ (WT) and AMPKα1Treg-/- (KO) mice stimulated with or without Dynabeads CD3/CD28 (n = 3 in each group; data are presented as individual values and mean ± SD and analyzed by Student's t test). (C) Quantification of relative FOXP3 expression in Treg cells from AMPKα1Treg+/+ (WT) and AMPKα1Treg-/- (KO) mice stimulated with or without Dynabeads CD3/CD28 (n = 3 in each group; data are presented as individual values and mean ± SD and analyzed by Student's t test). (D) Quantification of the increased FOXP3 level (ΔFoxp3) after CD3/CD28 treatment between Treg cells from AMPKα1Treg+/+ (WT) and AMPKα1Treg-/- (KO) mice (n = 3 in each group; data are presented as individual values and mean ± SD and analyzed by Student's t test). (E) Representative Western blot and quantification of FOXP3 protein levels in AMPKα1+/+ and AMPKα1Treg-/- Tregs (n = 5 in each group; data are presented as individual values and mean ± SD and analyzed by Student's t test). (F) Quantification of relative Foxp3 mRNA levels in in AMPKα1+/+ and AMPKα1Treg-/- Tregs (n = 6 in each group; data are presented as individual values and mean ± SD and analyzed by Student's t test). (G) Western blot and quantitative analysis of relative FOXP3 protein levels in HEK293T cells treated with cycloheximide (CHX) in combination with control vector or AMPKα1 plasmid (n = 3 in each group/time point; data are presented as mean ± SEM and analyzed by two-way ANOVA). (H) Western blot and quantitative analysis of relative FOXP3 protein levels in HEK293T cells treated with CHX in combination with siControl or siAMPKα1 (n = 3 in each group/time point; data are presented as mean ± SEM and analyzed by two-way ANOVA).
Figure 6
Figure 6
Deficiency of AMPKα1 promotes FOXP3 degradation through E3 ligase CHIP (A) Western blot and quantitative analysis of FOXP3 in AMPKα1-sufficient (AMPKα1+/+) and AMPKα1-deficient (AMPKα1Treg-/-) Treg cells (CD4+YFP+) in the presence or absence of proteasome inhibitor MG132 (n = 3 in each group; data are presented as individual values and mean ± SD and analyzed by Student's t test). (B) Effect of AMPKα1 knockdown on FOXP3 ubiquitination. Flag-Foxp3 together with siControl or siAMPKα1 was transfected into HEK293T cells. The cells were then treated with 5 μM MG132 for 4 h before harvest and lysis. Ubiquitination of FOXP3 proteins was detected by Western blot. (C) Western blot analysis of AMPKα1, USP7, CHIP, and FOXP3 protein levels in sorted AMPKα1-sufficient (AMPKα1Treg+/+) and AMPKα1-deficient (AMPKα1Treg-/-) Treg cells (CD4+YFP+). (D) Quantification of relative CHIP expression in sorted AMPKα1-sufficient (AMPKα1Treg+/+) and AMPKα1-deficient (AMPKα1Treg-/-) Treg cells (CD4+YFP+) (n = 3 in each group; data are presented as individual values and mean ± SD and analyzed by Student's t test). (E) Quantification of relative CHIP mRNA levels in sorted AMPKα1-sufficient (AMPKα1Treg+/+) and AMPKα1-deficient (AMPKα1Treg-/-) Treg cells (CD4+YFP+) (n = 6 in each group; data are presented as individual values and mean ± SD and analyzed by Student's t test). (F) Western blot analysis of FOXP3 protein levels in AMPKα1-sufficient (AMPKα1Treg+/+) and AMPKα1-deficient (AMPKα1Treg-/-) Treg cells (CD4+YFP+) in the presence of shControl lentivirus or shCHIP lentivirus. (G) Quantification of relative FOXP3 expression in AMPKα1-sufficient (AMPKα1Treg+/+) and AMPKα1-deficient (AMPKα1Treg-/-) Treg cells (CD4+YFP+) in the presence of shControl or shCHIP lentivirus (n = 4 in each group; data are presented as individual values and mean ± SD and analyzed by Student's t test).

References

    1. Bacchetta R., Barzaghi F., Roncarolo M.G. From IPEX syndrome to FOXP3 mutation: A lesson on immune dysregulation. Ann. N. Y Acad. Sci. 2018;1417:5–22. - PubMed
    1. Barbi J., Pardoll D.M., Pan F. Ubiquitin-dependent regulation of Foxp3 and Treg function. Immunol. Rev. 2015;266:27–45. - PMC - PubMed
    1. Bennett C.L., Christie J., Ramsdell F., Brunkow M.E., Ferguson P.J., Whitesell L., Kelly T.E., Saulsbury F.T., Chance P.F., Ochs H.D. The immune dysregulation, polyendocrinopathy, enteropathy, X-linked syndrome (IPEX) is caused by mutations of FOXP3. Nat. Genet. 2001;27:20–21. - PubMed
    1. Bonney K.M., Taylor J.M., Thorp E.B., Epting C.L., Engman D.M. Depletion of regulatory T cells decreases cardiac parasitosis and inflammation in experimental Chagas disease. Parasitol. Res. 2015;114:1167–1178. - PMC - PubMed
    1. Borst J., Ahrends T., Babala N., Melief C.J.M., Kastenmuller W. CD4(+) T cell help in cancer immunology and immunotherapy. Nat. Rev. Immunol. 2018;18:635–647. - PubMed

LinkOut - more resources