Small spot size versus large spot size: Effect on plan quality for lung cancer in pencil beam scanning proton therapy
- PMID: 34989458
- PMCID: PMC8833272
- DOI: 10.1002/acm2.13512
Small spot size versus large spot size: Effect on plan quality for lung cancer in pencil beam scanning proton therapy
Abstract
Purpose: The purpose of the current study was to evaluate the impact of spot size on the interplay effect, plan robustness, and dose to the organs at risk for lung cancer plans in pencil beam scanning (PBS) proton therapy METHODS: The current retrospective study included 13 lung cancer patients. For each patient, small spot (∼3 mm) plans and large spot (∼8 mm) plans were generated. The Monte Carlo algorithm was used for both robust plan optimization and final dose calculations. Each plan was normalized, such that 99% of the clinical target volume (CTV) received 99% of the prescription dose. Interplay effect was evaluated for treatment delivery starting in two different breathing phases (T0 and T50). Plan robustness was investigated for 12 perturbed scenarios, which combined the isocenter shift and range uncertainty. The nominal and worst-case scenario (WCS) results were recorded for each treatment plan. Equivalent uniform dose (EUD) and normal tissue complication probability (NTCP) were evaluated for the total lung, heart, and esophagus.
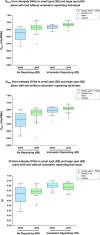
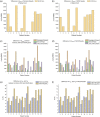
Results: In comparison to large spot plans, the WCS values of small spot plans at CTV D95% , D96% , D97% , D98% , and D99% were higher with the average differences of 2.2% (range, 0.3%-3.7%), 2.3% (range, 0.5%-4.0%), 2.6% (range, 0.6%-4.4%), 2.7% (range, 0.9%-5.2%), and 2.7% (range, 0.3%-6.0%), respectively. The nominal and WCS mean dose and EUD for the esophagus, heart, and total lung were higher in large spot plans. The difference in NTCP between large spot and small spot plans was up to 1.9% for the total lung, up to 0.3% for the heart, and up to 32.8% for the esophagus. For robustness acceptance criteria of CTV D95% ≥ 98% of the prescription dose, seven small spot plans had all 12 perturbed scenarios meeting the criteria, whereas, for 13 large spot plans, there were ≥2 scenarios failing to meet the criteria. Interplay results showed that, on average, the target coverage in large spot plans was higher by 1.5% and 0.4% in non-volumetric and volumetric repainting plans, respectively.
Conclusion: For robustly optimized PBS lung cancer plans in our study, a small spot machine resulted in a more robust CTV against the setup and range errors when compared to a large spot machine. In the absence of volumetric repainting, large spot PBS lung plans were more robust against the interplay effect. The use of a volumetric repainting technique in both small and large spot PBS lung plans led to comparable interplay target coverage.
Keywords: NTCP; interplay; lung cancer; pencil beam scanning; plan robustness; proton therapy.
© 2022 The Authors. Journal of Applied Clinical Medical Physics published by Wiley Periodicals, LLC on behalf of The American Association of Physicists in Medicine.
Conflict of interest statement
The authors declare that they have no conflict of interest.
Figures


References
-
- Zhang X, Li Y, Pan X, et al. Intensity‐modulated proton therapy reduces the dose to normal tissue compared with intensity‐modulated radiation therapy or passive scattering proton therapy and enables individualized radical radiotherapy for extensive stage IIIB non‐small‐cell lung cancer: a virtual clinical study. Int J Radiat Oncol Biol Phys. 2010;77(2):357‐366. - PMC - PubMed
-
- Lomax AJ. Intensity modulated proton therapy and its sensitivity to treatment uncertainties 1: the potential effects of calculational uncertainties. Phys Med Biol. 2008;53(4):1027‐1042. - PubMed
-
- Fredriksson A, Forsgren A, Hardemark B. Minimax optimization for handling range and setup uncertainties in proton therapy. Med Phys. 2011;38(3):1672‐1684. - PubMed
MeSH terms
LinkOut - more resources
Full Text Sources
Medical

