

Whole-Blood 3-Gene Signature as a Decision Aid for Rifapentine-based Tuberculosis Preventive Therapy
- PMID: 34989801
- PMCID: PMC9477448
- DOI: 10.1093/cid/ciac003
Whole-Blood 3-Gene Signature as a Decision Aid for Rifapentine-based Tuberculosis Preventive Therapy
Abstract
Background: Systemic drug reaction (SDR) is a major safety concern with weekly rifapentine plus isoniazid for 12 doses (3HP) for latent tuberculosis infection (LTBI). Identifying SDR predictors and at-risk participants before treatment can improve cost-effectiveness of the LTBI program.
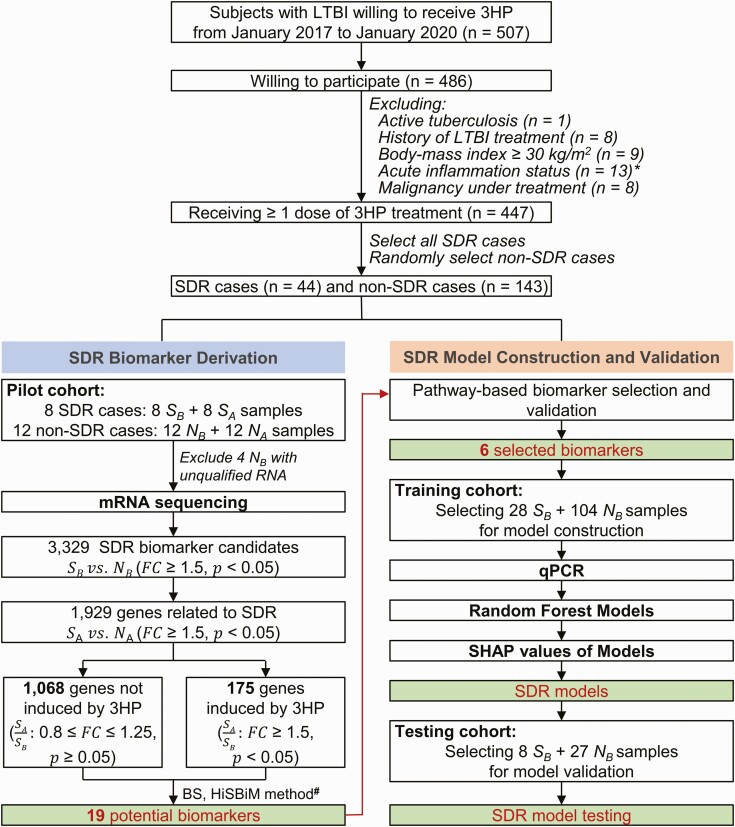
Methods: We prospectively recruited 187 cases receiving 3HP (44 SDRs and 143 non-SDRs). A pilot cohort (8 SDRs and 12 non-SDRs) was selected for generating whole-blood transcriptomic data. By incorporating the hierarchical system biology model and therapy-biomarker pathway approach, candidate genes were selected and evaluated using reverse-transcription quantitative polymerase chain reaction (RT-qPCR). Then, interpretable machine learning models presenting as SHapley Additive exPlanations (SHAP) values were applied for SDR risk prediction. Finally, an independent cohort was used to evaluate the performance of these predictive models.
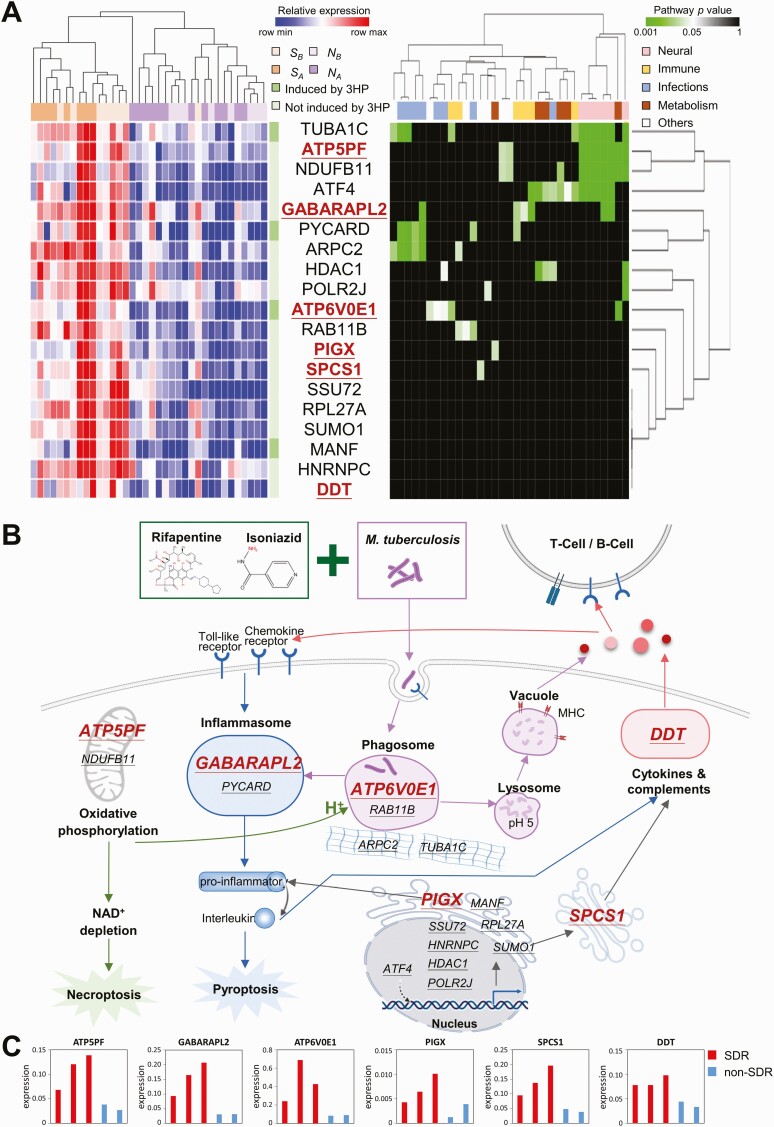
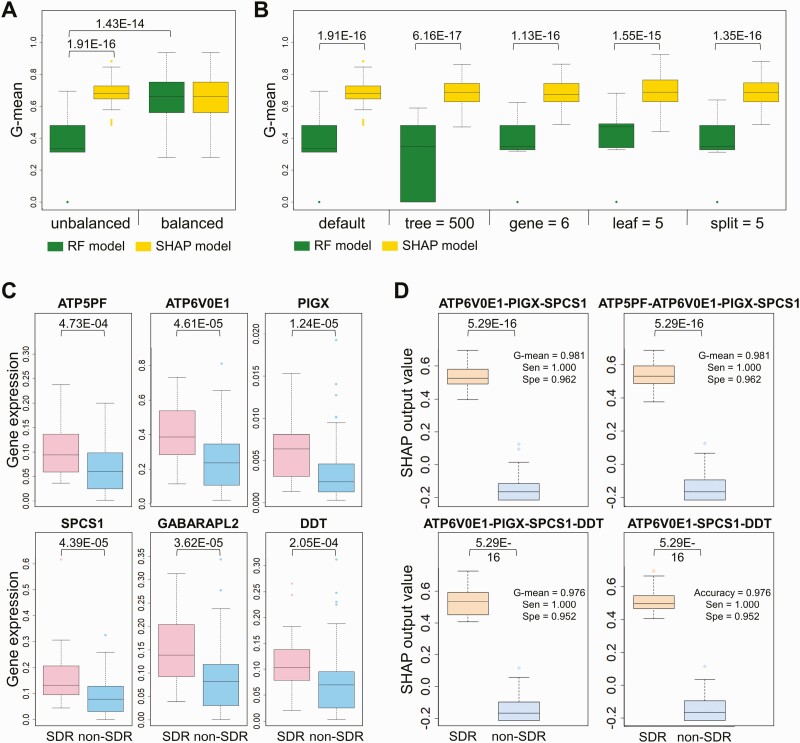
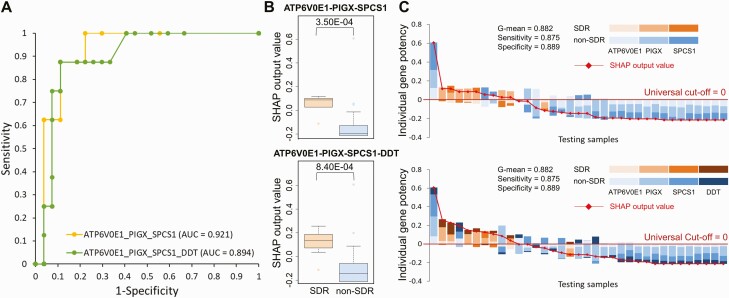
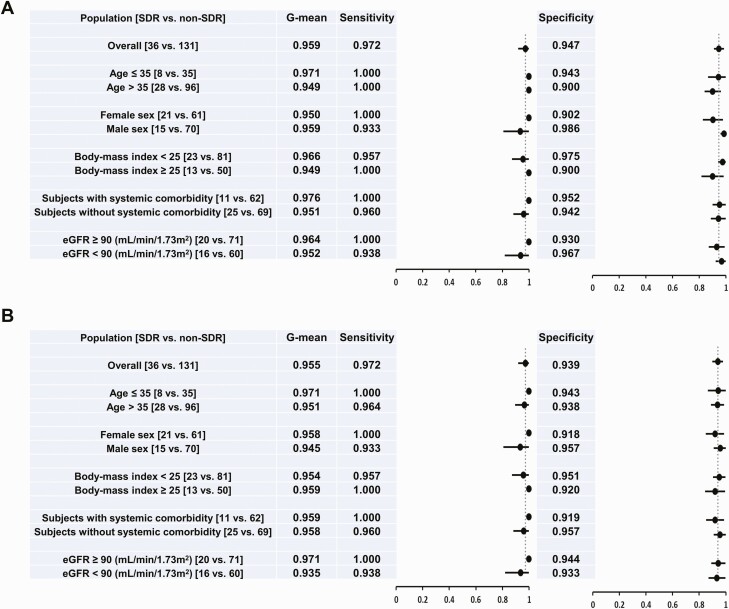
Results: Based on the whole-blood transcriptomic profile of the pilot cohort and the RT-qPCR results of 2 SDR and 3 non-SDR samples in the training cohort, 6 genes were selected. According to SHAP values for model construction and validation, a 3-gene model for SDR risk prediction achieved a sensitivity and specificity of 0.972 and 0.947, respectively, under a universal cutoff value for the joint of the training (28 SDRs and 104 non-SDRs) and testing (8 SDRs and 27 non-SDRs) cohorts. It also worked well across different subgroups.
Conclusions: The prediction model for 3HP-related SDRs serves as a guide for establishing a safe and personalized regimen to foster the implementation of an LTBI program. Additionally, it provides a potential translational value for future studies on drug-related hypersensitivity.
Keywords: interpretable machine learning; latent tuberculosis infection; rifapentine; systemic drug reaction; transcriptome.
© The Author(s) 2022. Published by Oxford University Press for the Infectious Diseases Society of America.
Conflict of interest statement
Potential conflicts of interest. All authors: No reported conflicts of interest. All authors have submitted the ICMJE Form for Disclosure of Potential Conflicts of Interest.
Figures
Similar articles
-
One-month daily and three-month weekly rifapentine plus isoniazid are comparable in completion rate and safety for latent tuberculosis infection in non-HIV Population: a randomized controlled trial.Clin Microbiol Infect. 2024 Nov;30(11):1410-1417. doi: 10.1016/j.cmi.2024.06.024. Epub 2024 Jul 10. Clin Microbiol Infect. 2024. PMID: 38996972 Clinical Trial.
-
Flu-like and Other Systemic Drug Reactions Among Persons Receiving Weekly Rifapentine Plus Isoniazid or Daily Isoniazid for Treatment of Latent Tuberculosis Infection in the PREVENT Tuberculosis Study.Clin Infect Dis. 2015 Aug 15;61(4):527-35. doi: 10.1093/cid/civ323. Epub 2015 Apr 22. Clin Infect Dis. 2015. PMID: 25904367 Free PMC article. Clinical Trial.
-
Symptoms and Systemic Drug Reactions in Persons Receiving Weekly Rifapentine Plus Isoniazid (3HP) Treatment for Latent Tuberculosis Infection.Clin Infect Dis. 2023 Jun 16;76(12):2090-2097. doi: 10.1093/cid/ciad083. Clin Infect Dis. 2023. PMID: 36815322 Free PMC article.
-
Hepatotoxicity, efficacy and completion rate between 3 months of isoniazid plus rifapentine and 9 months of isoniazid in treating latent tuberculosis infection: A systematic review and meta-analysis.J Chin Med Assoc. 2021 Nov 1;84(11):993-1000. doi: 10.1097/JCMA.0000000000000605. J Chin Med Assoc. 2021. PMID: 34747900
-
Adverse events associated with weekly short course isoniazid and rifapentine therapy in pediatric patients with latent tuberculosis: A chart and literature review.Pediatr Pulmonol. 2021 Aug;56(8):2695-2699. doi: 10.1002/ppul.25456. Epub 2021 May 18. Pediatr Pulmonol. 2021. PMID: 33969644 Review.
Cited by
-
Management of tuberculosis risk, screening and preventive therapy in patients with chronic autoimmune arthritis undergoing biotechnological and targeted immunosuppressive agents.Front Immunol. 2025 Feb 3;16:1494283. doi: 10.3389/fimmu.2025.1494283. eCollection 2025. Front Immunol. 2025. PMID: 39963138 Free PMC article. Review.
-
Reply to Chang and Huang.Clin Infect Dis. 2022 Nov 14;75(10):1867. doi: 10.1093/cid/ciac574. Clin Infect Dis. 2022. PMID: 35833899 Free PMC article. No abstract available.
-
Identification of MORN3 and LLGL2 as novel diagnostic biomarkers for latent tuberculosis infection using machine learning strategies and experimental verification.Ann Med. 2024 Dec;56(1):2380797. doi: 10.1080/07853890.2024.2380797. Epub 2024 Jul 25. Ann Med. 2024. PMID: 39054612 Free PMC article.
-
Deep learning explains the biology of branched glycans from single-cell sequencing data.iScience. 2022 Sep 19;25(10):105163. doi: 10.1016/j.isci.2022.105163. eCollection 2022 Oct 21. iScience. 2022. PMID: 36217547 Free PMC article.
-
Advancing tuberculosis management: the role of predictive, preventive, and personalized medicine.Front Microbiol. 2023 Oct 4;14:1225438. doi: 10.3389/fmicb.2023.1225438. eCollection 2023. Front Microbiol. 2023. PMID: 37860132 Free PMC article. Review.
References
-
- Pai M, Behr MA, Dowdy D, et al. Tuberculosis. Nat Rev Dis Primers 2016; 2:16076. - PubMed
-
- World Health Organization. WHO Guidelines Approved by the Guidelines Review Committee. WHO consolidated guidelines on tuberculosis: tuberculosis preventive treatment: module 1: prevention. Geneva, Switzerland: World Health Organization, 2020. https://www.who.int/publications/i/item/9789240001503. Accessed 15 December 2021.
-
- Walker RE, Bass S, Srinivas P, Miranda C, Johnson L, Pallotta AM.. Evaluation of 3 months of once-weekly rifapentine and isoniazid for latent tuberculosis infection. Ann Pharmacother 2020; 54:457–63. - PubMed
Publication types
MeSH terms
Substances
LinkOut - more resources
Full Text Sources
Medical
Molecular Biology Databases
Miscellaneous
