

Cytoarchitectonic parcellation and functional characterization of four new areas in the caudal parahippocampal cortex
- PMID: 34989871
- PMCID: PMC9046293
- DOI: 10.1007/s00429-021-02441-2
Cytoarchitectonic parcellation and functional characterization of four new areas in the caudal parahippocampal cortex
Abstract
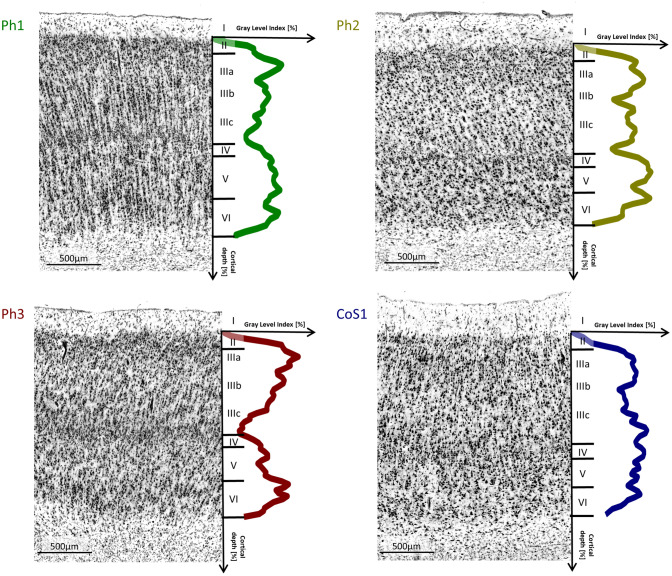
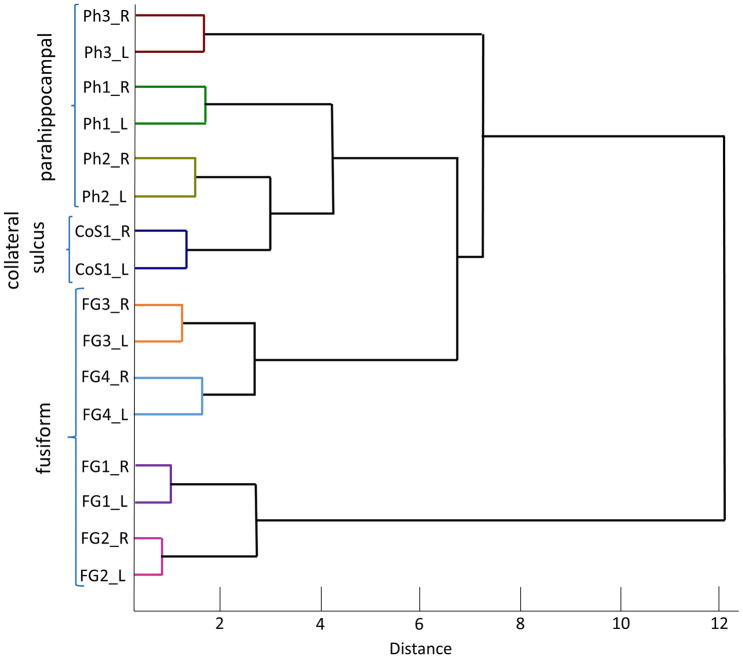
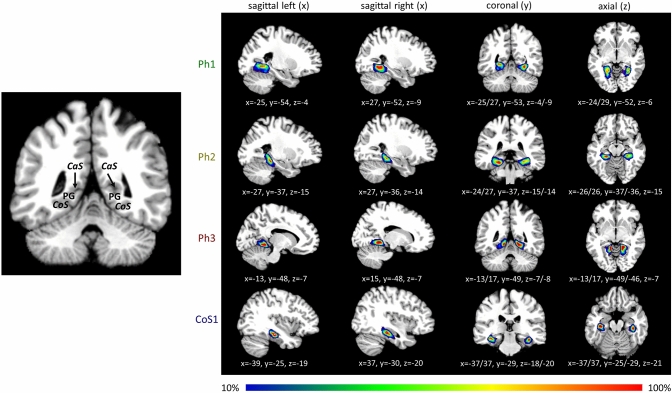
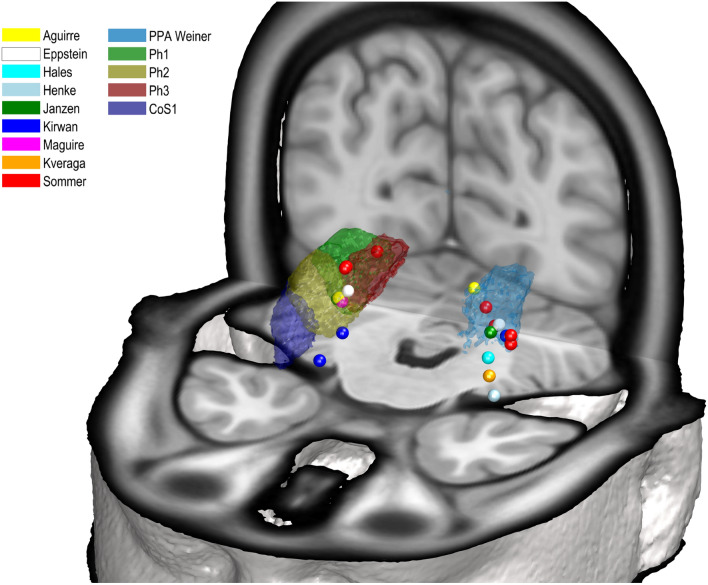
Brain areas at the parahippocampal gyrus of the temporal-occipital transition region are involved in different functions including processing visual-spatial information and episodic memory. Results of neuroimaging experiments have revealed a differentiated functional parcellation of this region, but its microstructural correlates are less well understood. Here we provide probability maps of four new cytoarchitectonic areas, Ph1, Ph2, Ph3 and CoS1 at the parahippocampal gyrus and collateral sulcus. Areas have been identified based on an observer-independent mapping of serial, cell-body stained histological sections of ten human postmortem brains. They have been registered to two standard reference spaces, and superimposed to capture intersubject variability. The comparison of the maps with functional imaging data illustrates the different involvement of the new areas in a variety of functions. Maps are available as part of Julich-Brain atlas and can be used as anatomical references for future studies to better understand relationships between structure and function of the caudal parahippocampal cortex.
Keywords: Collateral sulcus; Cytoarchitecture; Human brain mapping; Julich-Brain; Parahippocampal gyrus; Parahippocampal place area.
© 2022. The Author(s).
Conflict of interest statement
The authors declare that there is no conflict of interest.
Figures


Similar articles
-
Cytoarchitecture, intersubject variability, and 3D mapping of four new areas of the human anterior prefrontal cortex.Front Neuroanat. 2022 Aug 11;16:915877. doi: 10.3389/fnana.2022.915877. eCollection 2022. Front Neuroanat. 2022. PMID: 36032993 Free PMC article.
-
Ventral visual cortex in humans: cytoarchitectonic mapping of two extrastriate areas.Hum Brain Mapp. 2007 Oct;28(10):1045-59. doi: 10.1002/hbm.20348. Hum Brain Mapp. 2007. PMID: 17266106 Free PMC article.
-
Four new cytoarchitectonic areas surrounding the primary and early auditory cortex in human brains.Cortex. 2020 Jul;128:1-21. doi: 10.1016/j.cortex.2020.02.021. Epub 2020 Mar 14. Cortex. 2020. PMID: 32298845
-
Adolf Hopf's 1954 myeloarchitectonic parcellation of the human temporal lobe: a review and assessment.Brain Res Bull. 2011 Nov 25;86(5-6):298-313. doi: 10.1016/j.brainresbull.2011.08.010. Epub 2011 Aug 22. Brain Res Bull. 2011. PMID: 21888952 Review.
-
Anatomy of the temporal lobe: From macro to micro.Handb Clin Neurol. 2022;187:17-51. doi: 10.1016/B978-0-12-823493-8.00009-2. Handb Clin Neurol. 2022. PMID: 35964970 Review.
Cited by
-
Understanding structure-function relationships in the mammalian visual system: part two.Brain Struct Funct. 2022 May;227(4):1167-1170. doi: 10.1007/s00429-022-02495-w. Brain Struct Funct. 2022. PMID: 35419751 No abstract available.
-
Comparison of histological delineations of medial temporal lobe cortices by four independent neuroanatomy laboratories.Hippocampus. 2024 May;34(5):241-260. doi: 10.1002/hipo.23602. Epub 2024 Feb 28. Hippocampus. 2024. PMID: 38415962 Free PMC article.
-
Self-esteem mediates the relationship between the parahippocampal gyrus and decisional procrastination at resting state.Front Neurosci. 2024 Mar 19;18:1341142. doi: 10.3389/fnins.2024.1341142. eCollection 2024. Front Neurosci. 2024. PMID: 38567283 Free PMC article.
-
Hierarchical microstructural tissue growth of the gray and white matter of human visual cortex during the first year of life.bioRxiv [Preprint]. 2025 Jun 22:2025.06.20.660718. doi: 10.1101/2025.06.20.660718. bioRxiv. 2025. PMID: 40666947 Free PMC article. Preprint.
References
MeSH terms
Grants and funding
LinkOut - more resources
Full Text Sources
