. 2022 Feb 8;7(3):e146563.
doi: 10.1172/jci.insight.146563.

Human CD206+ macrophages associate with diabetes and adipose tissue lymphoid clusters

Affiliations

Human CD206+ macrophages associate with diabetes and adipose tissue lymphoid clusters

Lindsey A Muir et al. JCI Insight. .

Abstract

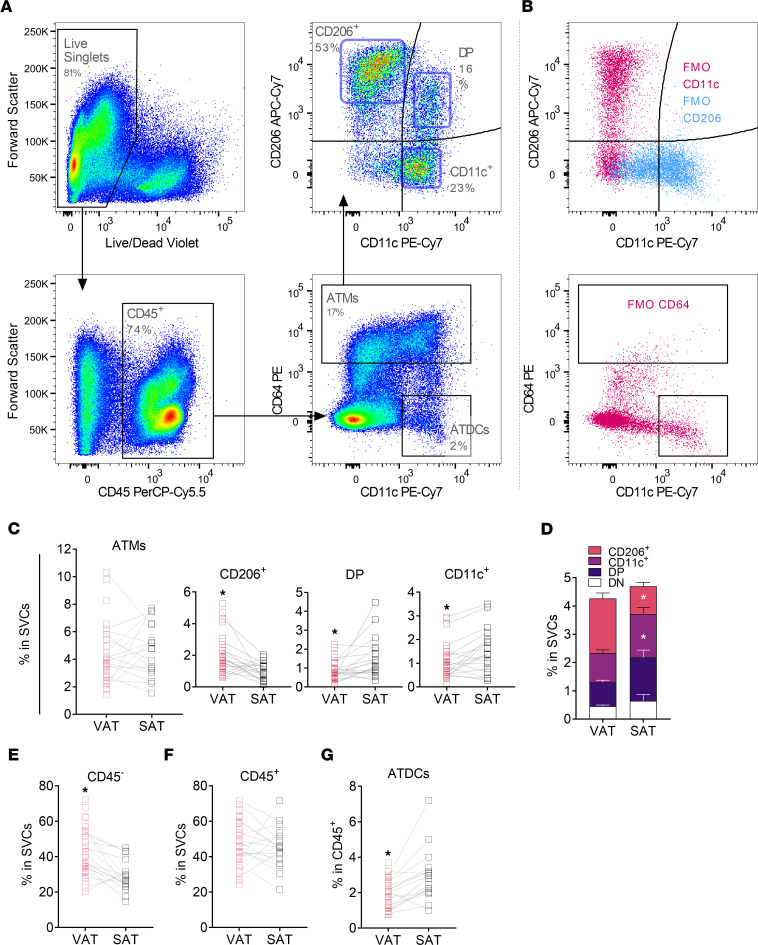
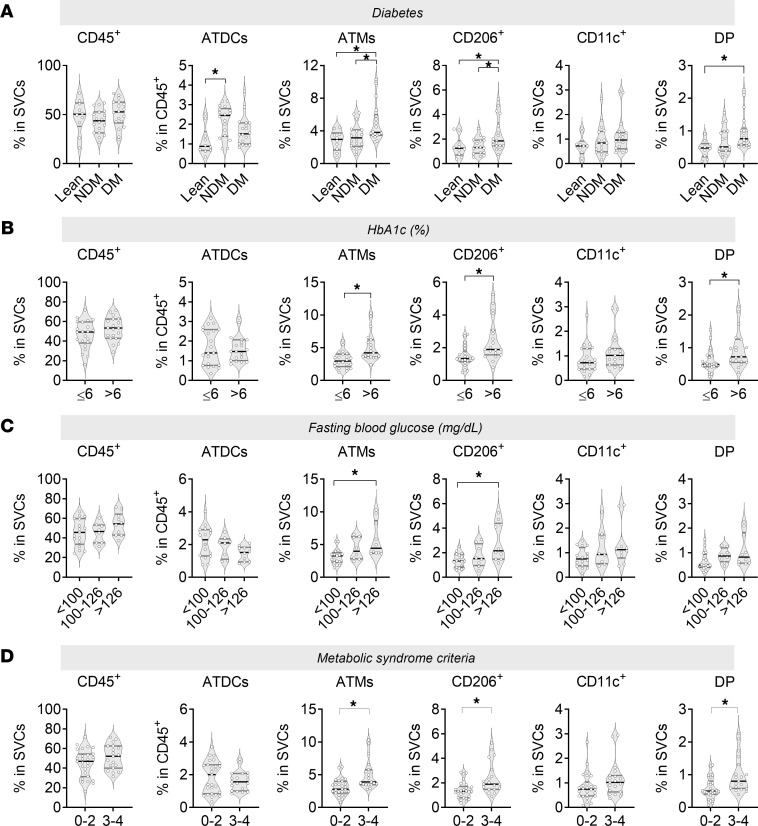
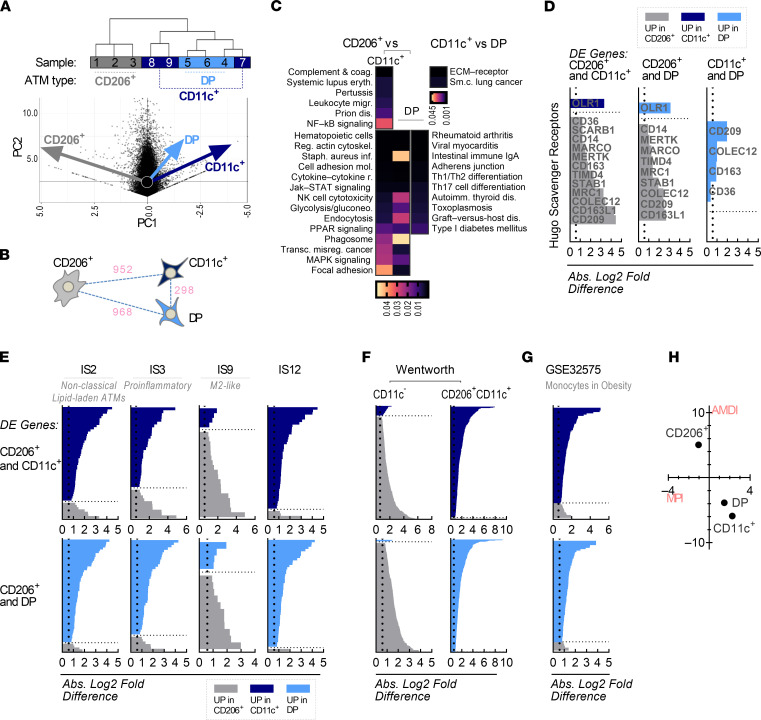
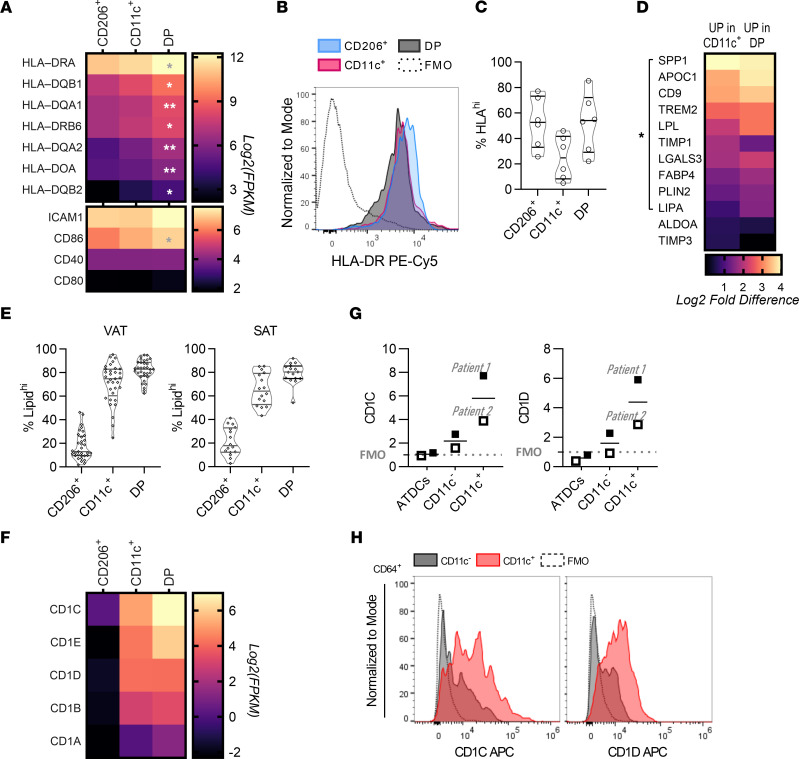
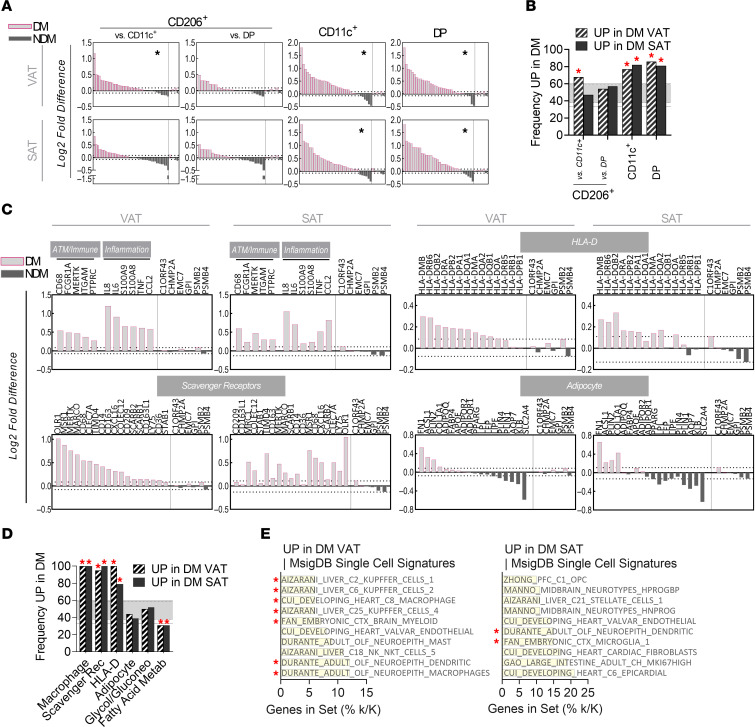
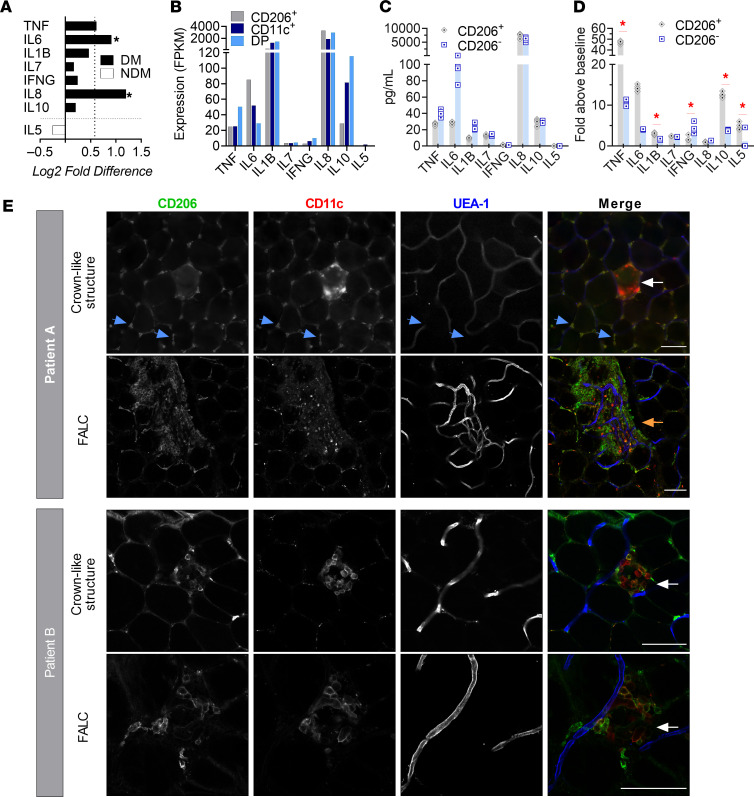
Increased adipose tissue macrophages (ATMs) correlate with metabolic dysfunction in humans and are causal in development of insulin resistance in mice. Recent bulk and single-cell transcriptomics studies reveal a wide spectrum of gene expression signatures possible for macrophages that depends on context, but the signatures of human ATM subtypes are not well defined in obesity and diabetes. We profiled 3 prominent ATM subtypes from human adipose tissue in obesity and determined their relationship to type 2 diabetes. Visceral adipose tissue (VAT) and s.c. adipose tissue (SAT) samples were collected from diabetic and nondiabetic obese participants to evaluate cellular content and gene expression. VAT CD206+CD11c- ATMs were increased in diabetic participants, were scavenger receptor-rich with low intracellular lipids, secreted proinflammatory cytokines, and diverged significantly from 2 CD11c+ ATM subtypes, which were lipid-laden, were lipid antigen presenting, and overlapped with monocyte signatures. Furthermore, diabetic VAT was enriched for CD206+CD11c- ATM and inflammatory signatures, scavenger receptors, and MHC II antigen presentation genes. VAT immunostaining found CD206+CD11c- ATMs concentrated in vascularized lymphoid clusters adjacent to CD206-CD11c+ ATMs, while CD206+CD11c+ were distributed between adipocytes. Our results show ATM subtype-specific profiles that uniquely contribute to the phenotypic variation in obesity.

Keywords: Adipose tissue; Diabetes; Immunology; Macrophages; Metabolism.


Conflict of interest statement

Conflict of interest: The authors have declared that no conflict of interest exists.

Figures

Figure 1
Figure 1. Human ATMs in VAT and SAT.
(A) Gating scheme used to identify and isolate adipose tissue macrophages (ATM) and adipose tissue DCs (ATDC). (B) Three fluorescence minus one (FMO) controls which excluded immunostaining for CD11c (FMO CD11c), CD206 (FMO CD206), or CD64 (FMO CD64). (C) Variation in ATM frequencies between VAT and SAT depots. (D) Stacked bar graph showing proportions of ATM subtypes in VAT and SAT. (E and F) Frequency of CD45 or CD45+ cells within SVCs. (G) Frequency of ATDCs within CD45+ cells. Nonparametric paired t test (Wilcoxon matched-pairs signed-rank test); *P < 0.05; VAT, n = 36; SAT, n = 18. DP, double positive; DN, double negative.
Figure 2
Figure 2. VAT SVC frequencies of patients stratified by diagnoses or clinical criteria.
(A) Patients stratified into lean, obese NDM, or obese DM. (B) Patients stratified into HbA1c (%) less than or greater than 6%. (C) Patients stratified by fasting blood glucose (mg/dL) into groups at low risk (<100 mg/dL), considered at risk (100–126 mg/dL), and considered diabetic (>126 mg/dL). (D) Patients stratified by a lower (0–2 criteria) or a higher (3–4 criteria) number of criteria for metabolic syndrome (MetS). Lean: n = 18; obese: n = 10. *P < 0.05, using unpaired t test with Welch’s correction for 2 groups or 1-way ANOVA with Holm-Sidak adjustment for multiple comparisons. Boxes span the 25th–75th percentiles with the mean, and whiskers are minimum to maximum.
Figure 3
Figure 3. CD206+ ATMs are distinct from other subtypes.
(A) Dendrogram based on the top 500 variably expressed genes (left) and PCA (right) of human ATM subtypes. The 3 ATM subtypes were each isolated from 3 patient samples with obesity (2 DM, 1 NDM) for a total of 9 analyzed cell populations. (B) Distance diagram between ATM subtypes based on DE genes for each comparison. (C) Top pathways distinguishing ATM subtypes. (D) Scavenger receptor–related gene expression in ATM subtypes. (E) Overlap of ATM subtypes with Vijay et al. data (13). Fold difference in expression for each comparison is shown, with gray bars showing expression in CD206+ ATMs, dark blue in CD11c+ ATMs, and light blue in DP ATMs. Overlap was defined as a higher percentage of mutual genes than the overall mean percentage of mutual genes across all 5 Vijay populations. (F) Overlap of ATM subtypes with Wentworth et al. data (9). (G) Overlap of ATM subtypes with monocytes in obesity (GSE32575). (H) MacSpectrum analysis of ATM subtypes. MPI, macrophage polarization index; AMDI, activation induced differentiation index.
Figure 4
Figure 4. CD206+ ATMs have distinct HLA expression and lipid accumulation.
(A) Heatmap of HLA-D and costimulatory gene expression in ATM subtypes (log2 transformed FPKM). (B) Surface HLA-DR in ATM subtypes by flow cytometry (counts normalized to mode). (C) Frequency of ATM subtypes with high surface expression of HLA-DR. (D) Expression of literature-curated lipid-laden macrophage markers in CD11c+ and DP ATMs compared with CD206+ ATMs. * indicates DE in the given ATMs compared with CD206+ ATMs. (E) Frequency of lipid-laden cells within ATM subtypes. (F) Heatmap of expression of CD1 lipid antigen presentation genes in ATM subtypes. (G and H) Flow cytometry analysis of CD1C and CD1D on ATM subtypes and ATDCs.
Figure 5
Figure 5. Gene expression signatures in DM and NDM adipose tissues.
(A) Gene expression signatures unique to human ATM subtypes, queried in DM and NDM adipose tissues. Within each plot, to the right of the dividing vertical bar are housekeeping genes used to set a standard reference point for low variance in adipose tissues. Dotted lines show the largest positive and negative fold value for the housekeeping genes. (B) Quantification of frequency of genes within the gene sets that were increased in DM adipose. Random genes were determined through 10 iterations of random ranking and selection of the top 20 genes, followed by calculation of the frequency of genes increased in DM adipose. (C) Expression of gene sets representing macrophages and inflammation, scavenger receptors, and HLA-D in DM and NDM adipose tissues. An adipocyte signature exemplifies expression that was not biased toward DM. (D) Quantification of frequency of genes within the gene sets that were increased in DM adipose. Random genes were determined through 10 iterations of random ranking and selection of the top 20 genes, followed by calculation of the frequency of genes increased in DM adipose. Shaded band indicates the SD of the random samples of genes increased in DM VAT (band with solid lines) and in DM SAT (band with dotted lines). (E) Top 10 single cell signatures based on query of DE genes from DM VAT (top) and DM SAT (bottom), ranked by q value. Asterisks highlight signatures related to myeloid cells. Unless otherwise defined, asterisks indicate deviation of a gene set from the range of the random gene sets
Figure 6
Figure 6. ATM subtype cytokine secretion and localization.
(A) Expression of cytokines in NDM and DM obese whole visceral adipose tissue. Data are shown as mean FPKM log2-fold difference. (B) Expression of cytokines in CD206+ and CD11c+ ATMs by RNA-Seq. (C) Baseline cytokine secretion from sorted CD206+ or CD206 VAT ATMs, shown as mean concentration. (D) Cytokine secretion from sorted, LPS-stimulated CD206+ or CD206 VAT ATMs. Each replicate was normalized to baseline, and measures are shown as mean fold over baseline ± SD. (C and D) Replicates: n = 3–4 wells per measure. Raw data were analyzed by 2-way ANOVA with Sidak’s multiple comparison test. (E) Immunostaining for CD206 (green) and CD11c (red) in 2 human visceral adipose tissue samples in obesity. CD206 and CD11c show differential expression in CLS (white arrows) and FALC (orange arrow), but they show coexpress in cells between adipocytes (blue arrows). Blood vessels (blue) were stained with UEA-1 lectin. Scale bar: 100 μm. Row 1: epifluorescence microscopy. Rows 2–4: confocal microscopy.

Similar articles

Cited by

References

    1. Kruglikov IL, et al. Obesity and diabetes as comorbidities for COVID-19: underlying mechanisms and the role of viral-bacterial interactions. Elife. 2020;9:e61330. doi: 10.7554/eLife.61330. - DOI - PMC - PubMed
    1. Muir LA, et al. Frontline science: rapid adipose tissue expansion triggers unique proliferation and lipid accumulation profiles in adipose tissue macrophages. J Leukoc Biol. 2018;103(4):615–628. doi: 10.1002/JLB.3HI1017-422R. - DOI - PMC - PubMed
    1. Lumeng CN, et al. Increased inflammatory properties of adipose tissue macrophages recruited during diet-induced obesity. Diabetes. 2007;56(1):16–23. doi: 10.2337/db06-1076. - DOI - PubMed
    1. Lumeng CN, et al. Obesity induces a phenotypic switch in adipose tissue macrophage polarization. J Clin Invest. 2007;117(1):175–184. doi: 10.1172/JCI29881. - DOI - PMC - PubMed
    1. Cho KW, et al. Adipose tissue dendritic cells are independent contributors to obesity-induced inflammation and insulin resistance. J Immunol. 2016;197(9):3650–3661. doi: 10.4049/jimmunol.1600820. - DOI - PMC - PubMed

Publication types

MeSH terms