

Pandemic-related declines in hospitalization for non-COVID-19-related illness in the United States from January through July 2020
- PMID: 34990489
- PMCID: PMC8735608
- DOI: 10.1371/journal.pone.0262347
Pandemic-related declines in hospitalization for non-COVID-19-related illness in the United States from January through July 2020
Abstract
Background: The COVID-19 pandemic, caused by the novel severe acute respiratory syndrome coronavirus 2 (SARS-CoV-2), has substantially impacted healthcare utilization worldwide. The objective of this retrospective analysis of a large hospital discharge database was to compare all-cause and cause-specific hospitalizations during the first six months of the pandemic in the United States with the same months in the previous four years.
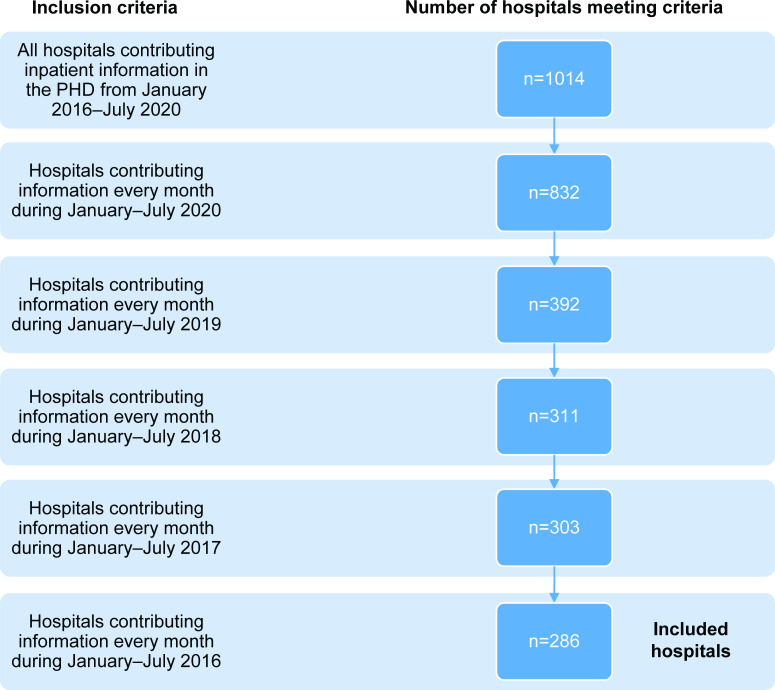
Methods: Data were collected from all hospitals in the Premier Healthcare Database (PHD) and PHD Special Release reporting hospitalizations from January through July for each year from 2016 through 2020. Hospitalization trends were analyzed stratified by age group, major diagnostic categories (MDCs), and geographic region.
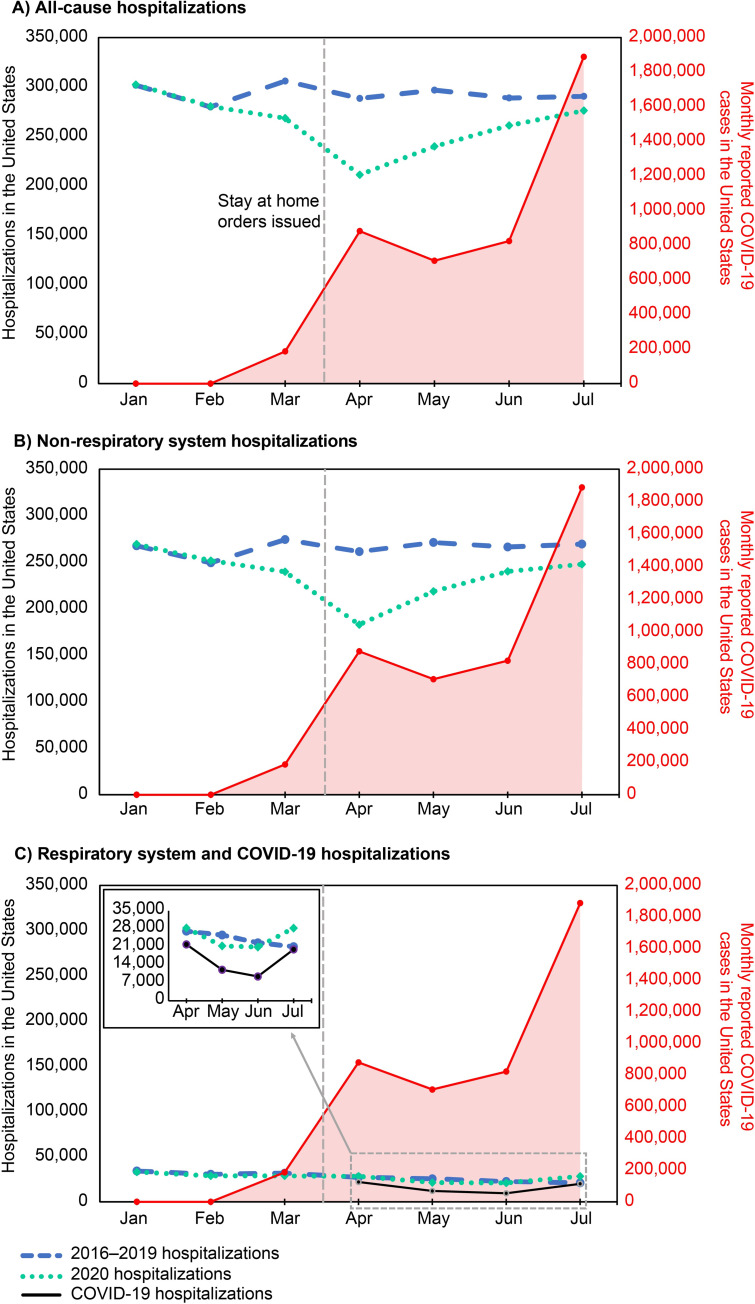
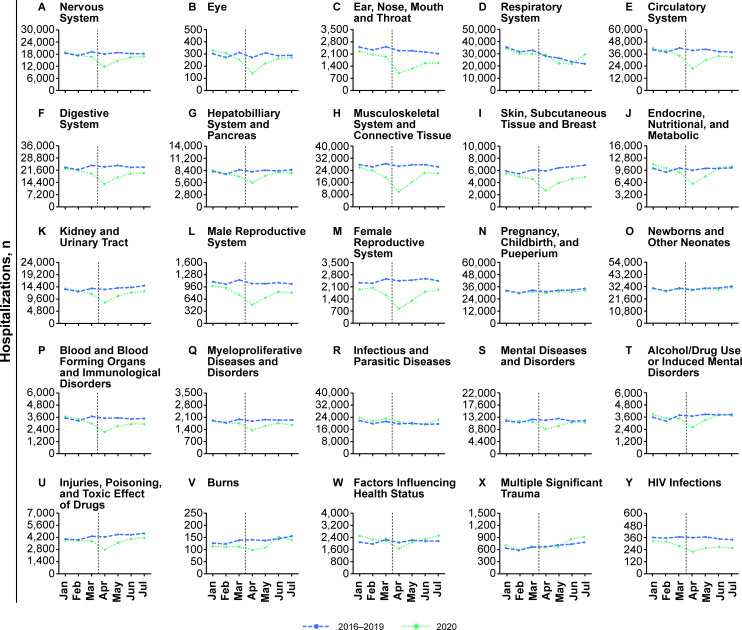
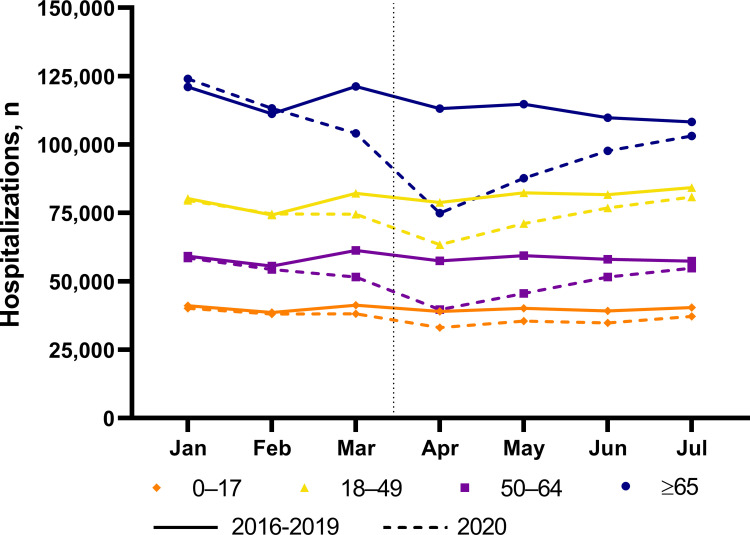
Results: The analysis included 286 hospitals from all 9 US Census divisions. The number of all-cause hospitalizations per month was relatively stable from 2016 through 2019 and then fell by 21% (57,281 fewer hospitalizations) between March and April 2020, particularly in hospitalizations for non-respiratory illnesses. From April onward there was a rise in the number of monthly hospitalizations per month. Hospitalizations per month, nationally and in each Census division, decreased for 20 of 25 MDCs between March and April 2020. There was also a decrease in hospitalizations per month for all age groups between March and April 2020 with the greatest decreases in hospitalizations observed for patients 50-64 and ≥65 years of age.
Conclusions: Rates of hospitalization declined substantially during the first months of the COVID-19 pandemic, suggesting delayed routine, elective, and emergency care in the United States. These lapses in care for illnesses not related to COVID-19 may lead to increases in morbidity and mortality for other conditions. Thus, in the current stage of the pandemic, clinicians and public-health officials should work, not only to prevent SARS-CoV-2 transmission, but also to ensure that care for non-COVID-19 conditions is not delayed.
Conflict of interest statement
F.J.A, M.B, B.E, J.H, F.K, D.M, J.M.M, J.L.N, M.R, and D.L.S. are or were employees of Pfizer Inc and may hold stock or stock options. This does not alter our adherence to PLOS ONE policies on sharing data and materials.
Figures
References
-
- Centers for Disease Control and Prevention. Estimated Disease Burden of COVID-19 2021 [updated January 19; cited 2021 February 22]. Available from: https://www.cdc.gov/coronavirus/2019-ncov/cases-updates/burden.html.
-
- Prevention CfDCa. CDC COVID Data Tracker 2021. [updated January 12 2021; cited 2021 January 12]. Available from: https://covid.cdc.gov/covid-data-tracker/#trends_dailytrendscases.
-
- Federal Government of the United States of America. Declaring a national emergency concerning the novel coronavirus disease (COVID–19) outbreak. 2020 March 18. Report No.
-
- Centers for Disease Control and Prevention. Framework for healthcare systems providing non-COVID-19 clinical care during the COVID-19 pandemic 2020 [updated June 30; cited 2020 December 2]. Available from: https://www.cdc.gov/coronavirus/2019-ncov/hcp/framework-non-COVID-care.html.
Publication types
MeSH terms
LinkOut - more resources
Full Text Sources
Miscellaneous
