. 2022 Mar 2;110(5):783-794.e6.
doi: 10.1016/j.neuron.2021.12.003. Epub 2022 Jan 5.

Local feedback inhibition tightly controls rapid formation of hippocampal place fields

Affiliations

Local feedback inhibition tightly controls rapid formation of hippocampal place fields

Sebi V Rolotti et al. Neuron. .

Abstract

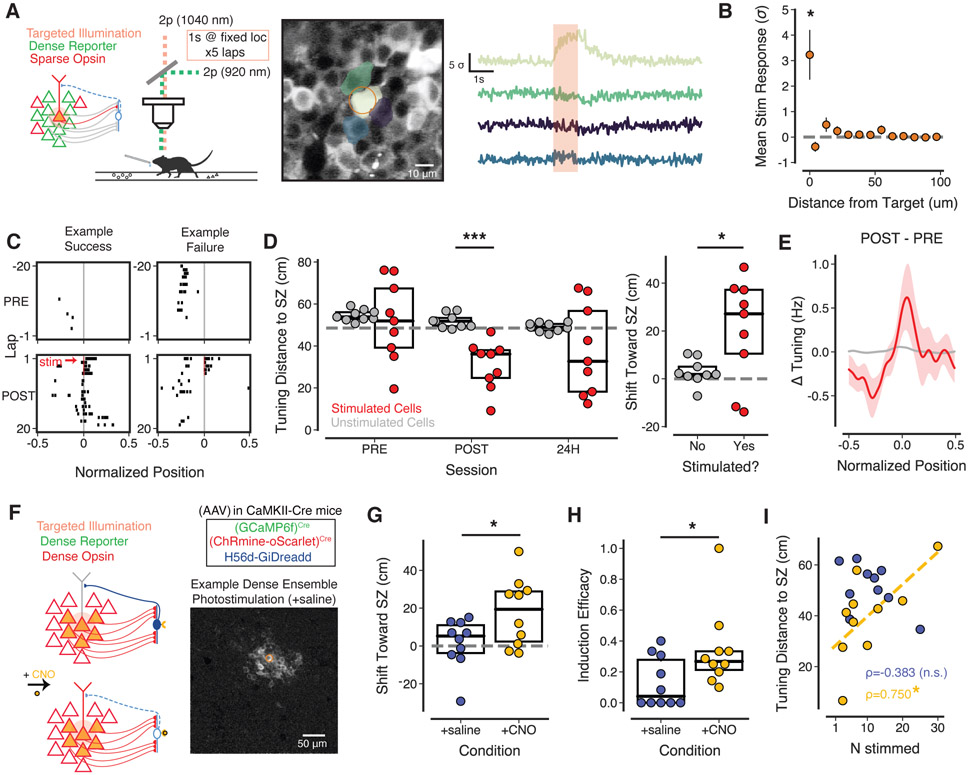
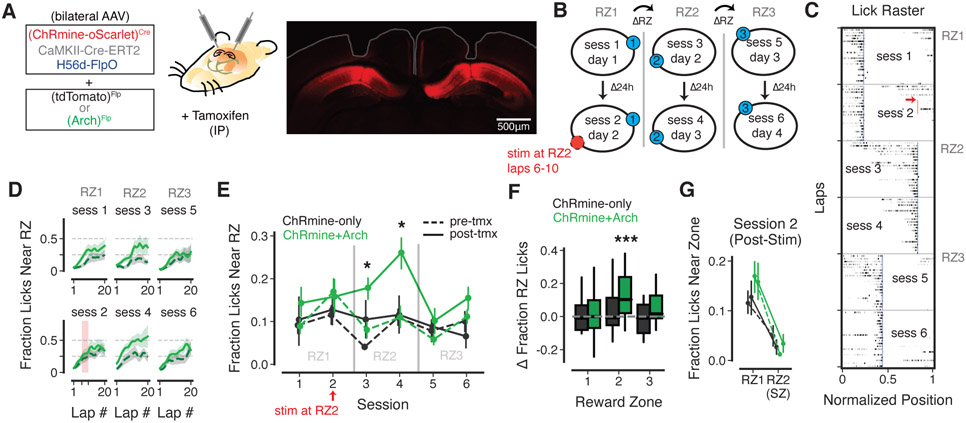
Hippocampal place cells underlie spatial navigation and memory. Remarkably, CA1 pyramidal neurons can form new place fields within a single trial by undergoing rapid plasticity. However, local feedback circuits likely restrict the rapid recruitment of individual neurons into ensemble representations. This interaction between circuit dynamics and rapid feature coding remains unexplored. Here, we developed "all-optical" approaches combining novel optogenetic induction of rapidly forming place fields with 2-photon activity imaging during spatial navigation in mice. We find that induction efficacy depends strongly on the density of co-activated neurons. Place fields can be reliably induced in single cells, but induction fails during co-activation of larger subpopulations due to local circuit constraints imposed by recurrent inhibition. Temporary relief of local inhibition permits the simultaneous induction of place fields in larger ensembles. We demonstrate the behavioral implications of these dynamics, showing that our ensemble place field induction protocol can enhance subsequent spatial association learning.

Keywords: BTSP; all-optical; disinhibition; engram; ensembles; hippocampus; inhibition; photostimulation; place cell; plasticity.


Conflict of interest statement

Declaration of interests The authors declare no competing interests.

Figures

Figure 1:
Figure 1:. Optogenetic stimulation of isolated CA1PCs at a fixed location rapidly induces new PF formation.
(A) Top, Schematic of 2p-guided single cell electroporation. Bottom, Example electroporation of a single CA1PC in vivo. (B) Expression of GCaMP7b and ChRmine-mScarlet in a CA1PC ~ 48H after electroporation. Maximum intensity projection (Z-MIP; z-depth 58 um) shows expression in neurites as well as soma. (C) Left, Schema of circuit with CA1PCs (triangles) and local INs (blue circle) during widefield optogenetic stimulation. Right, Schematic of behavior apparatus and opto-PFi protocol; 1 sec widefield LED stimulation is triggered at a fixed spatial location (SZ) for 5 consecutive laps as mice run on a cued linear treadmill for randomly-delivered water rewards. (D) Left, peri-SZ fluorescence (z-scored) of an example CA1PC before (PRE), during (STIM), and after (POST) induction of a de novo PF, with next day (24H) follow-up. Within-session lap numbers are indicated next to each fluorescence trace. Highlighting indicates 1 second after SZ entry, red indicates LED on. Right, raster of the running-related activity (deconvolved events) of the same cell during first 20 laps of induction session and 24H follow-up session. Vertical line indicates SZ (position 0). Horizontal lines demarcate induction session epochs. (E) Mean tuning curve of all cells by session block, centered on SZ (vertical line). (F) Mean change in spatial firing activity from PRE to POST session blocks (centered on SZ, vertical line). (G) Left, activity centroid distance of cells to SZ (mean ± sem; PRE: 59.42 ± 8.84, POST 27.58 ± 8.44, 24H: 42.12 ± 8.95, 48H: 44.58 ± 12.46, 72H 46.37 ± 8.51; POST: p = 0.0383, One-sample Student’s t-test against null hypothesis of 48.5 cm). Colored points indicate cells with peri-SZ PF. Right, activity centroid distance shift toward SZ after induction protocol (POST - PRE mean ± sem; 31.84 ± 11.37, p = 0.0231, One-sample Student’s t-test against null hypothesis of 0 cm). (H) Left, within-PF tuning curve peak location relative to SZ for successfully induced (7/9) cells (−10.88 ± 2.16; p = 0.0023, One-sample Student’s t-test against null hypothesis of 0 cm). Right, correlation of induced PF width to peri-SZ velocity during first stimulation (pearson’s r=0.943, p = 0.0014). For (E-F) data is shown for all stimulated cells (n = 9 cells, 7 mice). For (H) data is shown only for cells with successfully induced peri-SZ PF (n = 7 cells, 6 mice). All boxes indicate median and interquartile range.
Figure 2:
Figure 2:. Efficacy of ensemble opto-PFi depends on the density of co-activated CA1PCs.
(A) Left, Viral strategy for sparse expression of excitatory opsins across CA1PCs. Right, Example FOV. (B) Left, schema of circuit activation during widefield photostimulation of sparse CA1PC subpopulation. Right, Ensemble opto-PFi and monitoring protocol. (C) Tuning profiles for stimulated cells with a PF in POST, sorted by session tuning peak. Heatmap intensity shows normalized event rate in each spatial bin, centered on SZ. (D) Mean activity centroid distance to SZ for photostimulated cells versus percent CA1PCs activated in FOV. Individual data points represent mean across cells for a single mouse FOV and coloring indicates median split used in E,F. Line shows linear fit (Spearman’s ρ = 0.556, p = 0.0165). (E) Left, mean activity centroid distance to SZ for stimulated cells by experiment group. Asterisks indicate significant difference from chance level (one sample Student’s t-test) or between groups (independent Student’s t-test). *p < 0.05, **p < 0.01 Right, mean shift toward SZ. mean ± sem, low: 27.46 ± 6.54; medium: 0.09 ± 4.42. p = 0.0032, independent Student’s t-test. (F) Induction efficacy, i.e., fraction of stimulated cells with induced peri-SZ PF. p = 0.0303, Mann-Whitney U test. (G) Left, Example FOV in stratum oriens with GCaMP6f expression in putative INs. Right, schema of imaging of IN and PC populations during randomly-administered photostimulation of CA1PC subpopulations of increasing size. (H) Fraction photostimulation-responsive PCs at each tamoxifen dose. Bars indicate mean ± sem. Spearman’s ρ = 0.5773, p = 0.0008, n = 6 mice. (I) Left, Mean response to photostimulation of all INs in example FOV across sessions with differing CA1PC co-activation densities (baselined to pre-photostimulation activity). n = 28 – 41 cells, 6 mice. Right, mean IN response (2s post-stim - 2s pre-stim) versus percent co-activated CA1PCs. Colored by mouse. Dashed line shows linear fit; Spearman’s ρ = 0.6549, p = 8.594×10⁻⁵. For all panels, shading indicates mean ± sem.
Figure 3:
Figure 3:. CA1PC co-activation density limits on ensemble opto-PFi can be raised by suppressing local inhibition.
(A) Left, schema of circuit with sparse excitatory opsin expression and 2p-targeted photostimulation (see Methods). Right, Example 2p-target (orange ring) with spatial masks of targeted and neighboring cells overlaid. Mean responses to photostimulation (red shading) is shown for each cell. (B) Mean stimulation response amplitude for cells directly under target (leftmost point) or at evenly spaced distances from target. Bars indicate mean ± sem. (* p < 0.05, one-sample Student’s t-test against null hypothesis of 0). n = 1378 cells, 9 mice. (C) Event rasters for two example cells subjected to opto-PFi. PRE and POST sessions are shown for a cell successfully forming a new PF formation and another which only retained its previous PF. Red line indicates photostimulation laps. (D) Left, mean activity centroid distance to SZ for stimulated (red) and unstimulated (gray) cells. Dashed line indicates chance. Right, mean activity centroid shift toward SZ for stimulated and unstimulated cells in each FOV. Asterisks indicate significant difference between groups (paired Student’s t-test). *p < 0.05, **p < 0.01, ***p < 0.001. n = 9 mice. (E) Mean change in tuning curves from PRE to POST across stimulated and unstimulated cells. Shading indicates mean ± sem. n = 20 stimulated cells, n = 1358 unstimulated cells from 9 mice. (F) Left, schema of circuit with dense excitatory opsin labeling of CA1PCs and 2p-targeted stimulation (see Methods) before and after GiDREADD-mediated suppression of local IN activity with CNO. Right, Example baseline-subtracted FOV during 2p-targeted (orange ring) stimulation. Note the wide radius of co-activated cells outside the optical target. (G) Activity centroid shift toward SZ for each condition. +saline: 1.611 ± 4.15; +CNO: 17.91 ± 5.69; p = 0.0326, independent Student’s t-test. (H) Fraction stimulated cells with induced PF in each condition. +saline: 0.1312 ± 0.05; +CNO: 0.34 ± 0.08; p = 0.0216, Mann-Whitney U test. (I) Mean activity centroid distance to SZ for photostimulated cells without (blue) or with (yellow) GiDREADD activation versus number of cells photostimulated. Dashed line indicates linear fit. +saline: spearman’s ρ = −0.383, p = 0.2747; +CNO: spearman’s ρ = 0.750, p = 0.0125. n = 10 +saline experiments, 5 mice; n = 10 +CNO experiments, 4 mice. For D,G,I, individual data points represent mean across cells in a single FOV.
Figure 4:
Figure 4:. Ensemble opto-PFi while suppressing inhibition enhances subsequent goal oriented learning.
(A) Left, schematic of viral strategy for sparse, tamoxifen-dependent ChRmine expression in CA1PCs and for IN expression of Arch, with bilateral optical fiber implants. Right, post-hoc confirmation of ChRmine expression in dorsal CA1 (after tamoxifen administration) and optical fiber placement (white outline). (B) Schematic of goal-oriented learning task with photostimulation for opto-PFi. (C) Raster showing distribution of unrewarded licks during the first 20 laps of each session for an example mouse. Each row is an individual lap with lick rates normalized to the max lick rate at any spatial position on that lap. Blue vertical lines, RZ for each session. Red arrow and vertical line, SZ with photostimulation on laps 6-10. (D) Lap by lap fraction of unrewarded licks near the RZ for the first 20 laps of each session for ChRmine+Arch mice, pre- (dashed) and post- (solid) tamoxifen administration to induce ChRmine expression. Red shading shows laps when photostimulation is delivered at the SZ (RZ2) in session 2. Shading indicates mean ± sem. (E) Fraction of unrewarded licks near the RZ during each session for ChRmine-only (black) or ChRmine+Arch (green) mice, pre- (dashed) and post- (solid) tamoxifen administration to induce ChRmine expression. Gray lines demarcate RZs. ChRmine-only: n = 12 – 24 experiments per session, 8 mice; ChRmine+Arch: n = 23 – 24 experiments per session, 8 mice. Linear-mixed effects model for each session, fixed effects of opsin (ChRmine-only vs. ChRmine+Arch) and tamoxifen (pre vs. post), mouse as random effect. Asterisks indicate sessions with significant effects: Session 3: main effect of tamoxifen: z = 3.110, p = 0.002, 95% CI = (0.036, 0.160); Session 4: main effect of tamoxifen: z = 3.948, p = 7.9 × 10⁻⁵, 95% CI = (0.076, 0.226), effect of opsin x tamoxifen interaction: z = −2.312, p = 0.021, 95% CI = (−0.254, −0.02l). p > 0.05 for main effects and interaction for all other sessions. (F) Change in peri-RZ lick fraction from pre- to post-ChRmine expression for each belt/session in each RZ. Boxes indicate median and interquartile range, whiskers indicate 5th and 95th percentile. Asterisks indicate significant difference from null hypothesis of 0 (one-sample Student’s t-test with bonferonni correction for multiple comparisons); RZ2 ChRmine+Arch: p = 1.095 × 10⁻⁵. ChRmine-only: n = 24 – 30 mouse-session-belt pairs per RZ. ChRmine+Arch: n = 46 – 48 mouse-session-belt pairs per RZ. (G) Peri-zone lick fraction during session 2 post-stimulation laps for RZ1 and RZ2/SZ. Groups indicated by colors and dashes as in E.

Comment in

  • Place-cell crowd control.
    Bray N. Bray N. Nat Rev Neurosci. 2022 Mar;23(3):130-131. doi: 10.1038/s41583-022-00557-w. Nat Rev Neurosci. 2022. PMID: 35039666 No abstract available.

References

    1. Ahmed MS, Priestley JB, Castro A, Stefanini F, Solis Canales AS, Balough EM, Lavoie E, Mazzucato L, Fusi S & Losonczy A (2020), ‘Hippocampal network reorganization underlies the formation of a temporal association memory’, Neuron 107(2), 283–291. - PMC - PubMed
    1. Arriaga M & Han EB (2017), ‘Dedicated hippocampal inhibitory networks for locomotion and immobility’, J Neurosci 37(38), 9222–9238. - PMC - PubMed
    1. Bezaire MJ & Soltesz I (2013), ‘Quantitative assessment of ca1 local circuits: knowledge base for interneuron-pyramidal cell connectivity’, Hippocampus 23(9), 751–785. - PMC - PubMed
    1. Bittner KC, Grienberger C, Vaidya SP, Milstein AD, Macklin JJ, Suh J, Tonegawa S & Magee JC (2015), ‘Conjunctive input processing drives feature selectivity in hippocampal CA1 neurons’, Nature Neuroscience 18(8), 1133–1142. - PMC - PubMed
    1. Bittner KC, Milstein AD, Grienberger C, Romani S & Magee JC (2017), ‘Behavioral time scale synaptic plasticity underlies CA1 place fields’, Science 1036(September), 1033–1036. - PMC - PubMed

Publication types

LinkOut - more resources