. 2022 May;129(5):571-584.
doi: 10.1016/j.ophtha.2021.12.017. Epub 2022 Jan 3.

DeepLensNet: Deep Learning Automated Diagnosis and Quantitative Classification of Cataract Type and Severity

Collaborators, Affiliations

DeepLensNet: Deep Learning Automated Diagnosis and Quantitative Classification of Cataract Type and Severity

Tiarnan D L Keenan et al. Ophthalmology. 2022 May.

Abstract

Purpose: To develop deep learning models to perform automated diagnosis and quantitative classification of age-related cataract from anterior segment photographs.

Design: DeepLensNet was trained by applying deep learning models to the Age-Related Eye Disease Study (AREDS) dataset.

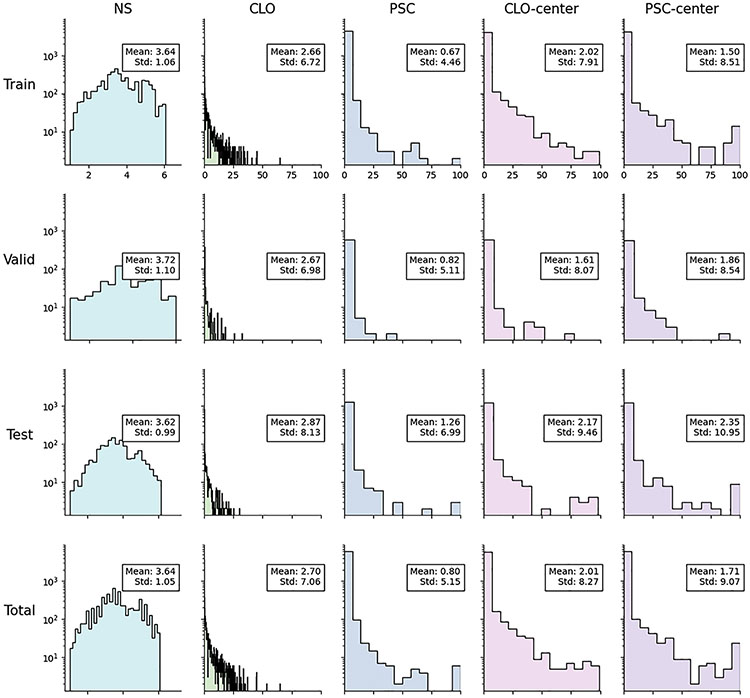
Participants: A total of 18 999 photographs (6333 triplets) from longitudinal follow-up of 1137 eyes (576 AREDS participants).

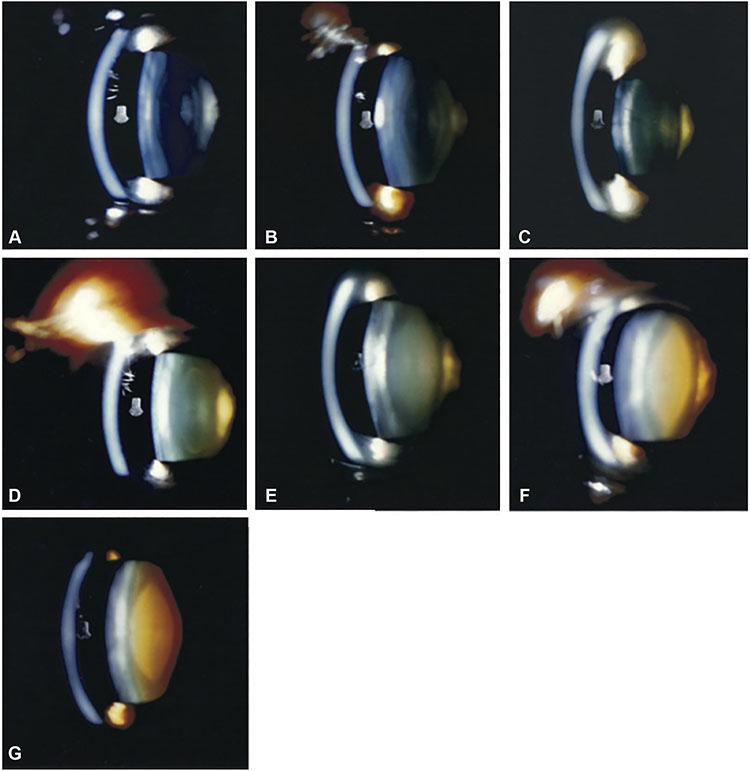
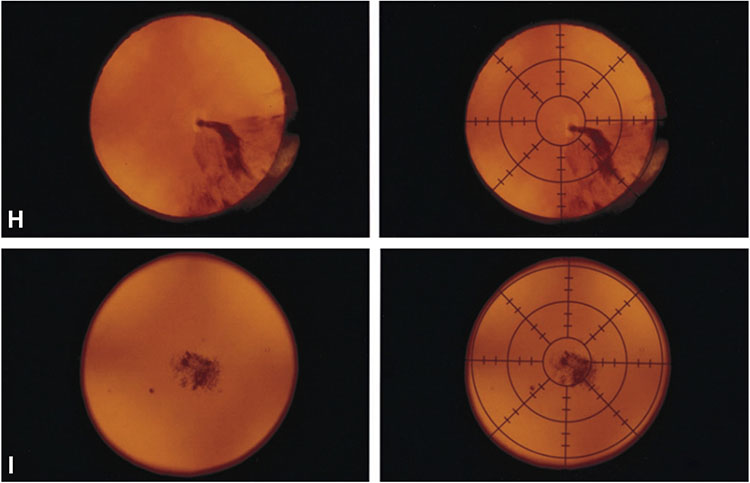
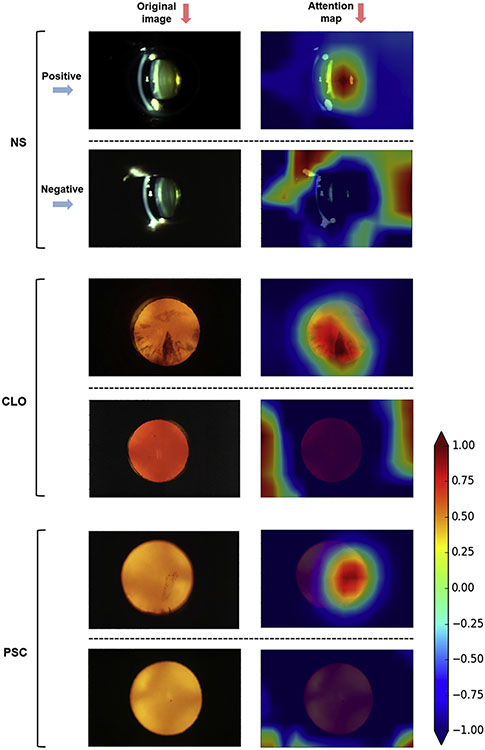
Methods: Deep learning models were trained to detect and quantify nuclear sclerosis (NS; scale 0.9-7.1) from 45-degree slit-lamp photographs and cortical lens opacity (CLO; scale 0%-100%) and posterior subcapsular cataract (PSC; scale 0%-100%) from retroillumination photographs. DeepLensNet performance was compared with that of 14 ophthalmologists and 24 medical students.

Main outcome measures: Mean squared error (MSE).

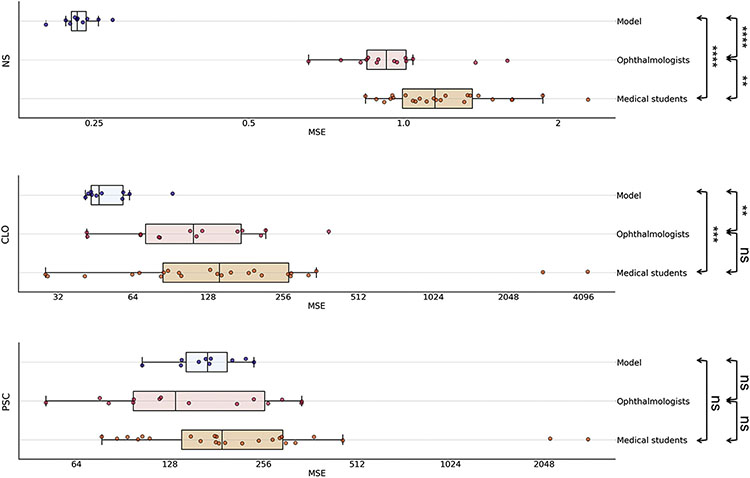
Results: On the full test set, mean MSE for DeepLensNet was 0.23 (standard deviation [SD], 0.01) for NS, 13.1 (SD, 1.6) for CLO, and 16.6 (SD, 2.4) for PSC. On a subset of the test set (substantially enriched for positive cases of CLO and PSC), for NS, mean MSE for DeepLensNet was 0.23 (SD, 0.02), compared with 0.98 (SD, 0.24; P = 0.000001) for the ophthalmologists and 1.24 (SD, 0.34; P = 0.000005) for the medical students. For CLO, mean MSE was 53.5 (SD, 14.8), compared with 134.9 (SD, 89.9; P = 0.003) for the ophthalmologists and 433.6 (SD, 962.1; P = 0.0007) for the medical students. For PSC, mean MSE was 171.9 (SD, 38.9), compared with 176.8 (SD, 98.0; P = 0.67) for the ophthalmologists and 398.2 (SD, 645.4; P = 0.18) for the medical students. In external validation on the Singapore Malay Eye Study (sampled to reflect the cataract severity distribution in AREDS), the MSE for DeepSeeNet was 1.27 for NS and 25.5 for PSC.

Conclusions: DeepLensNet performed automated and quantitative classification of cataract severity for all 3 types of age-related cataract. For the 2 most common types (NS and CLO), the accuracy was significantly superior to that of ophthalmologists; for the least common type (PSC), it was similar. DeepLensNet may have wide potential applications in both clinical and research domains. In the future, such approaches may increase the accessibility of cataract assessment globally. The code and models are available at https://github.com/ncbi/deeplensnet.

Keywords: Artificial intelligence; Automated diagnosis; Cataract; Cortical cataract; Deep learning; Nuclear sclerosis; Posterior subcapsular cataract; Severity classification; Telemedicine; Teleophthalmology.


Figures

Figure 1.
Figure 1.. Reading center grading system for age-related cataract.
A-G, Nuclear cataract grading by comparison of 45-degree slit-lamp photograph with 7 standard photographs: 1 (no opacity) to 7 (extremely severe opacity). A—G, Standard photographs 1 through 7. H, Cortical cataract grading by percentage area involvement of the central 2 circles of the grid (5-mm diameter circular area) on retroillumination photograph. Left: Retroillumination photograph of cortical opacity. Right: Retroillumination photograph of cortical opacity with overlying grid. The cortical opacity occupies 22% of the central 2 circles of the grid. I, Posterior subcapsular cataract grading by percentage area involvement of the central 2 circles of the grid (5-mm diameter circular area) on retroillumination photograph. Left: Retroillumination photograph of posterior subcapsular opacity. Right: Retroillumination photograph of posterior subcapsular opacity with overlying grid. The posterior subcapsular opacity occupies 15% of the central 2 circles of the grid.
Figure 2.
Figure 2.
Distributions of the cataract variables in the study population. The x-axis shows the grading scales, and the y-axis shows the associated frequencies on a logarithmic scale. CLO = cortical cataract; NS = nuclear sclerosis; PSC = posterior subcapsular cataract; Std = standard deviation.
Figure 3.
Figure 3.
Box plots showing the mean squared error (MSE) results on a logarithmic scale for the 10 deep learning models, the 14 ophthalmologists, and the 24 medical students for the 3 primary grading variables (NS, 0.9–7.1; CLO, 0%–100%; PSC, 0%–100%). The vertical line of the boxes represents the median MSE score, and the boxes represent the first and third quartiles. The whiskers represent quartile 1 – (1.5 × interquartile range) and quartile 3 + (1.5 × interquartile range). The dots represent the individual MSE result for each model or human grader. ****P ≤ 0.0001; ***P ≤ 0.001; **P ≤ 0.01; ns, P > 0.05 (Mann–Whitney U test). CLO = cortical lens opacity; NS = nuclear sclerosis; PSC = posterior subcapsular cataract.
Figure 4.
Figure 4.
Deep learning attention maps (right) overlaid on representative retroillumination images and 45-degree slit-lamp images (left). For each of the 3 cataract types (nuclear, cortical, and posterior subcapsular), 1 positive example (above) and 1 negative example (below) are shown (or more severe and less severe for nuclear cataract). For each image, the attention map demonstrates quantitatively the relative contributions made by each pixel to the grading prediction. The heatmap scale for the attention maps is also shown: signal range from −1.00 (purple) to +1.00 (brown). In the positive case of cortical cataract, the areas of high signal corresponded closely to the location and extent of the opacity. In the negative case, no areas of high signal were observed in the lens distribution. In the positive case of PSC, the area of high signal corresponded closely to the location and shape of the opacity (a single vertically elongated plaque). In the negative case, no areas of high signal were observed in the lens distribution. In the severe case of nuclear cataract, the area of high signal corresponded to the location of the lens nucleus. In the mild case, no areas of high signal were observed in the distribution of the lens nucleus. Nuclear sclerosis severe case: reading center grading of 5.3, automated prediction of 5.2. Nuclear sclerosis mild case: reading center grading of 2.5, automated prediction of 2.6. Cortical lens opacity positive case: reading center grading of 41.6%, automated prediction of 43.6%. Cortical lens opacity negative case: reading center grading of 0%, automated prediction of 0%. Posterior subcapsular cataract positive case: reading center grading of 19.8%, automated prediction of 18.6%. Posterior subcapsular cataract negative case: reading center grading of 0%, automated prediction of 0%. CLO = cortical lens opacity; NS = nuclear sclerosis; PSC = posterior subcapsular cataract.

References

    1. Lam D, Rao SK, Ratra V, et al. Cataract. Nat Rev Dis Primers. 2015;1:15014. - PubMed
    1. GBD 2019 Blindness and Vision Impairment Collaborators; Vision Loss Expert Group of the Global Burden of Disease Study. Causes of blindness and vision impairment in 2020 and trends over 30 years, and prevalence of avoidable blindness in relation to VISION 2020: the Right to Sight: an analysis for the Global Burden of Disease Study. Lancet Glob Health. 2021;9:e144–e160. - PMC - PubMed
    1. Hashemi H, Pakzad R, Yekta A, et al. Global and regional prevalence of age-related cataract: a comprehensive systematic review and meta-analysis. Eye (Lond). 2020;34:1357–1370. - PMC - PubMed
    1. Flaxman SR, Bourne RRA, Resnikoff S, et al. Global causes of blindness and distance vision impairment 1990-2020: a systematic review and meta-analysis. Lancet Glob Health. 2017;5:e1221–e1234. - PubMed
    1. Bastawrous A, Suni AV. Thirty year projected magnitude (to 2050) of near and distance vision impairment and the economic impact if existing solutions are implemented globally. Ophthalmic Epidemiol. 2020;27:115–120. - PubMed

Publication types

Supplementary concepts

LinkOut - more resources