

Blood levels of adiponectin and IL-1Ra distinguish type 3c from type 2 diabetes: Implications for earlier pancreatic cancer detection in new-onset diabetes
- PMID: 34990893
- PMCID: PMC8741427
- DOI: 10.1016/j.ebiom.2021.103802
Blood levels of adiponectin and IL-1Ra distinguish type 3c from type 2 diabetes: Implications for earlier pancreatic cancer detection in new-onset diabetes
Abstract
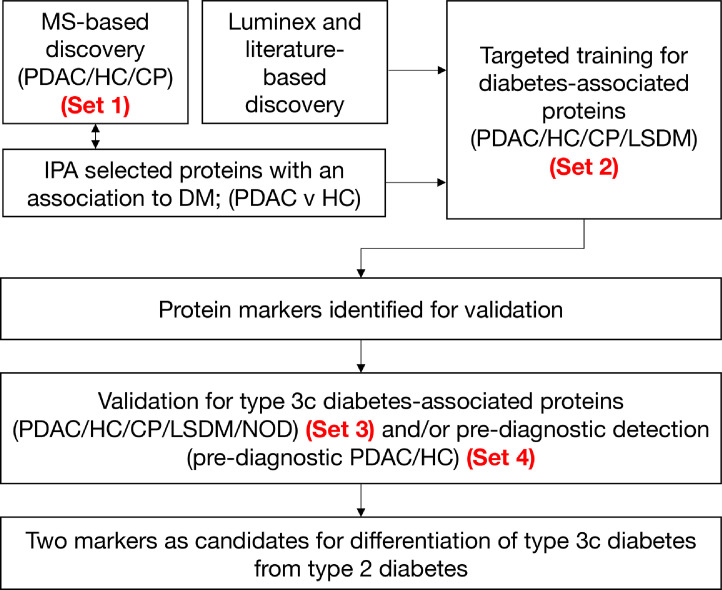
Background: Screening for pancreatic ductal adenocarcinoma (PDAC) in populations at high risk is recommended. Individuals with new-onset type 2 diabetes mellitus (NOD) are the largest high-risk group for PDAC. To facilitate screening, we sought biomarkers capable of stratifying NOD subjects into those with type 2 diabetes mellitus (T2DM) and those with the less prevalent PDAC-related diabetes (PDAC-DM), a form of type 3c DM commonly misdiagnosed as T2DM.
Methods: Using mass spectrometry- and immunoassay-based methodologies in a multi-stage analysis of independent sample sets (n=443 samples), blood levels of 264 proteins were considered using Ingenuity Pathway Analysis, literature review and targeted training and validation.
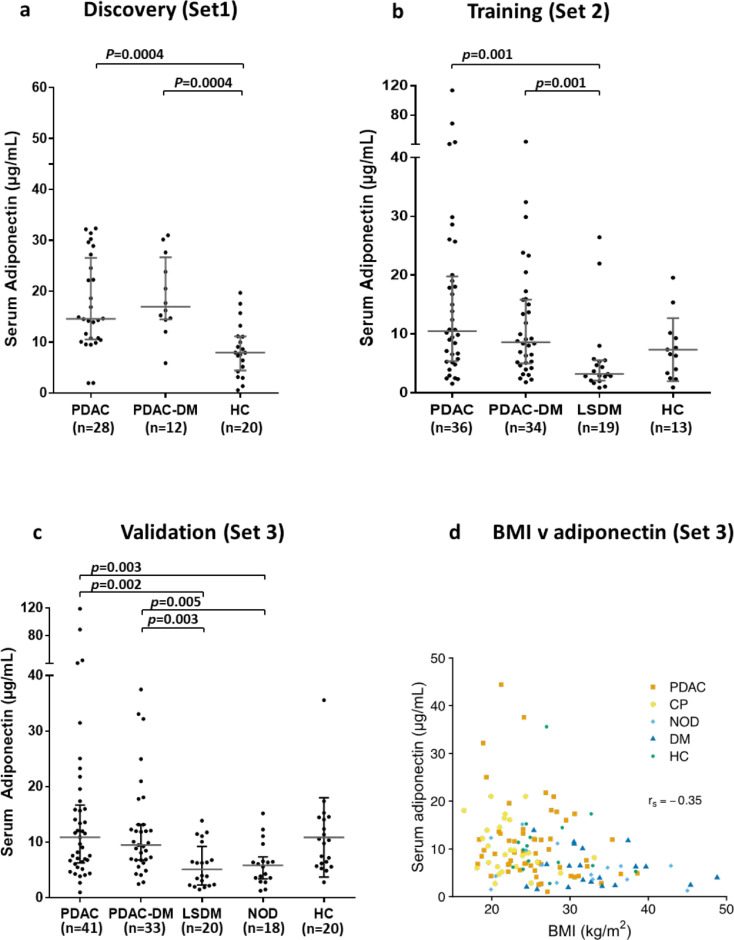
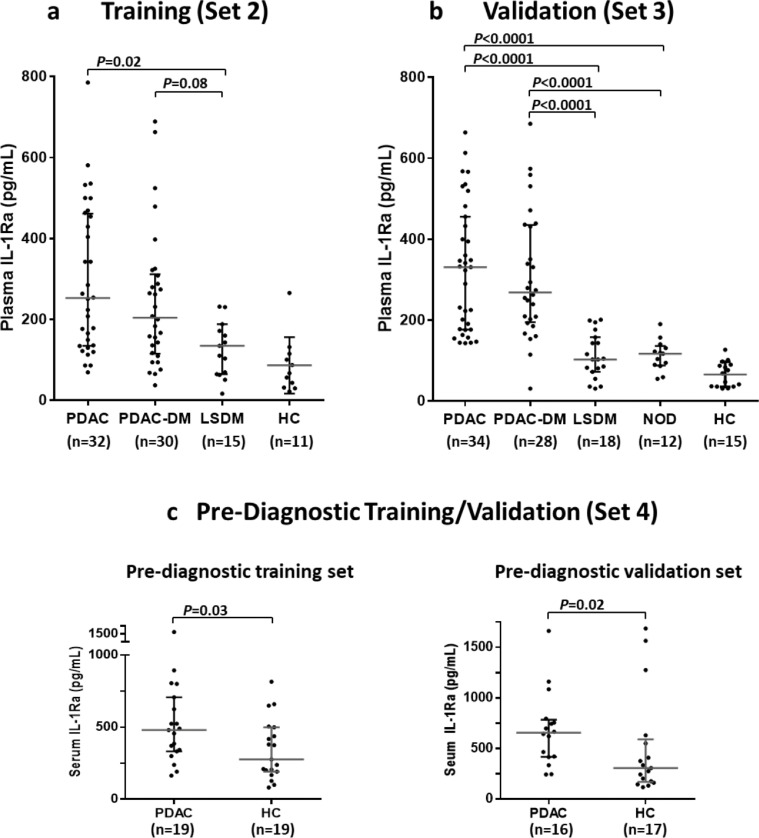
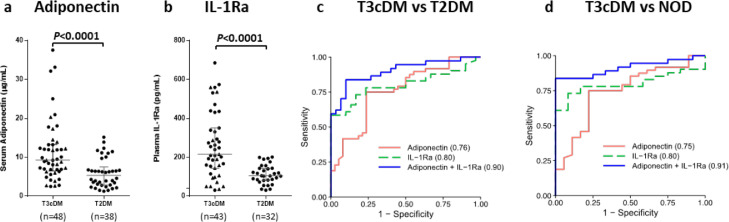
Findings: Of 30 candidate biomarkers evaluated in up to four independent patient sets, 12 showed statistically significant differences in levels between PDAC-DM and T2DM. The combination of adiponectin and interleukin-1 receptor antagonist (IL-1Ra) showed strong diagnostic potential, (AUC of 0.91; 95% CI: 0.84-0.99) for the distinction of T3cDM from T2DM.
Interpretation: Adiponectin and IL-1Ra warrant further consideration for use in screening for PDAC in individuals newly-diagnosed with T2DM.
Funding: North West Cancer Research, UK, Cancer Research UK, Pancreatic Cancer Action, UK.
Keywords: Adiponectin; Blood biomarkers; Early detection; IL-1Ra; Pancreatic cancer; Type 3c diabetes.
Crown Copyright © 2021. Published by Elsevier B.V. All rights reserved.
Conflict of interest statement
Declaration of Competing Interest LO, EC, WG, CH and PG are named as inventors on GB patent GB1806002.0; PCT/GB2019/050998, submitted by the University of Liverpool, that covers the measurement of adiponectin and IL-1Ra as a biomarker for early detection of pancreatic cancer. UM holds patent number EP EP10178345.4 for breast cancer diagnosis, and has stock ownership awarded by the University College London (UCL) in Abcodia.
Figures
References
-
- Sung H, Ferlay J, Siegel RL, et al. Global cancer statistics 2020: GLOBOCAN estimates of incidence and mortality worldwide for 36 cancers in 185 countries. CA Cancer J Clin. 2021;71(3):209–249. - PubMed
-
- Pereira SP, Oldfield L, Ney A, et al. Early detection of pancreatic cancer. Lancet Gastroenterol Hepatol. 2020 doi.org/10.1016/S2468-1253(19)30416-9. - PMC - PubMed
-
- Stoffel EM, McKernin SE, Brand R, et al. Evaluating susceptibility to pancreatic cancer: ASCO provisional clinical opinion. J Clin Oncol. 2019;37(2):153–164. - PubMed
MeSH terms
Substances
Grants and funding
- G9901012/MRC_/Medical Research Council/United Kingdom
- G0801228/MRC_/Medical Research Council/United Kingdom
- 16791/CRUK_/Cancer Research UK/United Kingdom
- 26881/CRUK_/Cancer Research UK/United Kingdom
- 16186/CRUK_/Cancer Research UK/United Kingdom
- 17680/CRUK_/Cancer Research UK/United Kingdom
- RG2014_01_PERERIA/PANCREATICCANUK_/Pancreatic Cancer UK/United Kingdom
- 15957/CRUK_/Cancer Research UK/United Kingdom
- 16812/CRUK_/Cancer Research UK/United Kingdom
- 11883/CRUK_/Cancer Research UK/United Kingdom
- 28210/CRUK_/Cancer Research UK/United Kingdom
- MC_UU_00004/01/MRC_/Medical Research Council/United Kingdom
- 8968/CRUK_/Cancer Research UK/United Kingdom
LinkOut - more resources
Full Text Sources
Medical
