

Morphological and microsatellite DNA diversity of Djallonké sheep in Guinea-Bissau
- PMID: 34991442
- PMCID: PMC8740422
- DOI: 10.1186/s12863-021-01009-7
Morphological and microsatellite DNA diversity of Djallonké sheep in Guinea-Bissau
Abstract
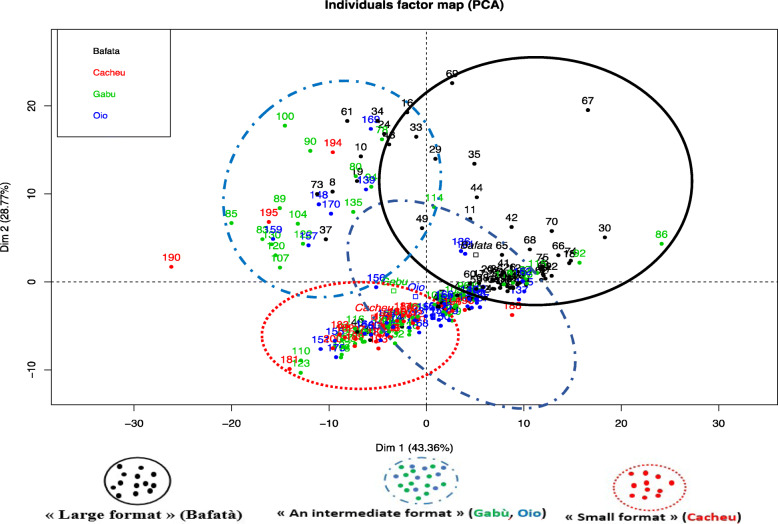
Background: The present study aimed at characterizing the Djallonké Sheep (DS), the only local sheep breed raised in Guinea-Bissau. A total of 200 animals were sampled from four regions (Bafatá, Gabú, Oio and Cacheu) and described using 7 visual criteria and 8 measurements. These parameters have been studied by principal components analysis. The genetic diversity and population structure of 92 unrelated animals were studied using 12 microsatellite markers.
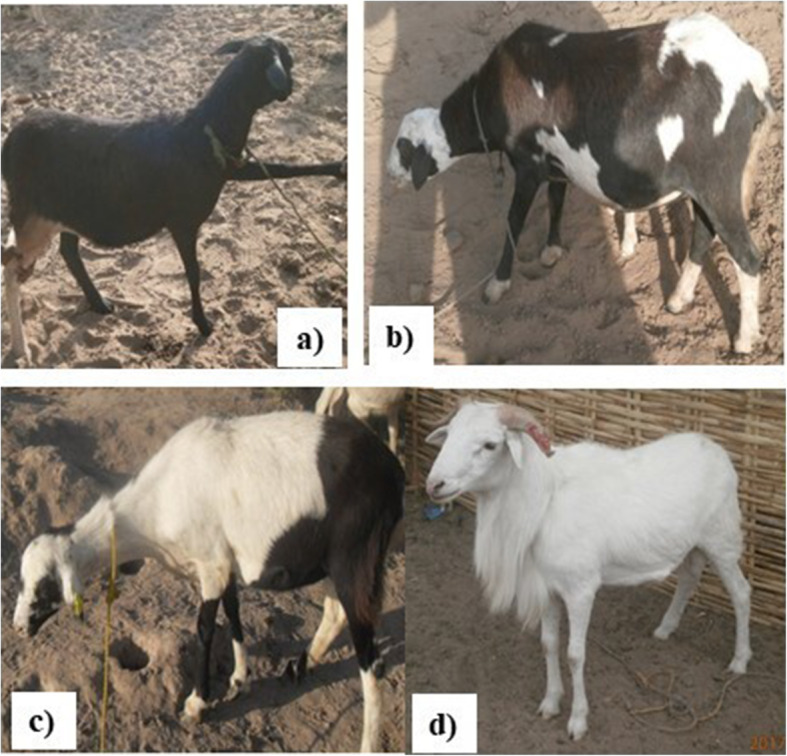
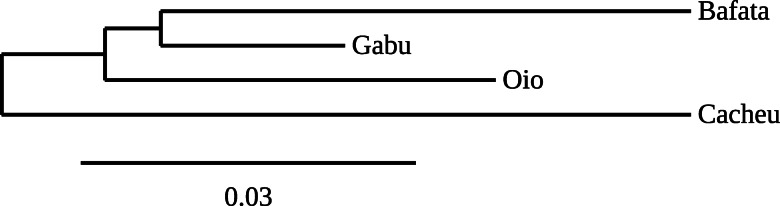
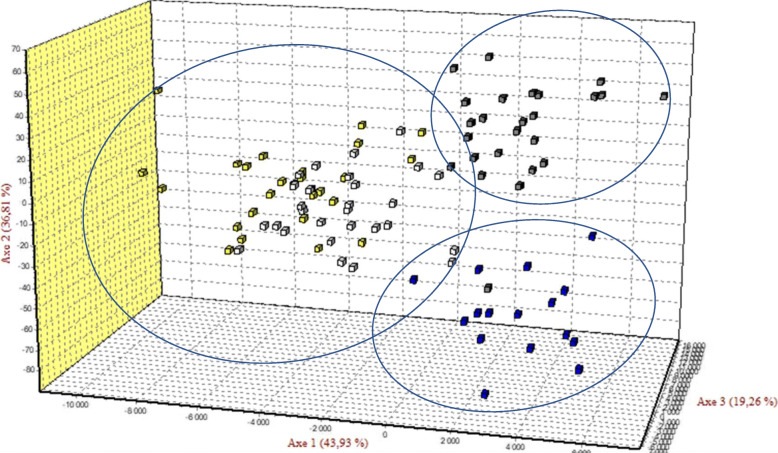
Results: The values of quantitative characters in the Bafatá region were significantly higher than those obtained in the other three regions. A phenotypic diversity of the DS population was observed and three genetic types distinguished: animals with "large traits" in the region of Bafatá, animals with "intermediate traits" in the regions of Gabú and Oio and animals with "small traits" in the Cacheu region. The hair coat colors are dominated by the white color, the shape of the facial head profile is mainly convex and the ears "erected horizontally". Most of the morphobiometric characteristics were significantly influenced by the "region" and "sex of animals". The average Polymorphism Information Content (PIC) of 0.65 ± 0.11 supports the use of markers in genetic characterization. Gabú subpopulation had the highest genetic diversity measures (He = 0.716 ± 0.089) while Cacheu DS subpopulation presented the smallest (He = 0.651 ± 0.157). Only Gabú and Bafatá subpopulations presented significant heterozygote deficiency across all loci indicating possible significant inbreeding. Mean values for FIT, FST, FIS and GST statistics across all loci were 0.09, 0.029, 0.063 and 0.043 respectively. The overall genetic differentiation observed between the four DS subpopulations studied was low. Bafatá and Gabú are the most closely related subpopulations (DS = 0.04, genetic identity = 0.96) while Bafatá and Cacheu were the most genetically distant subpopulations (DS = 0.14, genetic identity = 0.87). Using Bayesian approach, the number of K groups that best fit the data is detected between 2 and 3, which is consistent with the morphological analysis and the factorial analysis of correspondence.
Conclusions: The molecular results on DS population of Guinea-Bissau confirmed the ones obtained with morphological analysis. The three genetic types observed phenotypically might be due to a combination of the agro-ecological differences and the management of breeding rather than genetic factors.
Keywords: Guinea-Bissau; Microsatellite DNA; Morphological diversity; Population structure; Sheep.
© 2021. The Author(s).
Conflict of interest statement
The authors declare that they have no competing interests.
Figures


References
-
- Herrero M, Havlik P, Mcintire J, Palazzo A, Valin H. L’avenir de l’élevage africain : Réaliser le potentiel de l’élevage pour la sécurité alimentaire, la réduction de la pauvreté et la protection de l’environnement en Afrique sub-saharienne. Genèse: Bureau du représentant spécial des Nations Unies pour la sécurité alimentaire et nutritionnelle et du Coordonnateur du système des Nations Unies contre la grippe (UNSIC); 2014. p. 118.
-
- Akakpo K, Lero P, Mendes D, Silva BV. Guinée-Bissau : Résultats de l’enquête approfondie sur la sécurité alimentaire et la vulnérabilité des ménages ruraux (rapport final) Rome: Programme Alimentaire Mondial, Service de l’Analyse de la Sécurité Alimentaire (VAM); 2011. p. 80.
-
- DGE . Lettre de Politique de Développement de l’Elevage de la Guinée-Bissau. 2010. p. 57.
-
- Correia F. Revue des filières bétail/viande et lait et des politiques qui les influencent en Guinée-Bissau. FAO. Editeurs : Niang M, Salla A, Bedane B., Rome : FAO et CEDEAO. 2016. 52. Disponible sur http://www.fao.org/3/a-i5267f.pdf
-
- Ira M, Dayo G-K, Sangaré M, Djassi B, Gomes J, Cassama B, Toguyeni A, Yapi-Gnaore CV, Ouedraogo AG. Etat des lieux de la caractérisation des ressources génétiques animales et aquacoles en Guinée-Bissau et perspectives de valorisation. Int J Adv Res. 2018;6(12):12–23. doi: 10.21474/IJAR01/8109. - DOI
Publication types
MeSH terms
Substances
LinkOut - more resources
Full Text Sources
Research Materials
Miscellaneous