. 2022 Jan 6;23(1):27.
doi: 10.1186/s12859-021-04555-0.

ASAP 2: a pipeline and web server to analyze marker gene amplicon sequencing data automatically and consistently

Affiliations

ASAP 2: a pipeline and web server to analyze marker gene amplicon sequencing data automatically and consistently

Renmao Tian et al. BMC Bioinformatics. .

Abstract

Background: Amplicon sequencing of marker genes such as 16S rDNA have been widely used to survey and characterize microbial community. However, the complex data analyses have required many interfering manual steps often leading to inconsistencies in results.

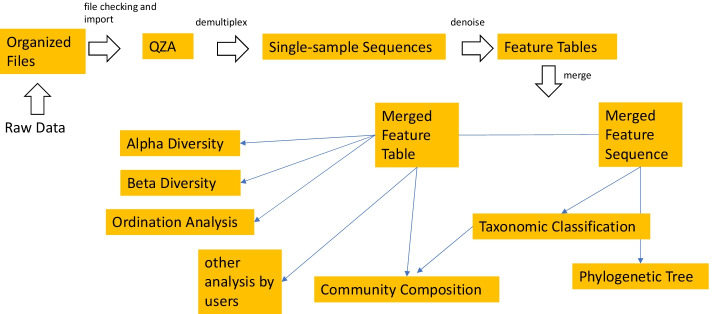
Results: Here, we have developed a pipeline, amplicon sequence analysis pipeline 2 (ASAP 2), to automate and glide through the processes without the usual manual inspections and user's interference, for instance, in the detection of barcode orientation, selection of high-quality region of reads, and determination of resampling depth and many more. The pipeline integrates all the analytical processes such as importing data, demultiplexing, summarizing read profiles, trimming quality, denoising, removing chimeric sequences and making the feature table among others. The pipeline accepts multiple file formats as input including multiplexed or demultiplexed, paired-end or single-end, barcode inside or outside and raw or intermediate data (e.g. feature table). The outputs include taxonomic classification, alpha/beta diversity, community composition, ordination analysis and statistical tests. ASAP 2 supports merging multiple sequencing runs which helps integrate and compare data from different sources (public databases and collaborators).

Conclusions: Our pipeline minimizes hands-on interference and runs amplicon sequence variant (ASV)-based amplicon sequencing analysis automatically and consistently. Our web server assists researchers that have no access to high performance computer (HPC) or have limited bioinformatics skills. The pipeline and web server can be accessed at https://github.com/tianrenmaogithub/asap2 and https://hts.iit.edu/asap2 , respectively.

Keywords: 16S rRNA; Amplicon sequencing; Marker gene; Pipeline; Web server.


Conflict of interest statement

The authors declare that they have no competing interests.

Figures

Fig. 1
Fig. 1
The workflow of the pipeline ASAP 2. The pipeline first imports organized input data as QZA, which are then used for demultiplexing (if applicable). The single-sample sequences are then denoised and feature tables are generated. Multiple projects are then merged to a feature table and a feature sequence file which are used in the downstream analysis. The merged feature table and feature sequence file can be used for other customized analysis. See the detailed file organization, processing and commands used in Additional file 1: Fig. S1
Fig. 2
Fig. 2
A sequence quality profile demonstrating how ASAP 2 selects the high-quality region for further processing. The original quality score at each position is converted into a moving average score to reduce the volatility caused by occasional drop of score (e.g. at 108) due to sudden quality changes at certain regions. The optimal high-quality region (1–143) is then selected by the pipeline
Fig. 3
Fig. 3
The automatic determination of resampling depth. A The profile with numbers of read of the ranked samples shows the selected resampling depth indicated with an asterisk. B The total number of read along with the number of samples left shows a peak of total number of read at the selected depth
Fig. 4
Fig. 4
The interface page for job submission on the web server. It allows users to upload their organized data in zip format and set parameters for their task
Fig. 5
Fig. 5
An example of output results generated by the pipeline ASAP 2. The Atacama soil microbiome dataset from QIIME 2 tutorial was analyzed. The results include the alpha diversity in multiple indices and rarefaction, correlation of alpha diversity and environmental factors, correlation of alpha diversity and groups, beta diversity in multiple matrix, taxonomic classification at all taxonomic levels, community composition bar chart, phylogenetic tree, variable selection analysis and CCA / RDA analysis. The result files in QZA or QZV format can be viewed in a web browser using QIIME 2 View (https://view.qiime2.org). In addition, certain features of the results such as sample color are customizable. CCA: Canonical Correspondence Analysis; RDA: Redundancy Analysis

References

    1. Hugerth LW, Andersson AF. Analysing microbial community composition through amplicon sequencing: from sampling to hypothesis testing. Front Microbiol. 2017 doi: 10.3389/fmicb.2017.01561. - DOI - PMC - PubMed
    1. Wang Q, Garrity GM, Tiedje JM, Cole JR. Naïve bayesian classifier for rapid assignment of rrna sequences into the new bacterial taxonomy. Appl Environ Microbiol. 2007;73:5261–5267. doi: 10.1128/AEM.00062-07. - DOI - PMC - PubMed
    1. Jackson CR, Randolph KC, Osborn SL, Tyler HL. Culture dependent and independent analysis of bacterial communities associated with commercial salad leaf vegetables. BMC Microbiol. 2013;13:274. doi: 10.1186/1471-2180-13-274. - DOI - PMC - PubMed
    1. Elizaquível P, Pérez-Cataluña A, Yépez A, Aristimuño C, Jiménez E, Cocconcelli PS, et al. Pyrosequencing vs. culture-dependent approaches to analyze lactic acid bacteria associated to chicha, a traditional maize-based fermented beverage from Northwestern Argentina. Int J Food Microbiol. 2015;198:9–18. doi: 10.1016/j.ijfoodmicro.2014.12.027. - DOI - PubMed
    1. Grützke J, Malorny B, Hammerl JA, Busch A, Tausch SH, Tomaso H, et al. Fishing in the soup—pathogen detection in food safety using metabarcoding and metagenomic sequencing. Front Microbiol. 2019 doi: 10.3389/fmicb.2019.01805. - DOI - PMC - PubMed

Substances

LinkOut - more resources