. 2022 Jan 6;22(1):30.
doi: 10.1186/s12889-021-12249-8.

Construction and validation of a prognostic nomogram for predicting the survival of HIV/AIDS adults who received antiretroviral therapy: a cohort between 2003 and 2019 in Nanjing

Affiliations

Construction and validation of a prognostic nomogram for predicting the survival of HIV/AIDS adults who received antiretroviral therapy: a cohort between 2003 and 2019 in Nanjing

Fangfang Jiang et al. BMC Public Health. .

Abstract

Background: Great achievements have been achieved by free antiretroviral therapy (ART). A rapid and accurate prediction of survival in people living with HIV/AIDS (PLHIV) is needed for effective management. We aimed to establish an effective prognostic model to forecast the survival of PLHIV after ART.

Methods: The participants were enrolled from a follow-up cohort over 2003-2019 in Nanjing AIDS Prevention and Control Information System. A nested case-control study was employed with HIV-related death, and a propensity-score matching (PSM) approach was applied in a ratio of 1:4 to allocate the patients. Univariable and multivariable Cox proportional hazards analyses were performed based on the training set to determine the risk factors. The discrimination was qualified using the area under the curve (AUC) and concordance index (C-Index). The nomogram was calibrated using the calibration curve. The clinical benefit of prognostic nomogram was assessed by decision curve analysis (DCA).

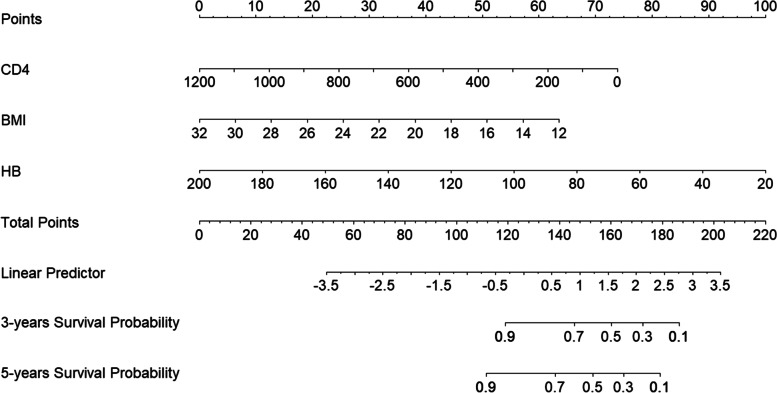
Results: Predictive factors including CD4 cell count (CD4), body mass index (BMI) and hemoglobin (HB) were determined and incorporated into the nomogram. In the training set, AUC and C-index (95% CI) were 0.831 and 0.798 (0.758, 0.839), respectively. The validation set revealed a good discrimination with an AUC of 0.802 and a C-index (95% CI) of 0.786 (0.681, 0.892). The calibration curve also exhibited a high consistency in the predictive power (especially in the first 3 years after ART initiation) of the nomogram. Moreover, DCA demonstrated that the nomogram was clinically beneficial.

Conclusion: The nomogram is effective and accurate in forecasting the survival of PLHIV, and beneficial for medical workers in health administration.

Keywords: Antiretroviral therapy; HIV/AIDS; Nomogram; Prognostic model.


Conflict of interest statement

All authors declare that they have no conflict of interest or financial conflicts to disclose.

Figures

Fig. 1
Fig. 1
A flowchart of predicted HIV-related survival of people living with HIV/AIDS (PLHIV) using nomogram model
Fig. 2
Fig. 2
Proportion of missing values (A) and distribution of combinations of missing values (B) in training set. Abbreviations: BMI = body mass index; WBC = white blood cell; PLT = blood platelet; HB = hemoglobin; CR = creatinine; TG = triglyceride; TC = total cholesterol; FBG = fasting blood glucose; AST = aspartate aminotransferase; ALT = alanine aminotransferase; TBIL = total bilirubin
Fig. 3
Fig. 3
ROC curves of Shingles, CD4, BMI, HB and TC, combine 1 (Shingles, CD4, BMI, HB and TC) and combine 2 (CD4, BMI and HB) in the training set (A) and the validation set (B). Abbreviations: CD4 = CD4 cell count; BMI = body mass index; HB = hemoglobin; TC = total cholesterol
Fig. 4
Fig. 4
C-Indexes of combine 1 (Shingles, CD4, BMI, HB and TC) and combine 2 (CD4, BMI and HB) in the training set (A) and the validation set (B)
Fig. 5
Fig. 5
Calibration curves for predicting overall survival by combine 1 (Shingles, CD4, BMI, HB and TC) and combine 2 (CD4, BMI and HB) in the training set and the validation set. Notes: Calibration curves for 3-year overall survival (A), 5-year overall survival (C) in the training set; calibration curves for 3-year overall survival (B), 5-year overall survival (D) in the validation set
Fig. 6
Fig. 6
The DCA curve of Shingles, Diarrhea, WHO, CD4, BMI and HB, combine 1 (Shingles, CD4, BMI, HB and TC) and combine 2 (CD4, BMI and HB) in the training set and the validation set. Notes: DCA curve for 3-year overall survival (A), 5-year overall survival (B) in the training set; DCA curves for 3-year overall survival (C), 5-year overall survival (D) in the validation set. The horizontal axis represents the threshold probability, the probability of whether a patient receives treatment. The vertical axis represents the net benefit rate after the advantages minus the disadvantages. Under the same threshold probability, a larger net benefit implies that patients can obtain the maximum benefit using this model. The closer the curve in the DCA graph is to the top, the higher the value of the model diagnosis is. Abbreviations: CD4 = CD4 cell count; BMI = body mass index; HB = hemoglobin; TC = total cholesterol
Fig. 7
Fig. 7
Nomogram of indexes for predicting HIV/AIDS-related survival of PLHIV after ART initiation. Abbreviations: CD4 = CD4 cell count; BMI = body mass index; HB = hemoglobin

References

    1. Zayeri F, Ghane ET, Borumandnia N. Assessing the trend of HIV/AIDS mortality rate in Asia and North Africa: an application of latent growth models. Epidemiol Infect. 2016;144(3):548–555. doi: 10.1017/S0950268815001351. - DOI - PubMed
    1. Zhang FJ, Jennifer P, Lan Y, et al. Current progress of China's free ART program. Cell Res. 2005;15(11):877–882. doi: 10.1038/sj.cr.7290362. - DOI - PubMed
    1. Bansi L, Gazzard B, Post F, et al. Biomarkers to monitor safety in people on art and risk of mortality. J Acquir Immune Defic Syndr. 2012;60(1):51–58. doi: 10.1097/QAI.0b013e31824d2134. - DOI - PubMed
    1. Wang CW, Chan CLW, Ho RTH. HIV/AIDS-related deaths in China, 2000-2012. AIDS Care. 2015;27(7):849–854. doi: 10.1080/09540121.2015.1005568. - DOI - PubMed
    1. Ning SP, Xue ZD, Wei J, et al. HIV/AIDS related mortality in southern Shanxi province and its risk factors. Chin J Epidemiol. 2015;36(3):245–249. - PubMed

Publication types

LinkOut - more resources