. 2022 Jan 6;19(1):9.
doi: 10.1186/s12974-021-02374-x.

Anti-inflammatory role of GM1 and other gangliosides on microglia

Affiliations

Anti-inflammatory role of GM1 and other gangliosides on microglia

Danny Galleguillos et al. J Neuroinflammation. .

Abstract

Background: Gangliosides are glycosphingolipids highly enriched in the brain, with important roles in cell signaling, cell-to-cell communication, and immunomodulation. Genetic defects in the ganglioside biosynthetic pathway result in severe neurodegenerative diseases, while a partial decrease in the levels of specific gangliosides was reported in Parkinson's disease and Huntington's disease. In models of both diseases and other conditions, administration of GM1-one of the most abundant gangliosides in the brain-provides neuroprotection. Most studies have focused on the direct neuroprotective effects of gangliosides on neurons, but their role in other brain cells, in particular microglia, is not known. In this study we investigated the effects of exogenous ganglioside administration and modulation of endogenous ganglioside levels on the response of microglia to inflammatory stimuli, which often contributes to initiation or exacerbation of neurodegeneration.

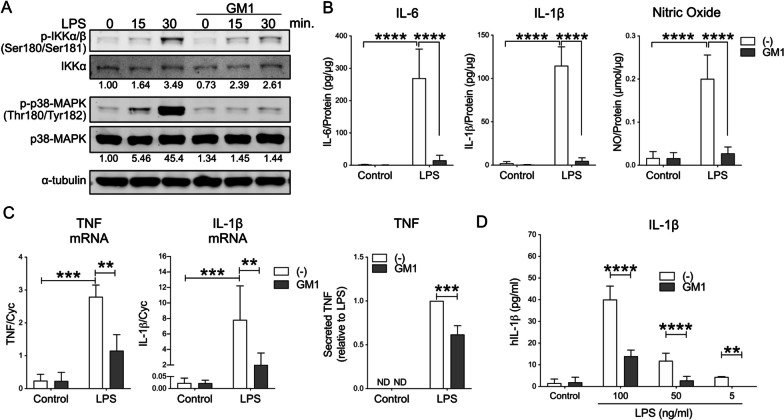
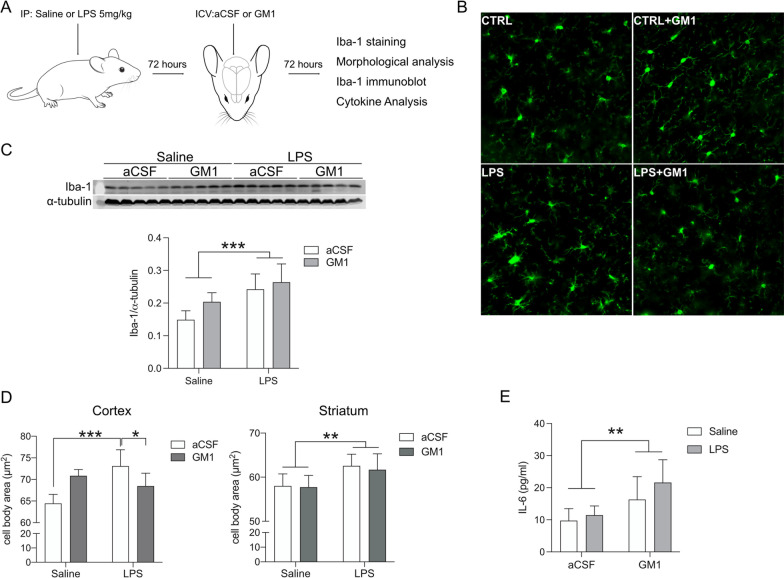
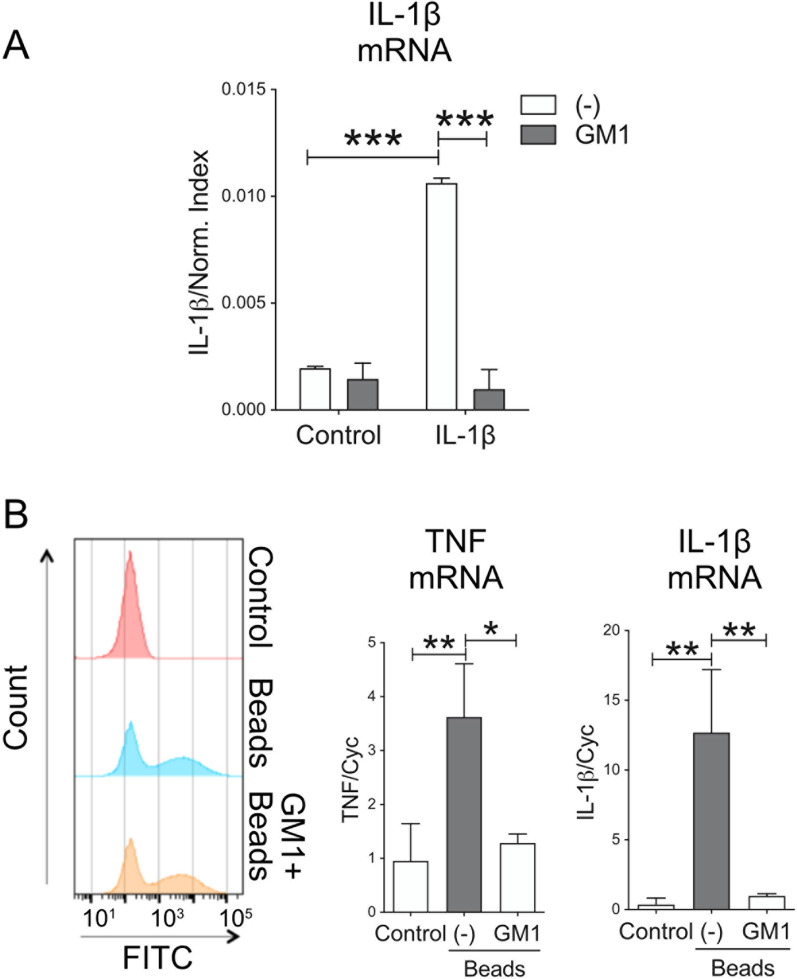
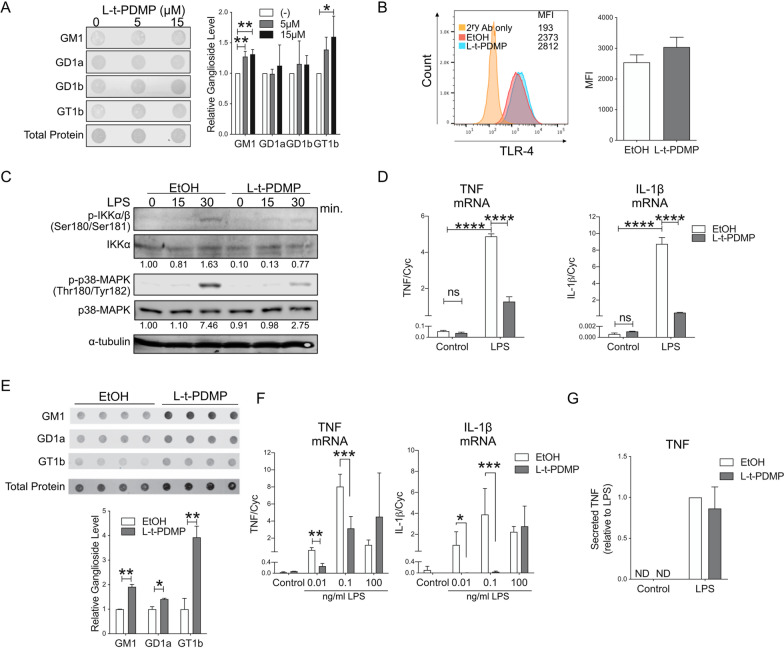
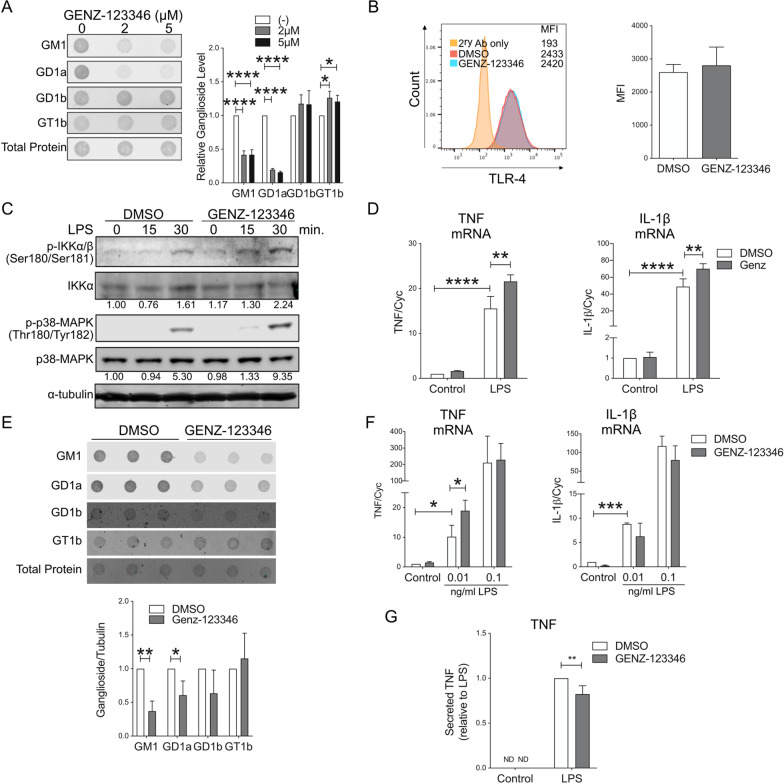
Methods: In vitro studies were performed using BV2 cells, mouse, rat, and human primary microglia cultures. Modulation of microglial ganglioside levels was achieved by administration of exogenous gangliosides, or by treatment with GENZ-123346 and L-t-PDMP, an inhibitor and an activator of glycolipid biosynthesis, respectively. Response of microglia to inflammatory stimuli (LPS, IL-1β, phagocytosis of latex beads) was measured by analysis of gene expression and/or secretion of pro-inflammatory cytokines. The effects of GM1 administration on microglia activation were also assessed in vivo in C57Bl/6 mice, following intraperitoneal injection of LPS.

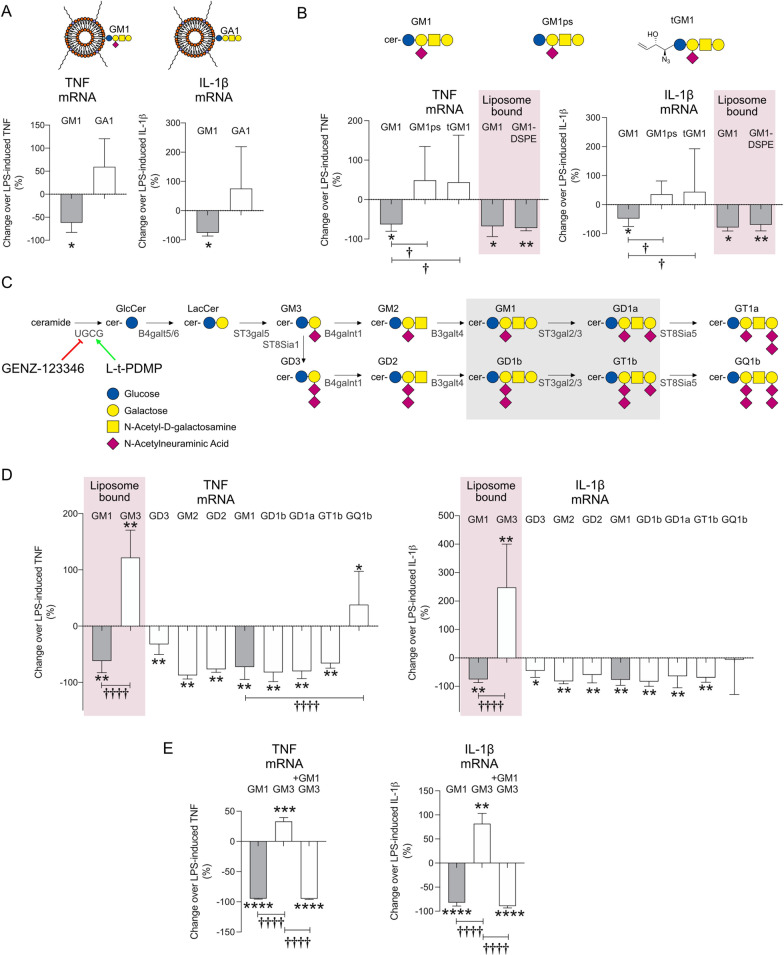
Results: GM1 decreased inflammatory microglia responses in vitro and in vivo, even when administered after microglia activation. These anti-inflammatory effects depended on the presence of the sialic acid residue in the GM1 glycan headgroup and the presence of a lipid tail. Other gangliosides shared similar anti-inflammatory effects in in vitro models, including GD3, GD1a, GD1b, and GT1b. Conversely, GM3 and GQ1b displayed pro-inflammatory activity. The anti-inflammatory effects of GM1 and other gangliosides were partially reproduced by increasing endogenous ganglioside levels with L-t-PDMP, whereas inhibition of glycolipid biosynthesis exacerbated microglial activation in response to LPS stimulation.

Conclusions: Our data suggest that gangliosides are important modulators of microglia inflammatory responses and reveal that administration of GM1 and other complex gangliosides exerts anti-inflammatory effects on microglia that could be exploited therapeutically.

Keywords: BV2 cells; GENZ-123346; GM1; Gangliosides; Inflammation; LPS; Liposomes; L–t-PDMP; Microglia.


Conflict of interest statement

SS and the University of Alberta hold a patent for the use of GM1 in HD. There are no other competing interests to declare.

Figures

Fig. 1
Fig. 1
Administration of GM1 before or after microglia stimulation with LPS curtails pro-inflammatory microglia activation. A BV2 microglial cells were pre-incubated with GM1 (50 µM) or vehicle for 1 h prior to stimulation with LPS (100 ng/ml). Representative immunoblots (of 3 independent experiments) show decreased levels of phospho-IKKα/β and phospho-p38 MAPK following stimulation with LPS in cells pre-treated with GM1. The numbers under the immunoblots are densitometric measurements for phospho-IKKα/β and phospho-p38 MAPK normalized over total protein, and show fold-change over unstimulated controls. B Rat primary microglia were pre-incubated with GM1 for 2 h followed by stimulation with LPS (100 ng/ml, 24 h) prior to measuring IL-6, IL-1β and nitric oxide (NO) released in the medium (N = 3 independent experiments). C Mouse primary microglia were stimulated for 3 h with LPS (100 ng/ml), washed and further incubated with GM1 (50 µM) for 8 h. Expression of TNF and IL-1β mRNA and TNF secreted in the medium were significantly decreased in GM1-treated cells (N = 3–5). D Human fetal microglia were treated as in C. GM1 treatment decreased IL-1β secretion into the medium (N = 3)
Fig. 2
Fig. 2
GM1 effects on brain microglia in vivo, after peripheral administration of LPS. A Schematic representation of in vivo administration of GM1 after LPS-induced systemic inflammation in mice (N = 5 per treatment). B Representative images of Iba-1 stained microglia in the cortex of control animals infused with vehicle (CTRL) or GM1 (CTRL + GM1), and in animals treated with LPS and subsequently infused with vehicle artificial cerebrospinal fluid (LPS) or GM1 (LPS + GM1). C Immunoblot in whole brain lysates and densitometric analysis show LPS-dependent increase in Iba 1 expression. D Cortical and striatal microglia (Iba-1+ cells) cell body area quantified with MetaXpress software. GM1 administration significantly decreases cell body area in the cortex, but not in the striatum. E IL-6 protein levels in whole mouse brain homogenate. aCSF, artificial cerebrospinal fluid. Bars show mean values ± STDEV. Two-way ANOVA with Tukey’s multiple comparisons test; *p < 0.05, **p < 0.01, ***p < 0.001
Fig. 3
Fig. 3
Pre-incubation of microglia with GM1 decreases pro-inflammatory activation triggered by IL-1β and by phagocytosis of polystyrene beads. A Mouse primary microglia were pre-incubated with GM1 (50 µM) for 1 h and then stimulated with IL-1β (5 ng/ml) for 24 h. GM1 blocked upregulation of IL-1β mRNA expression. B Phagocytosis of latex beads by BV-2 cells pre-treated with GM1 for 2 h. Representative histograms of beads uptake are shown on the left. GM1 pre-treatment did not affect uptake. Graphs show mRNA expression for IL-1β and TNF upon bead phagocytosis. Data are mean values ± STDEV of 3 independent experiments. Two-way ANOVA with Tukey’s multiple comparisons test was used in A. One-way ANOVA with Sidak’s multiple comparisons test was used in B. *p < 0.05, **p < 0.01, ***p < 0.001
Fig. 4
Fig. 4
Anti-inflammatory effects of GM1 require the presence of sialic acid and a lipid tail and are shared by other gangliosides, but not GM3 or GQ1b. A Mouse primary microglia were stimulated for 3 h with LPS (100 ng/ml), washed and further incubated with GM1- or GA1-loaded liposomes (200 µM liposome concentration). Naked liposomes were used as a control. TNF and IL-1β mRNA levels were measured by qPCR. Data are presented as percentage expression change compared to activated microglia incubated with control naked liposomes (N = 3–4). B Mouse primary microglia were stimulated with LPS and washed as in A, prior to incubation with GM1, GM1-pentasaccharide (GM1ps) or truncated azido-GM1ps (tGM1) (50 µM each) for 8 h. In parallel experiments, activated microglia were incubated with control naked liposomes or GM1- or GM1-DSPE-loaded liposomes (200 µM each—pink shaded area) for 8 h (N = 3–4). C Simplified scheme of the ganglioside biosynthetic pathway and related enzymes. L–t-PDMP is an activator and GENZ-123346 is an inhibitor of UDP-glucose ceramide glucosyltransferase (UGCG). The shaded grey area highlights the major brain gangliosides. Glucose: blue circle; galactose: yellow circle; N-acetylgalactosamine: yellow square; N-acetylneuraminic acid: purple diamond. D Mouse primary microglia stimulated with LPS (100 ng/ml) for 3 h were washed and further incubated with naked liposomes, GM1- or GM3-loaded liposomes (200 µM each—pink shaded area) or the indicated gangliosides (all at 50 µM in PBS) for 8 h. Data are presented as the percentage expression change compared to activated microglia incubated with vehicle controls (naked liposomes or PBS) (N = 3–7). E LPS-stimulated microglia were washed and incubated with GM1- or GM3-containing liposomes (200 µM), or with GM3-liposomes in the presence of GM1 in micellar form (50 µM) for 8 h. Co-administration of GM1 abrogated the pro-inflammatory effects of GM3. Data are presented as percentage gene expression change over LPS-activated microglia treated with vehicle. Mean values ± STDEV are shown. A two-tailed t-test was used to compare the effect of each treatment to their respective vehicle controls. *p < 0.05, **p < 0.01. One-way ANOVA with Sidak’s multiple comparisons test was used in B, D and E to compare the effect of GM1 to other gangliosides. p < 0.05, ✝✝✝✝p < 0.0001
Fig. 5
Fig. 5
Stimulation of the ganglioside biosynthetic pathway with L–t-PDMP decreases pro-inflammatory microglia activation. A BV2 cells were incubated for 72 h with the indicated concentrations of L–t-PDMP to increase ganglioside synthesis. A representative dot-blot and quantification of cellular ganglioside levels before and after treatment are shown (N = 3). B Representative histogram and relative flow cytometry quantification (mean fluorescence intensity, MFI) of TLR-4 present at the plasma membrane of BV-2 cells after treatment with 10 µM L–t-PDMP for 72 h. C Representative immunoblot showing phospho-IKK and phospho-p38 MAPK levels in BV2 cells stimulated with LPS (100 ng/ml) for the indicated time, after cell treatment with L–t-PDMP (15 µM, 72 h). The numbers under the blots show fold-change over untreated control, after normalization for total IKK or p38-MAPK levels. The experiment was repeated twice with similar results. D Expression of TNF and IL-1β mRNA in BV-2 cells treated as indicated above (N = 3). E Dot-blot analysis of ganglioside levels in murine primary microglia incubated with L–t-PDMP (10 µM for 72 h). F Expression of IL-1β and TNF mRNA in primary microglia treated for 72 h with 10 µM L–t-PDMP and stimulated with the indicated concentrations of LPS for 6 h (N = 3). G TNF secretion by murine microglia after treatment with L–t-PDMP and stimulation with the indicated concentrations of LPS (N = 3). Data shown are mean values ± STDEV. One-way ANOVA with Sidak’s multiple comparisons test was used in A; two-tailed t test was used in B and E; two-way ANOVA with Tukey’s multiple comparisons test was used in D, F and G. *p < 0.05, **p < 0.01, ***p < 0.001, ****p < 0.0001
Fig. 6
Fig. 6
Inhibition of the ganglioside biosynthetic pathway enhances microglial response to LPS. A Dot-blot and relative quantification of cellular ganglioside levels in BV2 cells treated with the indicated concentrations of GENZ-123346 for 72 h shows a significant decrease in levels of GM1 and GD1a (N = 3). B Representative histogram and relative flow cytometry quantification (mean fluorescence intensity, MFI) of TLR-4 present at the plasma membrane of BV-2 cells after treatment with 10 µM GENZ-123346 for 72 h. C Representative immunoblot showing increased phosphorylation of IKK and p38 MAPK in BV-2 cells treated with GENZ-123346 and stimulated with LPS (100 ng/ml) for the indicated time. The numbers under the blots indicate the fold-change of p-IKK and p-p38-MAPK compared to untreated control, after normalization over total IKK or p38-MAPK protein levels. D Expression of IL-1β and TNF mRNA in BV-2 cell stimulated with LPS (100 ng/ml) after 72 h incubation with GENZ-123346 (5 μM) (N = 3). E Dot-blot and quantification of ganglioside levels in primary mouse microglia incubated with 10 µM GENZ-123346 for 72 h show a significant decrease in the levels of both GM1 and GD1a (N = 3). F Expression of IL-1β and TNF mRNA in mouse microglia treated with GENZ-123346 as in E, and after stimulation with the indicated concentrations of LPS for 6 h (N = 3). G TNF secretion by control and GENZ-123346-treated cells upon stimulation with LPS (1 ng/ml) (N = 3). Data shown are mean values ± STDEV. One-way ANOVA with Sidak’s multiple comparisons test was used in A; two-tailed t test was used in B and E; two-way ANOVA with Tukey’s multiple comparisons test was used in D, F and G. *p < 0.05, **p < 0.01, ***p < 0.001, ****p < 0.0001

Similar articles

Cited by

References

    1. Frost JL, Schafer DP. Microglia: architects of the developing nervous system. Trends Cell Biol. 2016;26(8):587–597. - PMC - PubMed
    1. Li Q, Barres BA. Microglia and macrophages in brain homeostasis and disease. Nat Rev Immunol. 2018;18(4):225–242. - PubMed
    1. Nimmerjahn A, Kirchhoff F, Helmchen F. Resting microglial cells are highly dynamic surveillants of brain parenchyma in vivo. Science. 2005;308(5726):1314–1318. - PubMed
    1. Ueno M, Fujita Y, Tanaka T, Nakamura Y, Kikuta J, Ishii M, et al. Layer V cortical neurons require microglial support for survival during postnatal development. Nat Neurosci. 2013;16(5):543–551. - PubMed
    1. Parkhurst CN, Yang G, Ninan I, Savas JN, Yates JR, 3rd, Lafaille JJ, et al. Microglia promote learning-dependent synapse formation through brain-derived neurotrophic factor. Cell. 2013;155(7):1596–1609. - PMC - PubMed

Substances

LinkOut - more resources