. 2022 Jan;10(1):e003325.
doi: 10.1136/jitc-2021-003325.

Intratumor expanded T cell clones can be non-sentinel lymph node derived in breast cancer revealed by single-cell immune profiling

Affiliations

Intratumor expanded T cell clones can be non-sentinel lymph node derived in breast cancer revealed by single-cell immune profiling

Shiping Jiao et al. J Immunother Cancer. 2022 Jan.

Abstract

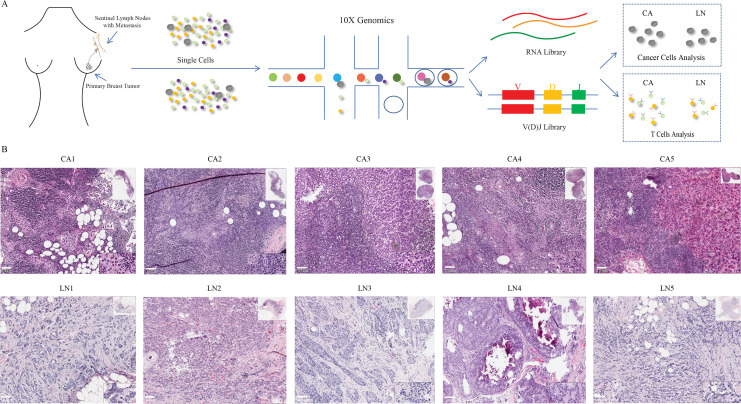
Background: Sentinel lymph nodes (LNs) are regarded as key immune surveillance sites in cancer wherein mature dendritic cells present tumor-derived antigens to prime and activate T cells, which then migrate to the tumor site. However, it is unclear whether the tumor-specific T cells can be elicited within the tumor independent of the sentinel LNs.

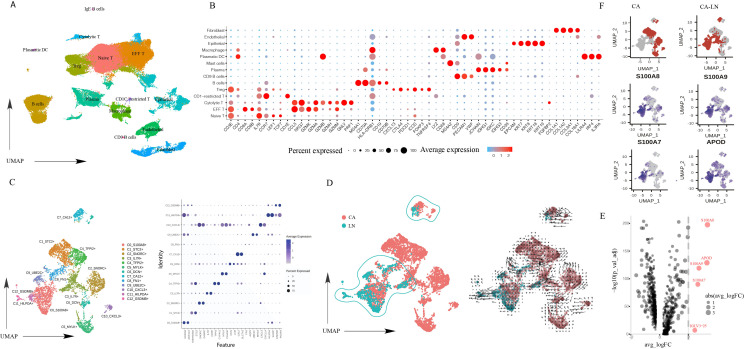
Methods: We performed an integrative analysis of gene expression profiles of 65,285 cells and T cell receptor sequences of 15,831 T cells from 5 paired primary breast tumors and sentinel LNs to identify where clonal T cells come from and the characteristics of those clonal T cells.

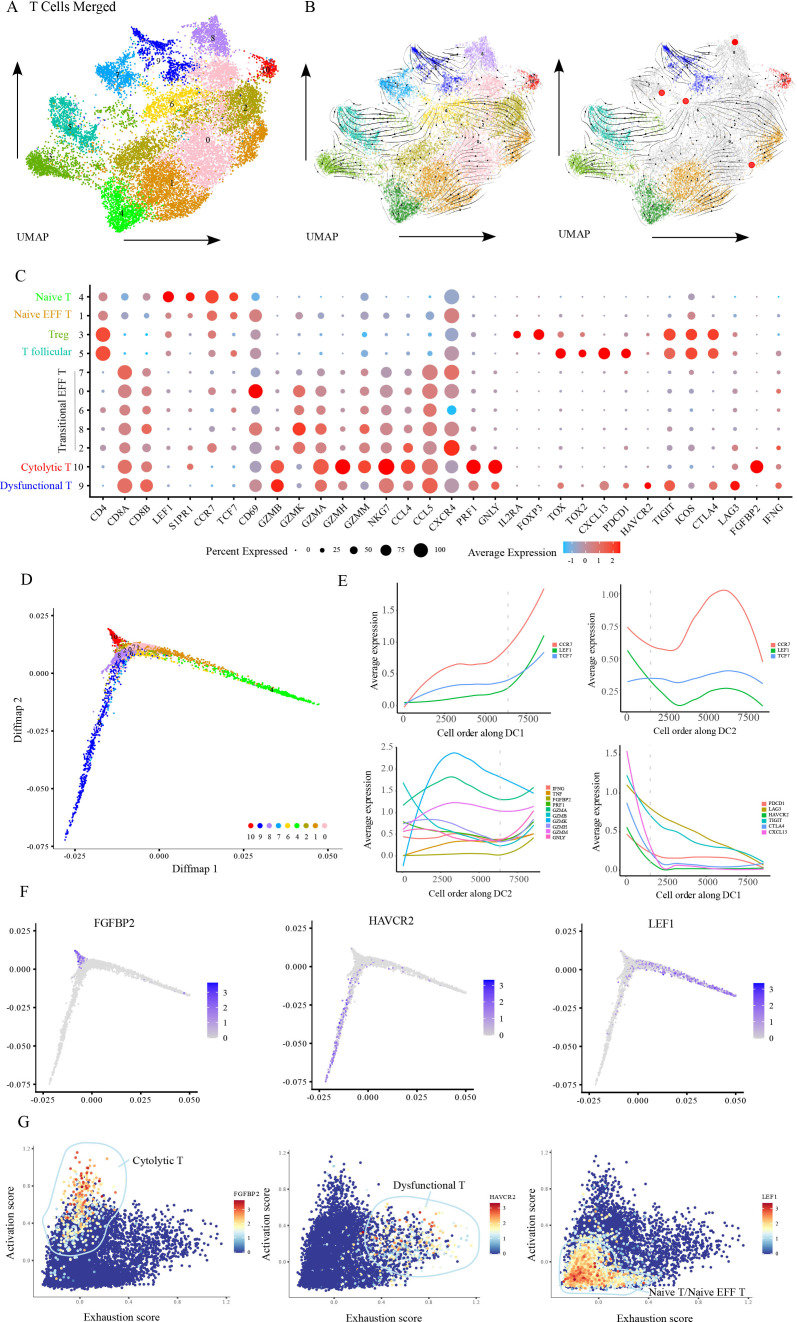
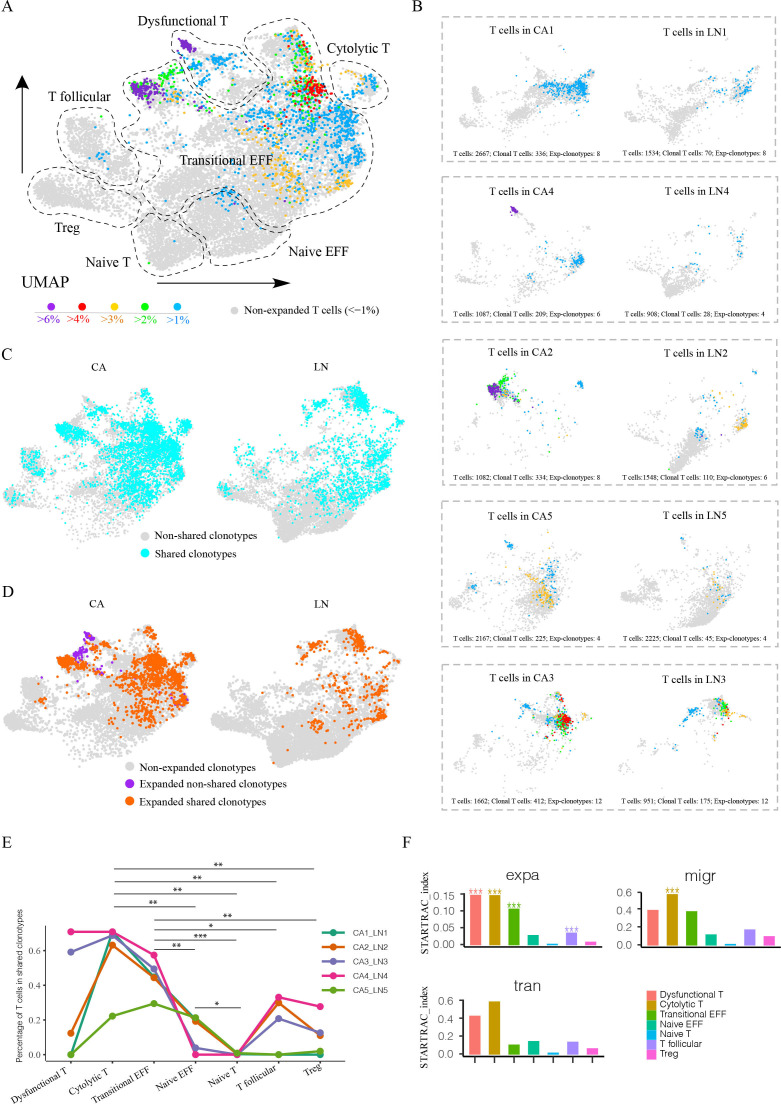
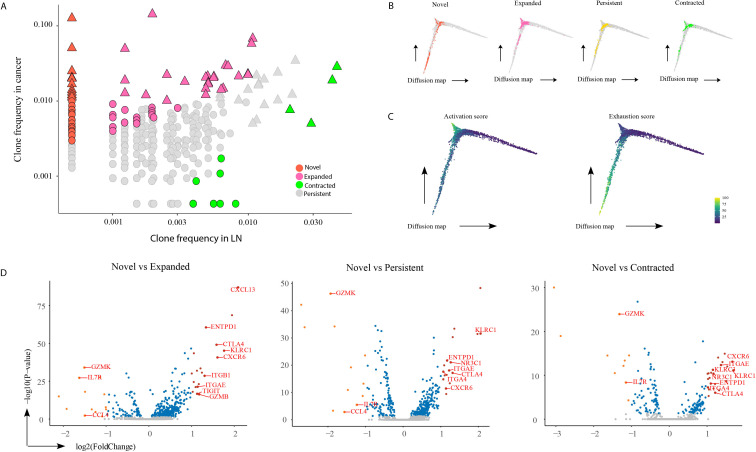
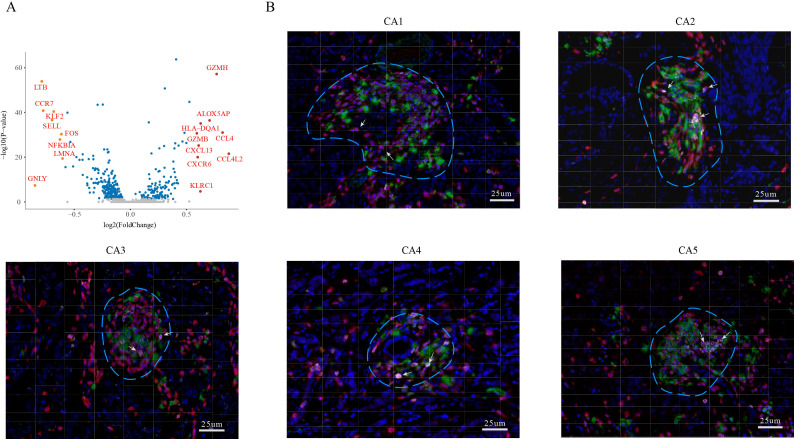
Results: The proportion of clonal T cells was higher in the primary tumors compared with the sentinel LNs, whereas all expanded clones identified in the sentinel LN were also present in the primary tumors. In contrast, 10.91% of the expanded clones in the primary tumors were not found in the sentinel LNs. These novel intratumoral T cell clones were characterized by high tissues retention capacity (CXCR6 +ITGAE+) and a distinct coinhibitory pattern (CD39 +NKG2A+) compared with the expanded T cell clones common to both sites. Furthermore, multiplex immunofluorescence imaging showed the presence of tertiary lymphoid structures (TLS) in the primary breast tumors wherein the activated cytolytic T cells were concentrated, indicating its possible role in eliciting non-sentinel LN-derived T cell clones.

Conclusions: Our study revealed expanded intratumor non-sentinel LN derived T cell clones located in the TLS, which points to the need for exploring the role of TLS in antitumor immunity.

Keywords: CD8-positive T-lymphocytes; adaptive immunity; breast neoplasms; immunity.


Conflict of interest statement

Competing interests: None declared.

Figures

Figure 1
Figure 1
Primary cancer cells inclined to metastasis express high levels of S100A and APOD. (A) UMAP of all cells with each cell type indicated by a color code. (B) Expression of characteristic markers in each cell type. (C) UMAP of malignant cells with color-coded clusters and expression of characteristic genes in each cluster. (D) UMAP of malignant cells from CA (red) and LN (blue), and the velocities (arrows) of malignant cell. (E) Volcano plot of DEGs. Differential expression test was perform by Wilcoxon rank sum test. Significant DEGs with p<0.05 and absolute value of avg_logFC≥2 are indicated in red. (F) Distribution of cancer cells in the pure (CA) and mixed (CA & LN) areas in the UMAP space and the expression of four DEGs. avg_logFC, log fold-chage of the average expression between the two groups; CA, cancer; DC, dendritic cell; DEGs, differentially expressed genes; LN, lymph node; UMAP, uniform manifold approximation and projection.
Figure 2
Figure 2
Single-cell RNA and TCR analysis of primary breast tumors and paired sentinel LNs of 5 patients. (A) Schematic illustration of the analyses performed in this study. (B) Representative images of HE-stained primary breast tumors and sentinel LNs of 5 patients. LN, lymph node; TCR, T cell receptor.
Figure 3
Figure 3
Characteristics of T cells residing in primary breast cancers and paired sentinel LNs. (A) UMAP of T cells with color-coded clusters. (B) Velocities (arrows) of T cells in the different clusters. (C) Expression of characteristics genes in each T cell subset. (D) Diffusion map of all CD8 +T cells. (E) Average expression of naïve, cytolytic and exhaustion markers across diffusion component one and diffusion component 2. (F) Diffusion map of cytolytic (FGFBP2), exhaustion (HAVCR2) and naïve (LEF1) markers. (G) Scatter plots of T cells in the space of activation and exhaustion scores color-coded by expression levels of FGFBP2, HAVCR2 and LEF1. DC, dendritic cell; FGFBP2, fibroblast growth factor binding protein 2; HAVCR2, hepatitis A virus cellular receptor 2; LEF1, lymphoid enhancer binding factor 1; LN, lymph node; UMAP, uniform manifold approximation and projection.
Figure 4
Figure 4
Cytolytic T cell population showed the strongest expansion, migration and transition capacity. (A) UMAP of T cells color-coded by percentage of TRB clonotypes. (B) UMAP of T cells from primary tumor and paired sentinel LN in each patient, color-coded by percentage of TRB clonotypes. Exp-clonotype: expanded clonotype. (C) UMAP of T cells in shared and non-shared TRB clonotypes between primary tumors and sentinel LN. (D) UMAP of T cells in shared expanded, non-shared expanded clonotypes between primary tumors and sentinel LN, and non-expanded clonotypes. (E) Percentage of T cells in shared clonotypes between primary tumors and sentinel LN for each patient in each T cell subset, significance was measured by t-test after natural log-transformed percentage values. *P<0.05, **p<0.01, ***p<0.001, respectively. (E) STARTRAC expa, migr, and tran indices of each T cell subset, ***p<0.001. CA, cancer; LN, lymph node; TRB, T cell receptor beta locus; UMAP, uniform manifold approximation and projection.
Figure 5
Figure 5
Intratumoral dominant cancer-specific T cell clones are potentially derived from non-sentinel LNs. (A) Frequencies of novel, expanded, persistent, and contracted clones; clones with TRB frequency >0.01 in tumors or sentinel LN are marked as triangle, others as circle. (B) Diffusion map of novel, expanded, persistent and contracted clones. (C) Diffusion map of activation and exhaustion scores. (D) Differentially expressed genes between novel and expanded, persistent and contracted clones. Significant DEGs were screened by p<0.05 and avg_FC>=2. DEGs, differentially expressed genes; LN, lymph nodes; TRB, T cell receptor beta locus.
Figure 6
Figure 6
The TLS in primary breast cancer may induce intratumoral novel T cell clones. (A) DEGs between expanded clonal CD8 T cells and antigen-experienced non-clonal CD8 T cells. Significant DEGs were screened by p<0.05 and avg_FC>=1.5. (B) Multiplex immunofluorescence imaging of tumor tissues. Red - CD3+, white - CCL4+. CD3 +CCL4+ is the signature of clonal effector T cells. Green - CD20 +B cells. The aggregation of T and B cells represents TLS. CA, cancer; DEGs, differentially expressed genes; TLS, tertiary lymphoid structures.

Similar articles

Cited by

References

    1. Long B, Brém E, Koyfman A. Oncologic emergencies: immune-based cancer therapies and complications. West J Emerg Med 2020;21:566–80. 10.5811/westjem.2020.1.45898 - DOI - PMC - PubMed
    1. Mellman I, Coukos G, Dranoff G. Cancer immunotherapy comes of age. Nature 2011;480:480–9. 10.1038/nature10673 - DOI - PMC - PubMed
    1. Sautès-Fridman C, Petitprez F, Calderaro J, et al. . Tertiary lymphoid structures in the era of cancer immunotherapy. Nat Rev Cancer 2019;19:307–25. 10.1038/s41568-019-0144-6 - DOI - PubMed
    1. Hollern DP, Xu N, Thennavan A, et al. . B cells and T follicular helper cells mediate response to checkpoint inhibitors in high mutation burden mouse models of breast cancer. Cell 2019;179:e1121:1191–206. 10.1016/j.cell.2019.10.028 - DOI - PMC - PubMed
    1. Cabrita R, Lauss M, Sanna A, et al. . Tertiary lymphoid structures improve immunotherapy and survival in melanoma. Nature 2020;577:561–5. 10.1038/s41586-019-1914-8 - DOI - PubMed

Publication types