. 2022 Apr 1;20(4):622-636.
doi: 10.1158/1541-7786.MCR-21-0149.

Small-Molecule NSC59984 Induces Mutant p53 Degradation through a ROS-ERK2-MDM2 Axis in Cancer Cells

Affiliations

Small-Molecule NSC59984 Induces Mutant p53 Degradation through a ROS-ERK2-MDM2 Axis in Cancer Cells

Shengliang Zhang et al. Mol Cancer Res. .

Abstract

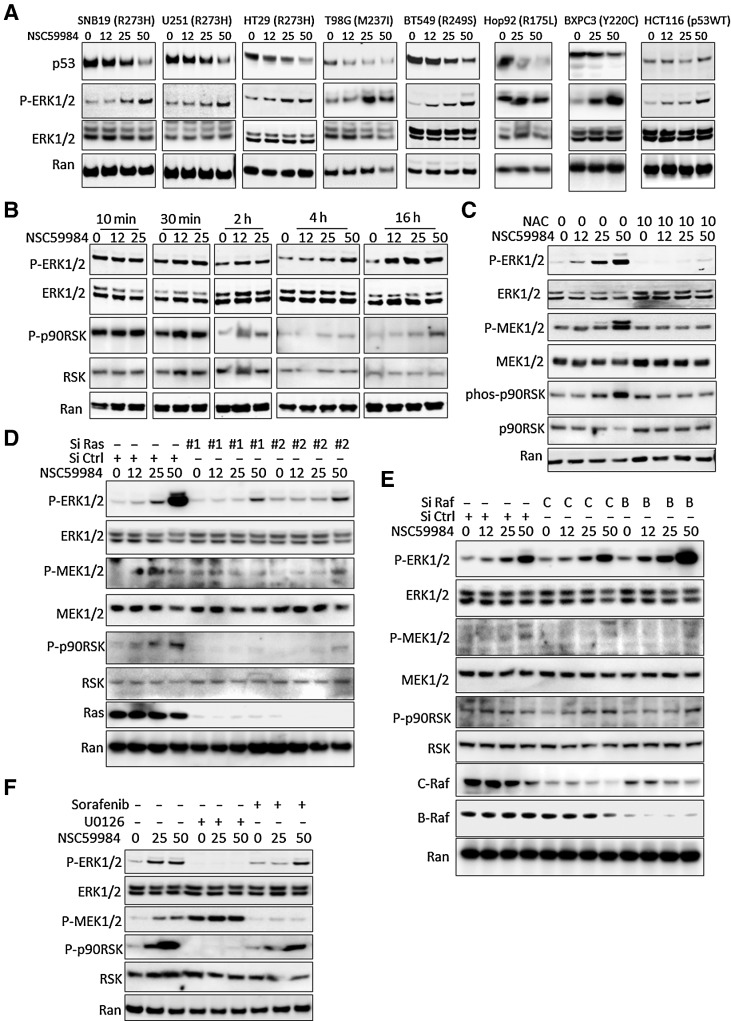
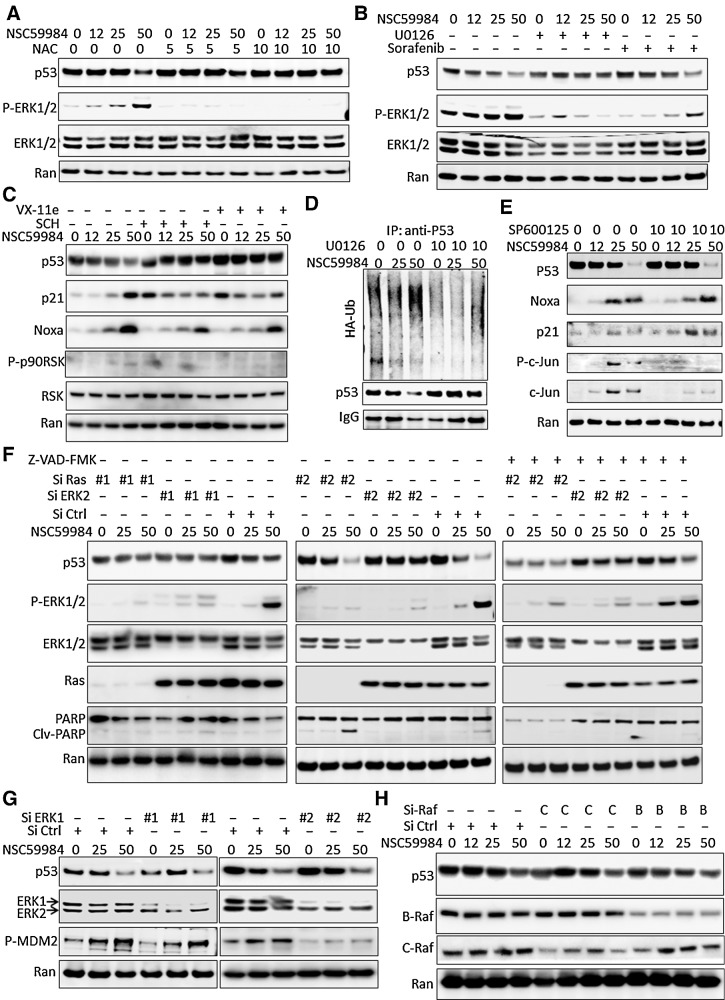
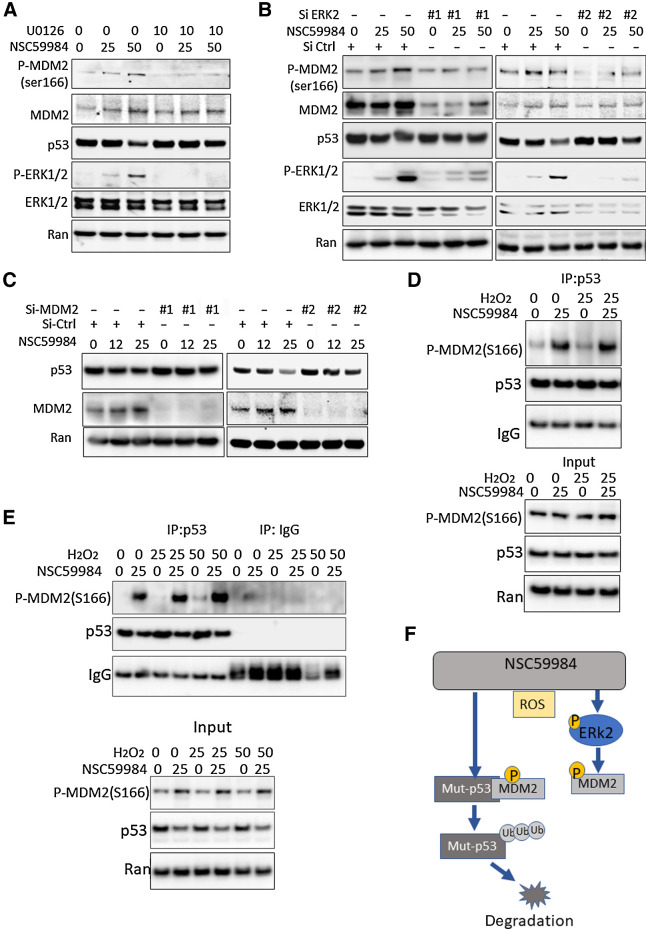
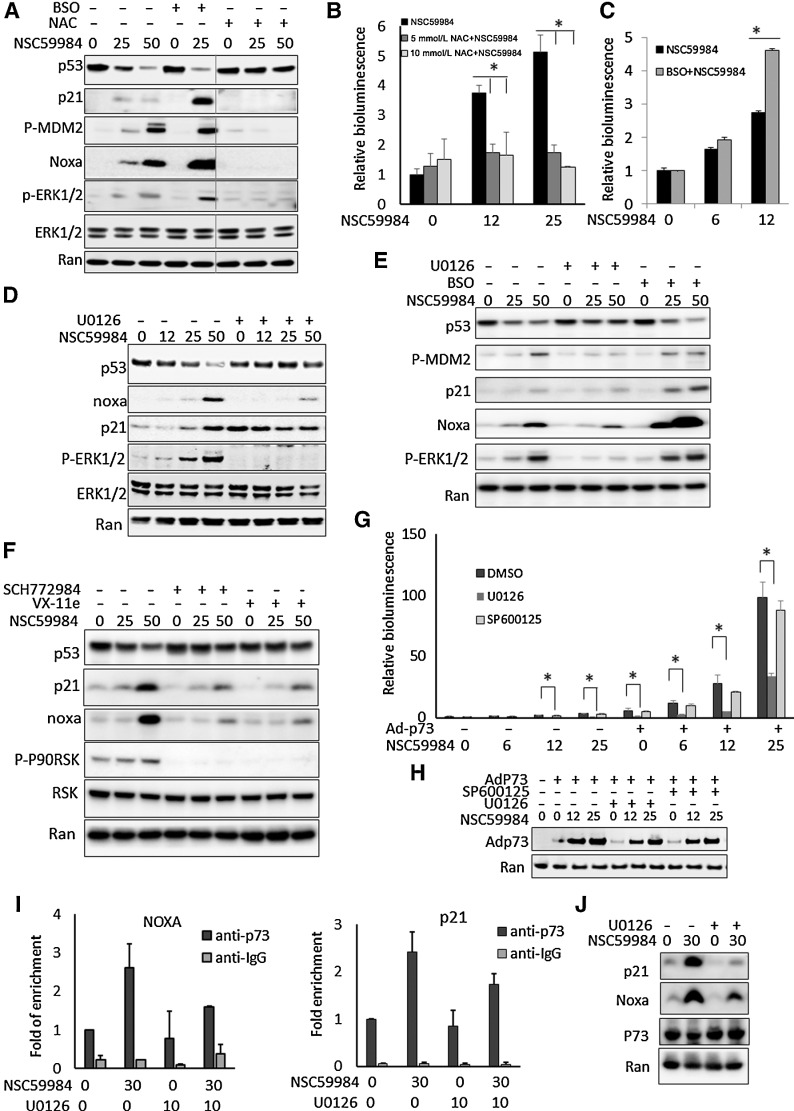
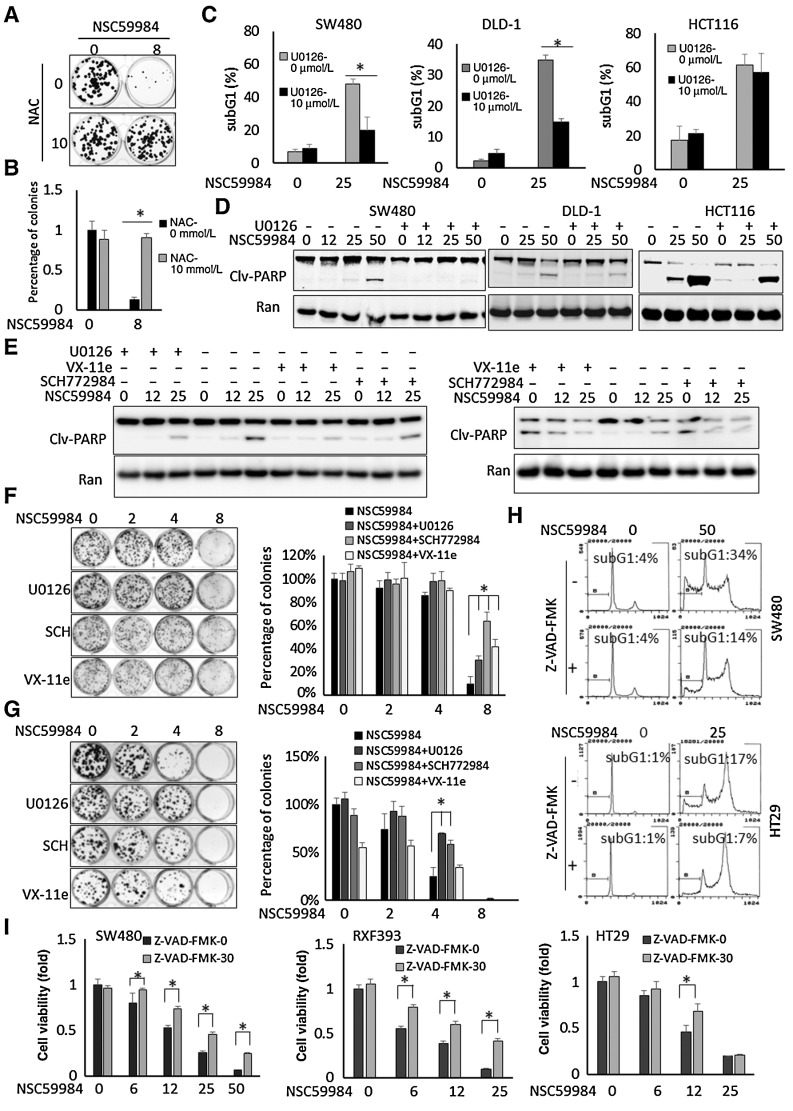
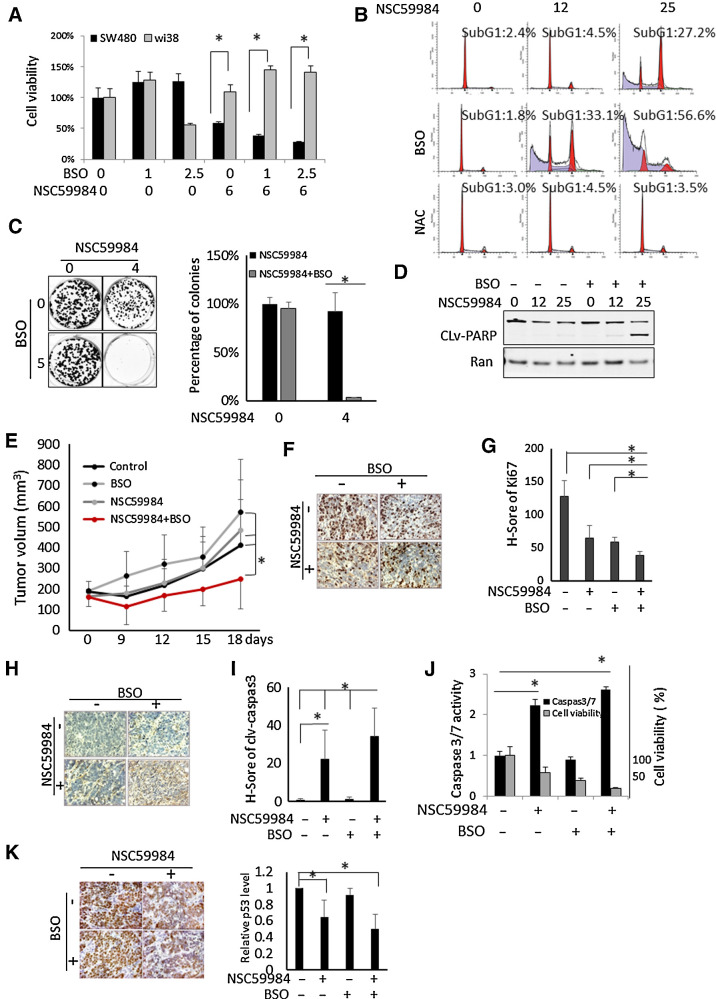
Increased reactive oxygen species (ROS) and hyperstabilized mutant p53 are common in cancer. Hyperstabilized mutant p53 contributes to its gain of function (GOF) which confers resistance to chemotherapy and radiotherapy. Targeting mutant p53 degradation is a promising cancer therapeutic strategy. We used a small-molecule NSC59984 to explore elimination of mutant p53 in cancer cells, and identified an inducible ROS-ERK2-MDM2 axis as a vulnerability for induction of mutant p53 degradation in cancer cells. NSC59984 treatment promotes a constitutive phosphorylation of ERK2 via ROS in cancer cells. The NSC59984-sustained ERK2 activation is required for MDM2 phosphorylation at serine-166. NSC59984 enhances phosphorylated-MDM2 binding to mutant p53, which leads to mutant p53 ubiquitination and degradation. High cellular ROS increases the efficacy of NSC59984 targeting mutant p53 degradation and antitumor effects. Our data suggest that mutant p53 stabilization has a vulnerability under high ROS cellular conditions, which can be exploited by compounds to target mutant p53 protein degradation through the activation of a ROS-ERK2-MDM2 axis in cancer cells.

Implications: An inducible ROS-ERK2-MDM2 axis exposes a vulnerability in mutant p53 stabilization and can be exploited by small-molecule compounds to induce mutant p53 degradation for cancer therapy.


Figures

Figure 1. NSC59984 constitutively induces ERK1/2 phosphorylation. A, The phosphorylation of ERK1/2 in different cancer cells. Cancer cells were treated with NSC59984 (μmol/L) for 16 hours. B, The phosphorylation of ERK1/2 in SW480 cells treated with NSC59984 (μmol/L) in a dose and time course. C, The phosphorylation of ERK1/2 in SW480 cancer cells treated with NSC59984 (μmol/L) and NAC (mmol/L) for 16 hours. D, The phosphorylation of ERK1/2 in SW480 cancer cells with knockdown of Ras. SW480 cells were transfected with siRNAs (siRNA #1 and #2) to knockdown Ras, followed with NSC59984 (μmol/L) treatment for 16 hours. E, The phosphorylation of ERK1/2 in SW480 cells with knockdown of Raf expression. C-Raf or B-Raf expression was knocked down by siRNA in SW480 cells, followed with NSC59984 (μmol/L) treatment for 16 hours. F, The phosphorylation of ERK1/2 in SW480 cells treated with NSC59984 (μmol/L) and the different kinase inhibitors (μmol/L) as indicated for 16 hours.
Figure 1.
NSC59984 constitutively induces ERK1/2 phosphorylation. A, The phosphorylation of ERK1/2 in different cancer cells. Cancer cells were treated with NSC59984 (μmol/L) for 16 hours. B, The phosphorylation of ERK1/2 in SW480 cells treated with NSC59984 (μmol/L) in a dose and time course. C, The phosphorylation of ERK1/2 in SW480 cancer cells treated with NSC59984 (μmol/L) and NAC (mmol/L) for 16 hours. D, The phosphorylation of ERK1/2 in SW480 cancer cells with knockdown of Ras. SW480 cells were transfected with siRNAs (siRNA #1 and #2) to knockdown Ras, followed with NSC59984 (μmol/L) treatment for 16 hours. E, The phosphorylation of ERK1/2 in SW480 cells with knockdown of Raf expression. C-Raf or B-Raf expression was knocked down by siRNA in SW480 cells, followed with NSC59984 (μmol/L) treatment for 16 hours. F, The phosphorylation of ERK1/2 in SW480 cells treated with NSC59984 (μmol/L) and the different kinase inhibitors (μmol/L) as indicated for 16 hours.
Figure 2. ROS is required for NSC59984-induced mutant p53 degradation through ERK2. A, The expression of mutant p53 at the protein level in SW480 cells treated with NSC59984 (μmol/L) and NAC (mmol/L) for 16 hours. B, The expression of mutant p53 at the protein level in SW480 cancer cells treated with NSC59984 (μmol/L) and U0126 (10 μmol/L) or Sorafenib (32 μmol/L) for 16 hours. C, The expression of mutant p53, p21, and noxa at the protein levels in SW480 cancer cells treated with NSC59984 (μmol/L) and ERK1/2 inhibitor, SCH772984 (SCH, 1 μmol/L) or VX-11e (5 μmol/L) for 16 hours. D, The ubiquitination assay by IP in SW480 cells. SW480 cells were transfected with HA-Ub for 48 hours, followed with the treatment with NSC59984 (μmol/L) and U0126 (10 μmol/L) for an additional 8 hours. E, The protein level of mutant p53 and p53 targets in SW480 cells treated with NSC59984 (μmol/L) and SP600125 (10 μmol/L) for 16 hours. F, The expression of mutant p53 at the protein level in the cancer cells with knockdown of Ras and ERK2. Ras and ERK2 were knocked down in SW480 cells with siRNA (#1 and #2 for each target), followed by treatment with NSC59984 (μmol/L) and 20 μmol/L of Z-VAD-FMK for 16 hours. G, The expression of the mutant p53 at the protein level in the ERK1-knockdown SW480 cells treated with NSC59984 (μmol/L) for 16 hours. ERK1 was knocked down by two siRNAs. H, The expression of the mutant p53 at the protein level in the Raf-knockdown cancer cells. C-Raf and B-Raf were knocked down in SW480 cells by siRNA, followed with NSC59984 treatment (μmol/L) for 16 hours.
Figure 2.
ROS is required for NSC59984-induced mutant p53 degradation through ERK2. A, The expression of mutant p53 at the protein level in SW480 cells treated with NSC59984 (μmol/L) and NAC (mmol/L) for 16 hours. B, The expression of mutant p53 at the protein level in SW480 cancer cells treated with NSC59984 (μmol/L) and U0126 (10 μmol/L) or Sorafenib (32 μmol/L) for 16 hours. C, The expression of mutant p53, p21, and noxa at the protein levels in SW480 cancer cells treated with NSC59984 (μmol/L) and ERK1/2 inhibitor, SCH772984 (SCH, 1 μmol/L) or VX-11e (5 μmol/L) for 16 hours. D, The ubiquitination assay by IP in SW480 cells. SW480 cells were transfected with HA-Ub for 48 hours, followed with the treatment with NSC59984 (μmol/L) and U0126 (10 μmol/L) for an additional 8 hours. E, The protein level of mutant p53 and p53 targets in SW480 cells treated with NSC59984 (μmol/L) and SP600125 (10 μmol/L) for 16 hours. F, The expression of mutant p53 at the protein level in the cancer cells with knockdown of Ras and ERK2. Ras and ERK2 were knocked down in SW480 cells with siRNA (#1 and #2 for each target), followed by treatment with NSC59984 (μmol/L) and 20 μmol/L of Z-VAD-FMK for 16 hours. G, The expression of the mutant p53 at the protein level in the ERK1-knockdown SW480 cells treated with NSC59984 (μmol/L) for 16 hours. ERK1 was knocked down by two siRNAs. H, The expression of the mutant p53 at the protein level in the Raf-knockdown cancer cells. C-Raf and B-Raf were knocked down in SW480 cells by siRNA, followed with NSC59984 treatment (μmol/L) for 16 hours.
Figure 3. NSC59984 induces MDM2-dependent mutant p53 degradation. A, Phosphorylation of MDM2 at ser166 in SW480 cells treated with NSC59984 (μmol/L) and U0126 (μmol/L) for 16 hours. B, Phosphorylation of MDM2 at ser166 in cells with knockdown of ERK2. The ERK2 was knocked down by two siRNAs (#1 and #2) in SW480 cells. The cells were treated with NSC59984 (μmol/L) for 16 hours. C, The expression of mutant p53 at the protein level in the cells with knockdown of MDM2. The MDM2 was knocked down with siRNA (#1 or #2) in SW480 cells. The cells were treated with NSC59984 (micromole/L) for 16 hours. D, The IP assay in SW480 cells. SW480 cells were treated with NCC59984 (μmol/L) and H2O2 (μmol/L) for 8 hours. E, The IP assay in HT29 cells. HT29 cells were treated with NCC59984 (μmol/L) and H2O2 (μmol/L) for 8 hours. F, The schematic of the mechanism of action of NSC59984 on mutant p53 degradation via an ROS-ERK2-MDM2 axis.
Figure 3.
NSC59984 induces MDM2-dependent mutant p53 degradation. A, Phosphorylation of MDM2 at ser166 in SW480 cells treated with NSC59984 (μmol/L) and U0126 (μmol/L) for 16 hours. B, Phosphorylation of MDM2 at ser166 in cells with knockdown of ERK2. The ERK2 was knocked down by two siRNAs (#1 and #2) in SW480 cells. The cells were treated with NSC59984 (μmol/L) for 16 hours. C, The expression of mutant p53 at the protein level in the cells with knockdown of MDM2. The MDM2 was knocked down with siRNA (#1 or #2) in SW480 cells. The cells were treated with NSC59984 (micromole/L) for 16 hours. D, The IP assay in SW480 cells. SW480 cells were treated with NCC59984 (μmol/L) and H2O2 (μmol/L) for 8 hours. E, The IP assay in HT29 cells. HT29 cells were treated with NCC59984 (μmol/L) and H2O2 (μmol/L) for 8 hours. F, The schematic of the mechanism of action of NSC59984 on mutant p53 degradation via an ROS-ERK2-MDM2 axis.
Figure 4. ROS is required for NSC59984 to restore p53 pathway signaling through ERK2. A, The protein level of mutant p53 and p53 targets in HT29 cells following treatment with NSC59984 (μmol/L) in combination with NAC (10 mmol/L) or BSO (10 μmol/L) for 16 hours. B, p53-responsive reporter bioluminescence in SW480 cells treated with NSC59984 (μmol/L) and NAC (10 mmol/L) for 16 hours. C, p53-responsive reporter bioluminescence in SW480 cells treated with NSC59984 (μmol/L) and BSO (10 μmol/L) for 16 hours. D, The expression of mutant p53 and p53 targets at the protein level in SW480 cells treated with NSC59984 (μmol/L) and U0126 (10 μmol/L) for 16 hours. E, The protein level of mutant p53 and p53 targets in RXF393 cancer cells carrying mutant p53 (R175H). The cells were treated with NSC59984 (μmol/L) and U0126 (10 μmol/L) or BSO (20 μmol/L) for 16 hours. F, The expression of mutant p53 and p53 targets at the protein levels in HT29 cells treated with NSC59984 (μmol/L) and ERK1/2 inhibitor SCH772984 (1 μmol/L) or VX-11e (5 μmol/L) for 16 hours. G, The p53-responsive reporter bioluminescence assay in SW480 cells with the overexpression of Ad-p73. p73 was overexpressed in SW480 cells by adenovirus (Ad-p73) infection. The cells were treated with NSC59984 (μmol/L) and U0126 (10 μmol/L) or SP600125 (10 μmol/L) for 16 hours. Data represent mean ± SD. *, P < 0.05 compared with the NSC59984 treatment at each dosage. H, The Ad-p73 expressed protein levels in the cells with the adenovirus infection (G). I, ChIP-PCR assay. p73 was overexpressed in HT29 with adenovirus infection. Following treatment with NSC59984 (μmol/L) and U0126 (μmol/L) for 7 hours. ChIP assay was performed with anti-P73 and IgG as a control. The p21 or Noxa promoters were quantified by real-time PCR using the ChIP-eluted DNA. Data were normalized to the ChIP with anti-p73 in the cells treated with DMSO treatment as a control. Data represent mean ± SD, N = 2. ANOVA test, P < 0.05. J, P21 and Noxa at the protein level in HT29 cells by Western blot assay (I).
Figure 4.
ROS is required for NSC59984 to restore p53 pathway signaling through ERK2. A, The protein level of mutant p53 and p53 targets in HT29 cells following treatment with NSC59984 (μmol/L) in combination with NAC (10 mmol/L) or BSO (10 μmol/L) for 16 hours. B, p53-responsive reporter bioluminescence in SW480 cells treated with NSC59984 (μmol/L) and NAC (10 mmol/L) for 16 hours. C, p53-responsive reporter bioluminescence in SW480 cells treated with NSC59984 (μmol/L) and BSO (10 μmol/L) for 16 hours. D, The expression of mutant p53 and p53 targets at the protein level in SW480 cells treated with NSC59984 (μmol/L) and U0126 (10 μmol/L) for 16 hours. E, The protein level of mutant p53 and p53 targets in RXF393 cancer cells carrying mutant p53 (R175H). The cells were treated with NSC59984 (μmol/L) and U0126 (10 μmol/L) or BSO (20 μmol/L) for 16 hours. F, The expression of mutant p53 and p53 targets at the protein levels in HT29 cells treated with NSC59984 (μmol/L) and ERK1/2 inhibitor SCH772984 (1 μmol/L) or VX-11e (5 μmol/L) for 16 hours. G, The p53-responsive reporter bioluminescence assay in SW480 cells with the overexpression of Ad-p73. p73 was overexpressed in SW480 cells by adenovirus (Ad-p73) infection. The cells were treated with NSC59984 (μmol/L) and U0126 (10 μmol/L) or SP600125 (10 μmol/L) for 16 hours. Data represent mean ± SD. *, P < 0.05 compared with the NSC59984 treatment at each dosage. H, The Ad-p73 expressed protein levels in the cells with the adenovirus infection (G). I, ChIP-PCR assay. p73 was overexpressed in HT29 with adenovirus infection. Following treatment with NSC59984 (μmol/L) and U0126 (μmol/L) for 7 hours. ChIP assay was performed with anti-P73 and IgG as a control. The p21 or Noxa promoters were quantified by real-time PCR using the ChIP-eluted DNA. Data were normalized to the ChIP with anti-p73 in the cells treated with DMSO treatment as a control. Data represent mean ± SD, N = 2. ANOVA test, P < 0.05. J, P21 and Noxa at the protein level in HT29 cells by Western blot assay (I).
Figure 5. NSC59984 induces ERK2-dependent cell death in mutant p53-expressing cancer cells. A, Colony formation in HT29 cancer cells upon NSC59984 (μmol/L) treatment in combination with NAC (10 mmol/L) as described in the Materials and Methods. B, The relative number of the colonies (A). C, Sub-G1 flow cytometric analysis in different cancer cells treated with NSC59984 (μmol/L) and U0126 (10 μmol/L) for 72 hours. Data were obtained from two independent experiments. *, P < 0.05. D, Cleaved-PARP in SW480, DLD-1, and HCT116 cells treated with NSC59984 (μmol/L) and 10 μmol/L of U0126 for 36 hours. The cleaved-PARP was examined by Western blot analysis. E, Cleaved-PARP in Hop92 cells (left) and SW480 cells (right) treated with NSC59984 (μmol/L) and U0126 (10 μmol/L), SCH772984 (1 μmol/L) or VX-11e (5 μmol/L) for 36 hours. The cleaved-PARP was examined by Western blot analysis. F, The colony formation in HT29 cells. G, The colony formation in DLD-1 cells. The cells (F and G) were treated with NSC59984 (μmol/L) and U0126 (10 μmol/L), SCH772984 (SCH,1 μmol/L) or VX-11e (5 μmol/L). The percentages of colonies (B, F, and G) were obtained with DMSO treatment. Data represent mean ± SD from triplicate treatments. *, P < 0.05. H, The cell-cycle profiles of SW480 and HT29 cells treated with NSC59984 (μmol/L) in combination with Z-VAD-FMK (20 μmol/L) for 72 hours. I, Cell viability assay. Cancer cells were treated with NSC59984 (μmol/L) in the presence or absence of ZVAD-FMK (30 μmol/L) for 72 hours. Cell viability was determined by Cell Titer-Glo luminescence. Cell viability data were normalized to those of DMSO as a control. Data represent mean ± SD. *, P < 0.05 compared with the NSC59984 treatment at each dosage.
Figure 5.
NSC59984 induces ERK2-dependent cell death in mutant p53-expressing cancer cells. A, Colony formation in HT29 cancer cells upon NSC59984 (μmol/L) treatment in combination with NAC (10 mmol/L) as described in the Materials and Methods. B, The relative number of the colonies (A). C, Sub-G1 flow cytometric analysis in different cancer cells treated with NSC59984 (μmol/L) and U0126 (10 μmol/L) for 72 hours. Data were obtained from two independent experiments. *, P < 0.05. D, Cleaved-PARP in SW480, DLD-1, and HCT116 cells treated with NSC59984 (μmol/L) and 10 μmol/L of U0126 for 36 hours. The cleaved-PARP was examined by Western blot analysis. E, Cleaved-PARP in Hop92 cells (left) and SW480 cells (right) treated with NSC59984 (μmol/L) and U0126 (10 μmol/L), SCH772984 (1 μmol/L) or VX-11e (5 μmol/L) for 36 hours. The cleaved-PARP was examined by Western blot analysis. F, The colony formation in HT29 cells. G, The colony formation in DLD-1 cells. The cells (F and G) were treated with NSC59984 (μmol/L) and U0126 (10 μmol/L), SCH772984 (SCH,1 μmol/L) or VX-11e (5 μmol/L). The percentages of colonies (B, F, and G) were obtained with DMSO treatment. Data represent mean ± SD from triplicate treatments. *, P < 0.05. H, The cell-cycle profiles of SW480 and HT29 cells treated with NSC59984 (μmol/L) in combination with Z-VAD-FMK (20 μmol/L) for 72 hours. I, Cell viability assay. Cancer cells were treated with NSC59984 (μmol/L) in the presence or absence of ZVAD-FMK (30 μmol/L) for 72 hours. Cell viability was determined by Cell Titer-Glo luminescence. Cell viability data were normalized to those of DMSO as a control. Data represent mean ± SD. *, P < 0.05 compared with the NSC59984 treatment at each dosage.
Figure 6. NSC59984 in combination with BSO suppresses tumor growth. A, Cell viability of SW480 and normal WI-38 cells treated with NSC59984 (μmol/L) and BSO (μmol/L) for 72 hours. B, The cell-cycle profiles of SW480 cells treated with NSC59984 (μmol/L) in combination with NAC (10 mmol/L) or BSO (10 μmol/L) for 72 hours. C, The colony formation in HT29 cancer cells upon NSC59984 treatment in combination with BSO (5 μmol/L) as described in the Materials and Methods. D, Cleaved-PARP in SW480 cells treated with NSC59984 (μmol/L) and BSO (10 μmol/L) for 36 hours. E, Tumor volumes of HT29 xenografts in mice (n = 8). Tumor volumes were measured by a caliper every 3 days. Data are expressed as mean ± SD. *, P < 0.05. F, IHC staining for Ki67 in HT29 xenografted colorectal cancer tumors. G, The H-Score of Ki67 in HT29 xenograft tumors. H, IHC staining for cleaved-caspase 3 in HT29 xenograft tumors. I, The H-Score of cleaved caspase 3 in HT29 xenograft tumors. The H-Score (G and I) was calculated and analysis with VECTRA 2.0 as described in the Materials and Methods. J, Caspase 3/7 activity assays in SW480 cells. The cells were treated with NSC5994 (25 μmol/L) and BSO (10 μmol/L) for 30 hours for the caspase assay and 72 hours for the cell viability assay. The caspase 3/7 activity was normalized to the DMSO treatment as control. The cell viability was normalized to the cells treated with DMSO as control. Data are expressed as mean ± SD. *, P < 0.05. K, IHC staining for mutant p53 in HT29 xenografted tumors. The relative mutant p53 protein level was analyzed by image J and normalized to the nontreatment control. Data are expressed as mean ± SD. *, P < 0.05.
Figure 6.
NSC59984 in combination with BSO suppresses tumor growth. A, Cell viability of SW480 and normal WI-38 cells treated with NSC59984 (μmol/L) and BSO (μmol/L) for 72 hours. B, The cell-cycle profiles of SW480 cells treated with NSC59984 (μmol/L) in combination with NAC (10 mmol/L) or BSO (10 μmol/L) for 72 hours. C, The colony formation in HT29 cancer cells upon NSC59984 treatment in combination with BSO (5 μmol/L) as described in the Materials and Methods. D, Cleaved-PARP in SW480 cells treated with NSC59984 (μmol/L) and BSO (10 μmol/L) for 36 hours. E, Tumor volumes of HT29 xenografts in mice (n = 8). Tumor volumes were measured by a caliper every 3 days. Data are expressed as mean ± SD. *, P < 0.05. F, IHC staining for Ki67 in HT29 xenografted colorectal cancer tumors. G, The H-Score of Ki67 in HT29 xenograft tumors. H, IHC staining for cleaved-caspase 3 in HT29 xenograft tumors. I, The H-Score of cleaved caspase 3 in HT29 xenograft tumors. The H-Score (G and I) was calculated and analysis with VECTRA 2.0 as described in the Materials and Methods. J, Caspase 3/7 activity assays in SW480 cells. The cells were treated with NSC5994 (25 μmol/L) and BSO (10 μmol/L) for 30 hours for the caspase assay and 72 hours for the cell viability assay. The caspase 3/7 activity was normalized to the DMSO treatment as control. The cell viability was normalized to the cells treated with DMSO as control. Data are expressed as mean ± SD. *, P < 0.05. K, IHC staining for mutant p53 in HT29 xenografted tumors. The relative mutant p53 protein level was analyzed by image J and normalized to the nontreatment control. Data are expressed as mean ± SD. *, P < 0.05.

Similar articles

Cited by

References

    1. Muller PA, Vousden KH. p53 mutations in cancer. Nat Cell Biol 2013;15:2–8. - PubMed
    1. Olive KP, Tuveson DA, Ruhe ZC, Yin B, Willis NA, Bronson RT, et al. . Mutant p53 gain of function in two mouse models of Li-Fraumeni syndrome. Cell 2004;119:847–60. - PubMed
    1. Dittmer D, Pati S, Zambetti G, Chu S, Teresky AK, Moore M, et al. . Gain of function mutations in p53. Nat Genet 1993;4:42–6. - PubMed
    1. Terzian T, Suh YA, Iwakuma T, Post SM, Neumann M, Lang GA, et al. . The inherent instability of mutant p53 is alleviated by Mdm2 or p16INK4a loss. Genes Dev 2008;22:1337–44. - PMC - PubMed
    1. Li D, Marchenko ND, Moll UM. SAHA shows preferential cytotoxicity in mutant p53 cancer cells by destabilizing mutant p53 through inhibition of the HDAC6-Hsp90 chaperone axis. Cell Death Differ 2011;18:1904–13. - PMC - PubMed

Publication types

MeSH terms

Substances