Observational Study
. 2022 Jan;28(1):125-135.
doi: 10.1038/s41591-021-01581-6. Epub 2022 Jan 6.

Genomic predictors of response to PD-1 inhibition in children with germline DNA replication repair deficiency

Anirban Das #  1   2   3   4 Sumedha Sudhaman #  2   3 Daniel Morgenstern #  1   5 Ailish Coblentz  6 Jiil Chung  2   3   7 Simone C Stone  8 Noor Alsafwani  9   10 Zhihui Amy Liu  11   12 Ola Abu Al Karsaneh  9   13 Shirin Soleimani  8   14 Hagay Ladany  15 David Chen  2 Matthew Zatzman  2   9 Vanja Cabric  5 Liana Nobre  1   2   3 Vanessa Bianchi  2   3 Melissa Edwards  2   3 Lauren C Sambira Nahum  1 Ayse B Ercan  2   3   7 Arash Nabbi  8 Shlomi Constantini  16 Rina Dvir  17 Michal Yalon-Oren  18 Gadi Abebe Campino  18 Shani Caspi  18 Valerie Larouche  19 Alyssa Reddy  20 Michael Osborn  21 Gary Mason  22 Scott Lindhorst  23 Annika Bronsema  24 Vanan Magimairajan  25 Enrico Opocher  26 Rebecca Loret De Mola  27 Magnus Sabel  28   29 Charlotta Frojd  30 David Sumerauer  31 David Samuel  32 Kristina Cole  33 Stefano Chiaravalli  34 Maura Massimino  34 Patrick Tomboc  35 David S Ziegler  36   37 Ben George  38 An Van Damme  39 Nobuko Hijiya  40 David Gass  41 Rose B McGee  42 Oz Mordechai  43 Daniel C Bowers  44 Theodore W Laetsch  33 Alexander Lossos  45 Deborah T Blumenthal  46 Tomasz Sarosiek  47 Lee Yi Yen  48 Jeffrey Knipstein  49 Anne Bendel  50 Lindsey M Hoffman  51 Sandra Luna-Fineman  52 Stefanie Zimmermann  53 Isabelle Scheers  54 Kim E Nichols  42 Michal Zapotocky  31 Jordan R Hansford  55   56 John M Maris  33 Peter Dirks  3   57   58 Michael D Taylor  3   57   58 Abhaya V Kulkarni  57   59 Manohar Shroff  6 Derek S Tsang  60 Anita Villani  1   5 Wei Xu  11   12 Melyssa Aronson  61 Carol Durno  61 Adam Shlien  2   62 David Malkin  1   2   5   14 Gad Getz  63   64 Yosef E Maruvka  15 Pamela S Ohashi  8   65 Cynthia Hawkins  62   66   67 Trevor J Pugh  8   14   68 Eric Bouffet  1   5 Uri Tabori  69   70   71   72   73
Affiliations
Observational Study

Genomic predictors of response to PD-1 inhibition in children with germline DNA replication repair deficiency

Anirban Das et al. Nat Med. 2022 Jan.

Abstract

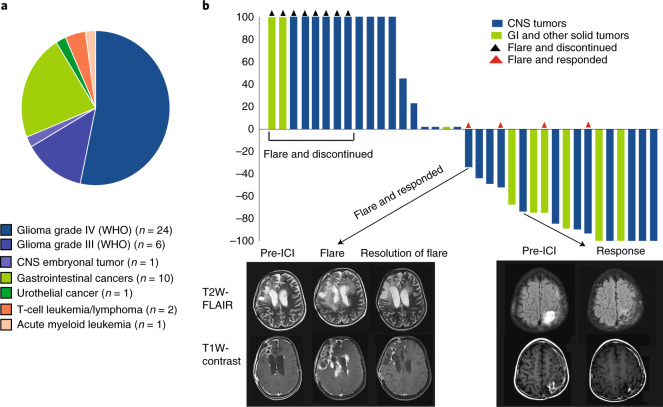
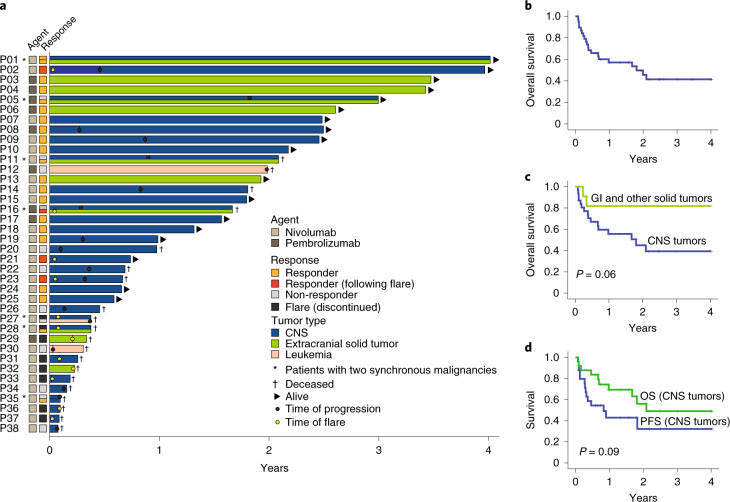
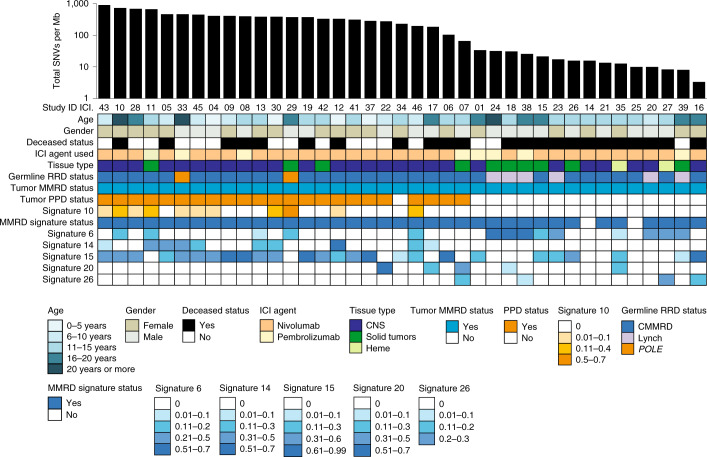
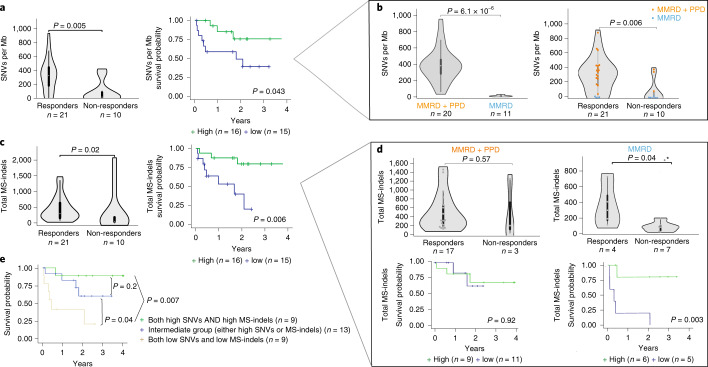
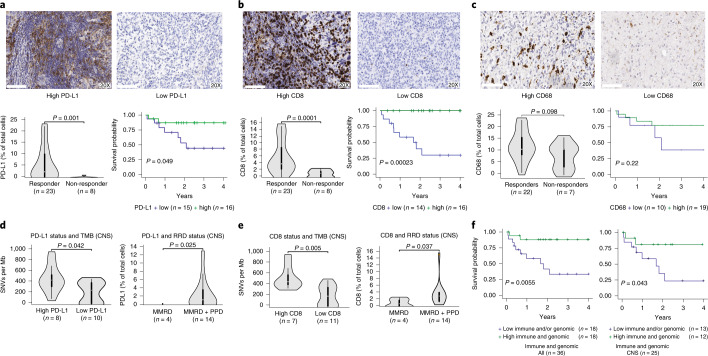
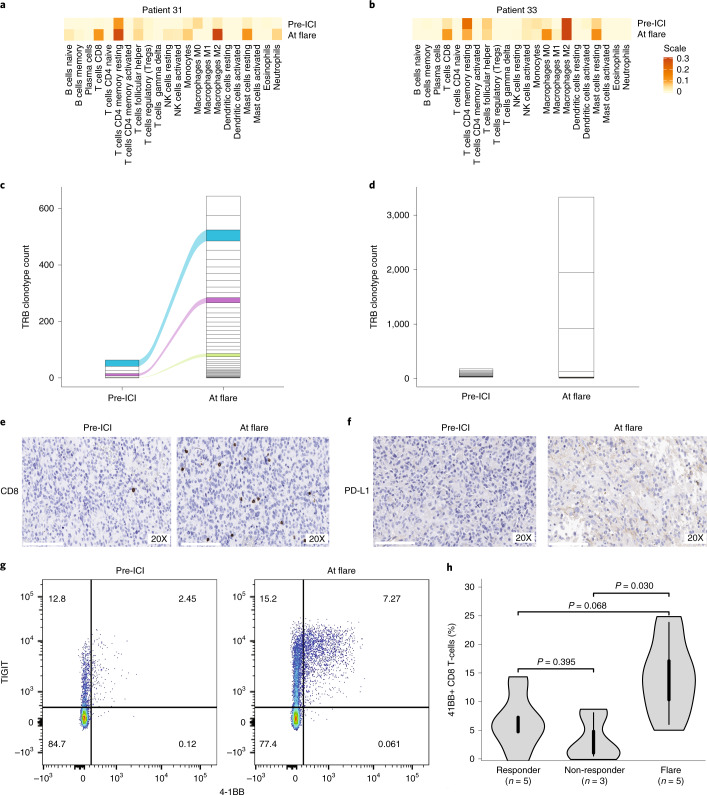
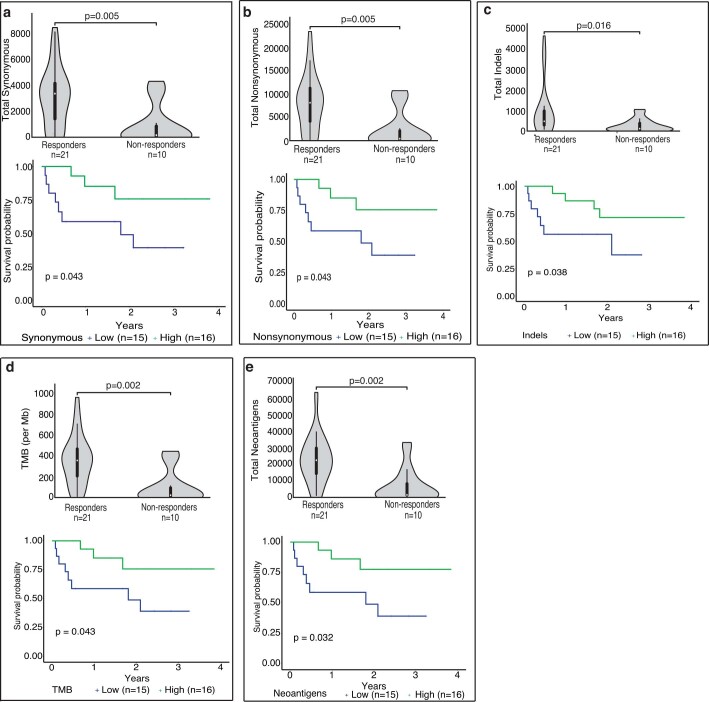
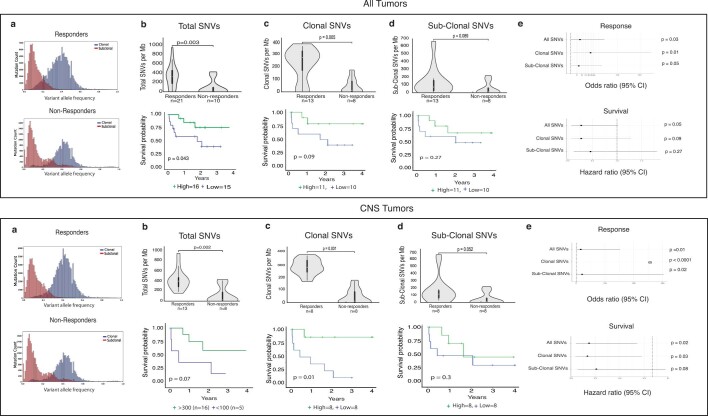
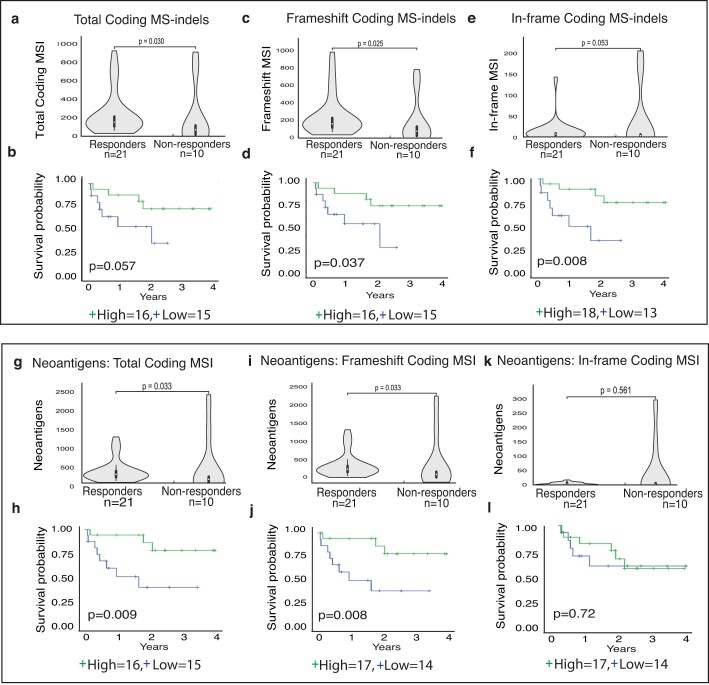
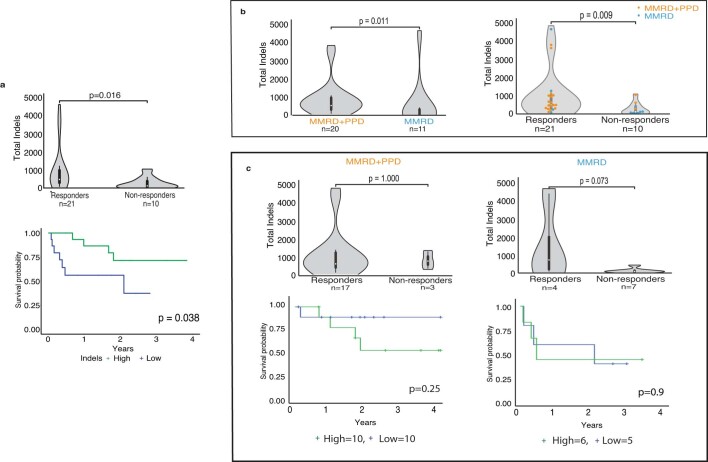
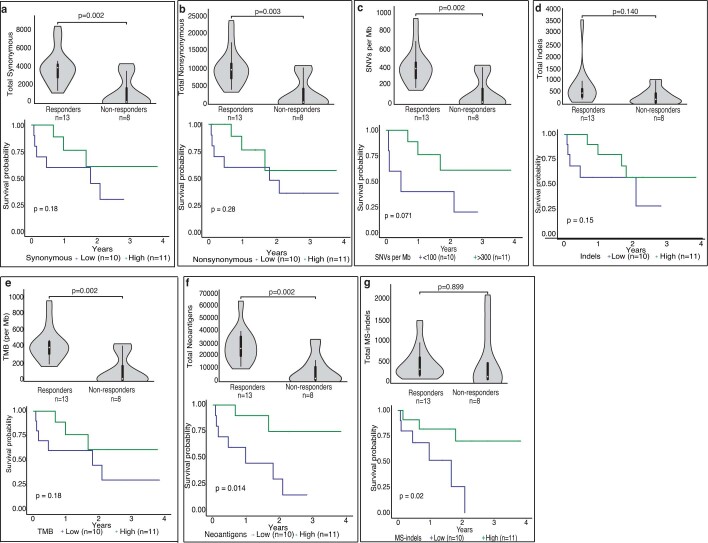
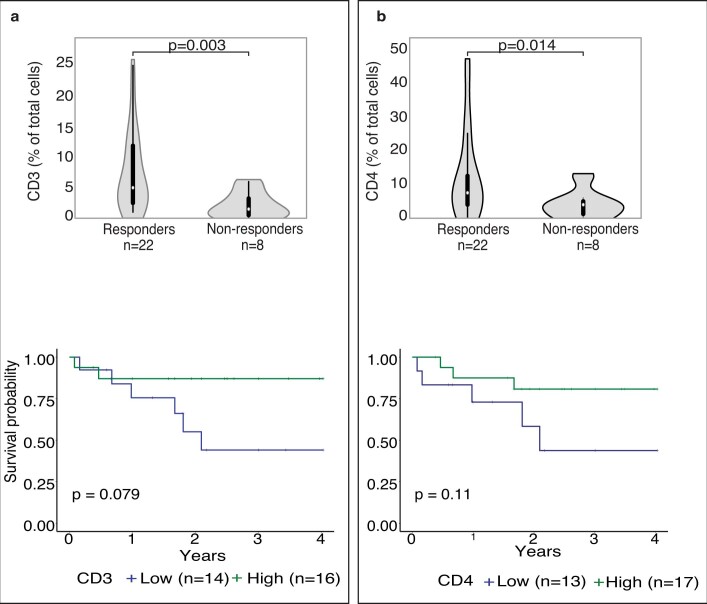
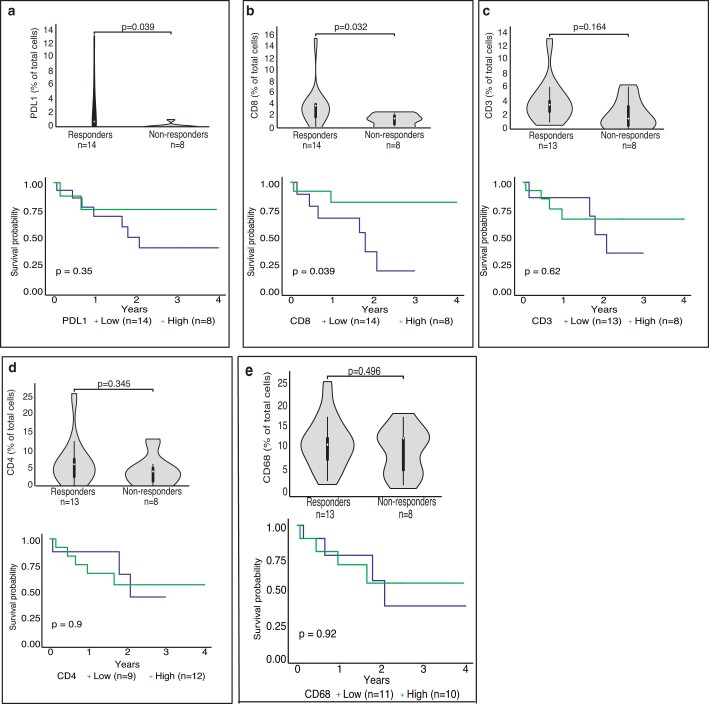
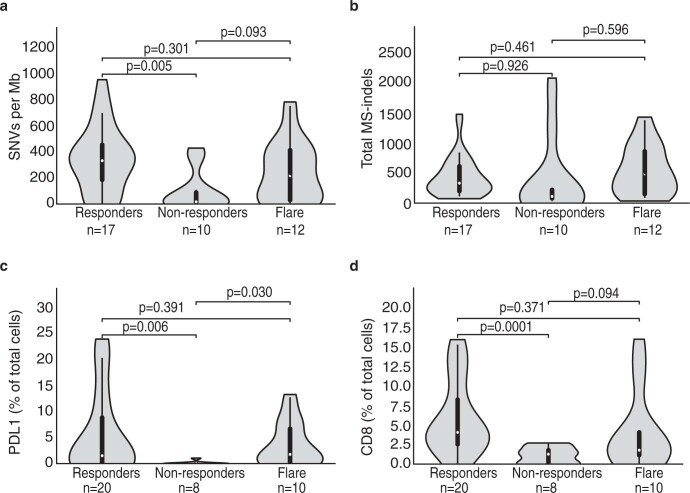
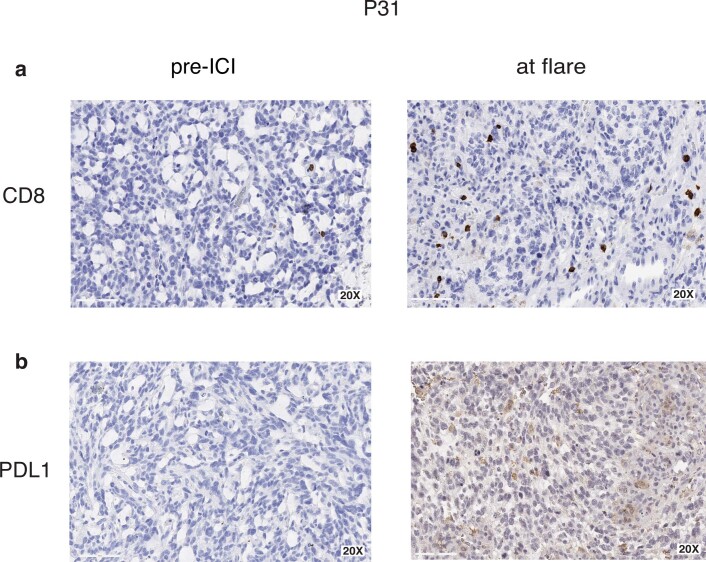
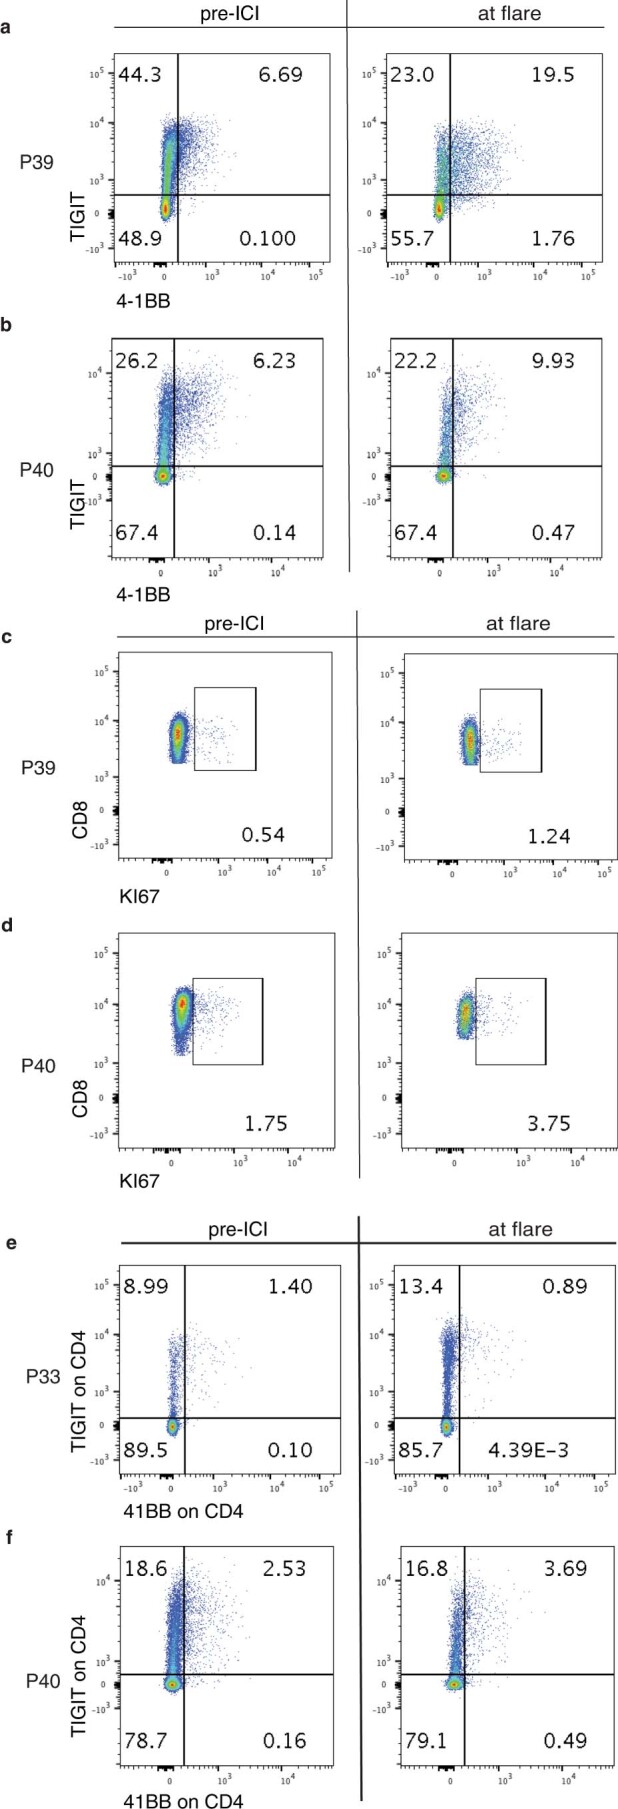
Cancers arising from germline DNA mismatch repair deficiency or polymerase proofreading deficiency (MMRD and PPD) in children harbour the highest mutational and microsatellite insertion-deletion (MS-indel) burden in humans. MMRD and PPD cancers are commonly lethal due to the inherent resistance to chemo-irradiation. Although immune checkpoint inhibitors (ICIs) have failed to benefit children in previous studies, we hypothesized that hypermutation caused by MMRD and PPD will improve outcomes following ICI treatment in these patients. Using an international consortium registry study, we report on the ICI treatment of 45 progressive or recurrent tumors from 38 patients. Durable objective responses were observed in most patients, culminating in a 3 year survival of 41.4%. High mutation burden predicted response for ultra-hypermutant cancers (>100 mutations per Mb) enriched for combined MMRD + PPD, while MS-indels predicted response in MMRD tumors with lower mutation burden (10-100 mutations per Mb). Furthermore, both mechanisms were associated with increased immune infiltration even in 'immunologically cold' tumors such as gliomas, contributing to the favorable response. Pseudo-progression (flare) was common and was associated with immune activation in the tumor microenvironment and systemically. Furthermore, patients with flare who continued ICI treatment achieved durable responses. This study demonstrates improved survival for patients with tumors not previously known to respond to ICI treatment, including central nervous system and synchronous cancers, and identifies the dual roles of mutation burden and MS-indels in predicting sustained response to immunotherapy.


Conflict of interest statement

The authors declare no competing interests.

Figures

Fig. 1
Fig. 1. Clinical response to ICI across cancer types in patients with germline DNA replication repair deficiency.
a, Distribution of tumor types across 38 patients who developed 45 tumors. b, Waterfall plot of all radiological responses in non-haematological malignancies. Values show the best fractional change in the 2 dimensions from baseline measurements as per RANO and RECIST criteria (Methods). Arrows point to representative T2-weighted FLAIR and T1-weighted contrast-enhanced MRI sequences in two patients showing flare and partial responses.
Fig. 2
Fig. 2. Patient outcome and survival by tumor type.
a, Swimmer plot by patient and tumor type. b, Kaplan-Meier (KM) estimates of overall survival for all patients (c) KM estimates of overall survival as per tumor type. Median survival for CNS tumors was 21.6 months. Median survival was not reached for non-CNS solid tumors. Two-sided log-rank test p-value is shown. d, KM estimates of progression free and overall survival for CNS tumors continuing ICI therapy. Note: prolonged median survival at 24 months (estimated 3 year OS = 49.1%) despite initial radiological progression at a median of 9.9 months (estimated 3 year PFS = 32%). Two-sided log-rank test p-value is shown.
Fig. 3
Fig. 3. Onco-plot summarising the genomic features from 39 available paired tumors and germline exomes, and their clinical correlates.
The tumors are arranged in descending order by total single nucleotide variants (SNVs) per megabase using semi-logarithmic scale. Tumor status for mismatch repair deficiency (MMRD) was determined based on MMR gene mutation status by whole exome sequencing (WES), or genetic testing of the patient germline. Tumor polymerase-proofreading deficiency (PPD) status was ascertained by presence of known POLE/POLD1 driver mutations and/or COSMIC signature status for PPD (COSMIC signature 10). The relative weight of each mutational signature contributing to each specific tumor sample analysis as reported using the DeconstructSigs package (Methods) has been color-coded, with the values provided below the onco-plot.
Fig. 4
Fig. 4. Genomic biomarkers, survival and response to PD1 blockade.
a, Response and overall survival (OS) by single nucleotide variants (SNVs) per Mb. For survival analysis, median SNV burden was used. b, SNVs as a function of MMRD (blue) and MMRD + PPD (orange) status (left), and response association with both SNV and replication-repair deficiency status. c, Response and overall survival (OS) by microsatellite indels (MS-indels). For survival analysis, median MS-indel values were used. d, Response and overall survival by total MS-indel count for MMRD + PPD and MMRD-only cancers separately. e, Kaplan-Meier (KM) estimates using combined SNVs/Mb and MS-indel in all replication repair-deficiency cancers. For all box-plots for responders and non-responders, data are represented as median + /- interquartile range. For statistical significance in comparing responders and non-responders, the Wilcoxon-Mann-Whitney test was used. Survival analysis was performed using the Kaplan-Meier method, and the log-rank test was used to compare groups. All p values are 2-sided. (MMRD: mismatch repair deficiency; PPD: polymerase proofreading deficiency; MS-indel: microsatellite insertion/ deletion).
Fig. 5
Fig. 5. Tumor immune microenvironment, survival and response to PD-1 blockade.
a, PD-L1 expression, response and survival in all replication repair-deficient cancers. Cut-off is ≥ 1% of cells (median; Methods). b, CD8 expression, response and survival for replication repair-deficient cancers. Cut-off is ≥ 3% of cells (median; Methods). c, CD68 expression, response and survival. Cut-off is ≥ 12.5% of cells (median; Methods). For (a), (b) and (c), the histology depicts glioblastoma at 20X magnification. d,e, Association of immune markers with SNV and replication repair-deficient status. f, Combined immune (PD-L1 and CD8 expression) and genomic (TMB and MS-indels) and overall survival in replication repair-deficient cancers. For all box-plots for responders and non-responders, data are represented as median + /- interquartile range. For statistical significance in comparing responders and non-responders, the Wilcoxon-Mann-Whitney test was used. Survival analysis was performed using the Kaplan-Meier method, and the log-rank test was used to compare groups. All p values are 2-sided.
Fig. 6
Fig. 6. Characterization of the tumor flare response.
a-d, Analysis of 2 patients who had tumor-debulking prior to therapy and at the time of flare. (a, b) Total immune cell content in pre-therapy and at flare. c,d, The corresponding CapTCR-sequencing and T cell receptor clonotype (TCR) analysis in these samples. Each box represents a specific TCR clonotype. Specific clonotypes which were shared between the baseline samples and at flare were tracked using the same colour between the baseline and flare samples. e,f, Immunohistochemistry for PD-L1 expression, and CD8-T cell infiltration in the pre-therapy sample and at flare, as shown in the representative 20X images from the tumor sample in patient-1 (P33). All immunohistochemistry was analysed by two independent pathologists. g, Representative flow cytometry plot showing activation of CD + T cell (TIGIT and 4-1BB) from the blood sample of a patient before treatment initiation and at flare. h, 4-1BB + CD8 + T cells in blood from responders without flare, non-responders and flare. For the box-plots, data are represented as median + /- interquartile range. For statistical significance in pairwise comparison of responders, non-responders and flare, the Wilcoxon-Mann-Whitney test was used. All p values are 2-sided.
Extended Data Fig. 1
Extended Data Fig. 1. Genomic biomarkers (SNVs), survival and response to PD-1 blockade.
Response and overall survival by (a) total synonymous variants, (b) non-synonymous variants, (c) total indels, (d) total mutations/Mb, and (e) neoantigens. For survival, median values were utilized to stratify into ‘high’ and ‘low’ groups. For all box-plots for responders and non-responders, data are represented as median ± interquartile range. For statistical significance in comparing responders and non-responders, the Wilcoxon-Mann-Whitney test was used. Survival analysis was performed using the Kaplan-Meier method, and the log-rank test was used to compare groups. All p values are 2-sided.
Extended Data Fig. 2
Extended Data Fig. 2. Clonal SNVs and outcomes.
(a) Distribution (using histogram) of clonal versus sub-clonal mutations between responders and non-responders for all (above) and CNS tumors (below). (b-d): Response and survival (stratification by >= median) for total, clonal and sub-clonal SNVs. For all box-plots for responders and non-responders, data are represented as median +/- interquartile range. (e) Odds ratio (95% confidence interval) for response (using logistic regression) and hazard ratios (95% confidence interval) for survival (using Cox regression) for all, clonal and sub-clonal SNVs for all tumors (above) and CNS tumors (below). All p-values are 2 sided.
Extended Data Fig. 3
Extended Data Fig. 3. Genomic biomarkers (MS-Indels), survival and response to PD-1 blockade.
(a-f) Total, frameshift and in-frame MS-Indels and outcome. (g-l) Neoantigens generated by total, frameshift and in-frame MS-Indels and outcome. For survival, median values were utilized to stratify into ‘high’ and ‘low’ groups. For all box-plots for responders and non-responders, data are represented as median +/- interquartile range. For statistical significance in comparing responders and non-responders, the Wilcoxon-Mann-Whitney test was used. Survival analysis was performed using the Kaplan-Meier method, and the log-rank test was used to compare groups. All p values are 2-sided.
Extended Data Fig. 4
Extended Data Fig. 4. Genomic biomarkers (Total Indels), survival and response to PD1 blockade.
(a) Response and overall survival (OS) by total indels. For survival analysis, median indel burden was used. (b) Total indels as a function of MMRD (blue; n=11) and MMRD+PPD (orange; n=20) status (left), and response association (responders; n=21; non-responders; n=10) with both indels and replication-repair deficient status. (c) Response and overall survival (OS) by total indels, stratified by tumors with MMRD+PPD (n=20) and MMRD only (n=11). For survival analysis, median indel burden was used. For all box-plots for responders and non-responders, data are represented as median +/- interquartile range. For statistical significance in comparing responders and non-responders, the Wilcoxon-Mann-Whitney test was used. Survival analysis was performed using the Kaplan-Meier method, and the log-rank test was used to compare groups. All p values are 2-sided.
Extended Data Fig. 5
Extended Data Fig. 5. CNS tumours: Genomic biomarkers, survival and response to PD-1 blockade.
Response and overall survival for CNS tumours by (a) synonymous variants, (b) non-synonymous variants, (c) SNVs/Mb, (d) total indels, (e) total mutations/ Mb, (f) neoantigens, and (g) MS-indels. For survival, median values were utilized to stratify into ‘high’ and ‘low’ groups. For all box-plots for responders and non-responders, data are represented as median +/- interquartile range. For statistical significance in comparing responders and non-responders, the Wilcoxon-Mann-Whitney test was used. Survival analysis was performed using the Kaplan-Meier method, and the log-rank test was used to compare groups. All p values are 2-sided.
Extended Data Fig. 6
Extended Data Fig. 6. Tumour immune microenvironment, survival and response to PD-1 blockade.
Response and overall survival by (a) CD3, and (b) CD4-positive cells in the pre-ICI tumour specimens. For survival, median values were utilized to stratify into ‘high’ and ‘low’ groups. For all box-plots for responders and non-responders, data are represented as median +/- interquartile range. For statistical significance in comparing responders and non-responders, the Wilcoxon-Mann-Whitney test was used. Survival analysis was performed using the Kaplan-Meier method, and the log-rank test was used to compare groups. All p values are 2-sided.
Extended Data Fig. 7
Extended Data Fig. 7. CNS tumours: Immune microenvironment, survival and response to PD-1 blockade.
Response and overall survival in CNS tumours by (a) PD-L1, (b) CD8, (c) CD3, (d) CD4, and (e) CD68 expression. For survival, median values were utilized to stratify into ‘high’ and ‘low’ groups. For all box-plots for responders and non-responders, data are represented as median +/- interquartile range. For statistical significance in comparing responders and non-responders, the Wilcoxon-Mann-Whitney test was used. Survival analysis was performed using the Kaplan-Meier method, and the log-rank test was used to compare groups. All p values are 2-sided.
Extended Data Fig. 8
Extended Data Fig. 8. Genomic and immune markers of response in tumours exhibiting flare.
Responders without flare, non-responders and stratified by (a) SNVs/mb, (b) MS-indels, (c) PD-L1 and (d) CD8 expression. For all box-plots, data are represented as median +/- interquartile range. For statistical significance in comparing responders and non-responders, the Wilcoxon-Mann-Whitney test was used. All p values are 2-sided.
Extended Data Fig. 9
Extended Data Fig. 9. Immunohistochemistry at baseline and flare.
Representative images (20X) from patient P31 demonstrating (a) CD8 and (b) PD-L1 expression in pre-ICI and flare samples. All immunohistochemistry was analysed by two independent pathologists.
Extended Data Fig. 10
Extended Data Fig. 10. Immune activation in patients experiencing tumour flare.
Flow cytometry dot-plots from two patients comparing pre-ICI and flare samples, showing (a, b) TIGIT and 4-1BB expressing CD8+ T-cells, (c, d) Ki67 expressing CD8+ T-cells, and (e, f) TIGIT and 4-1BB expressing CD4+ T-cells.

References

    1. Cortez D. Replication-coupled DNA repair. Mol. Cell. 2019;74:866–876. - PMC - PubMed
    1. Campbell BB, et al. Comprehensive analysis of hypermutation in human cancer. Cell. 2017;171:1042–1056. - PMC - PubMed
    1. Chung J, et al. DNA polymerase and mismatch repair exert distinct microsatellite instability signatures in normal and malignant human cells. Cancer Discov. 2021;11:1176–1191. - PMC - PubMed
    1. Mur P, et al. Role of POLE and POLD1 in familial cancer. Genet. Med. 2020;22:2089–2100. - PMC - PubMed
    1. Seppälä TT, et al. European guidelines from the EHTG and ESCP for Lynch syndrome: an updated third edition of the Mallorca guidelines based on gene and gender. Br. J. Surg. 2021;108:484–498. - PMC - PubMed

Publication types

Grants and funding