Meta-Analysis
. 2022 Jan;54(1):4-17.
doi: 10.1038/s41588-021-00976-y. Epub 2022 Jan 6.

Genetic analysis of the human microglial transcriptome across brain regions, aging and disease pathologies

Affiliations
Meta-Analysis

Genetic analysis of the human microglial transcriptome across brain regions, aging and disease pathologies

Katia de Paiva Lopes et al. Nat Genet. 2022 Jan.

Abstract

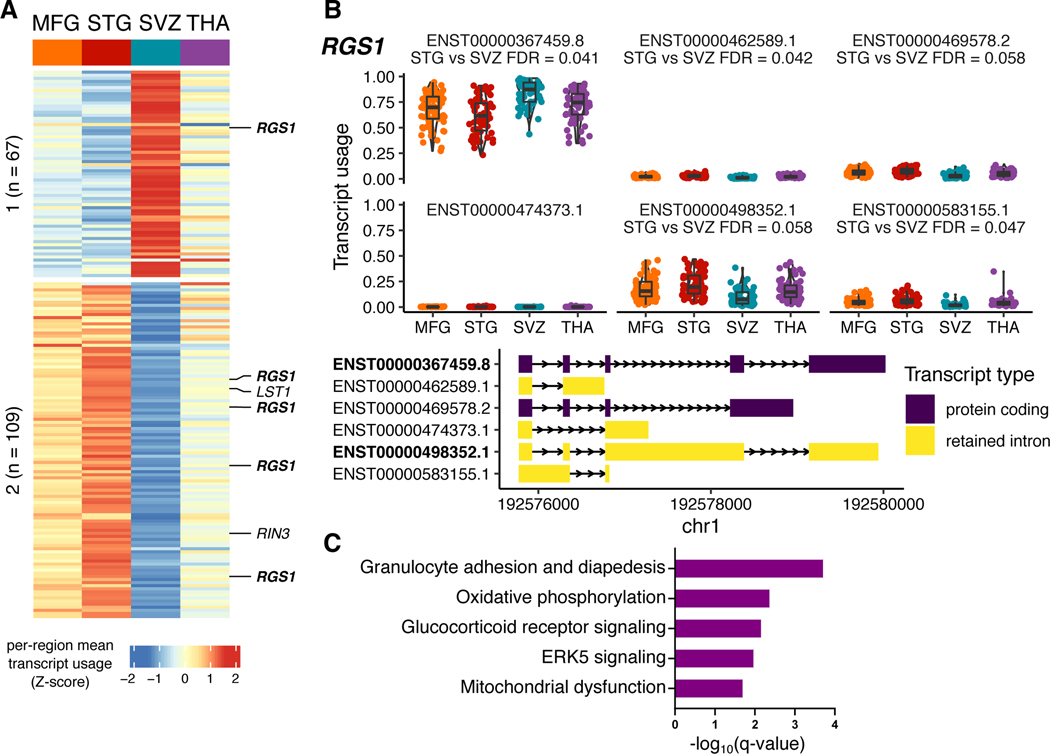
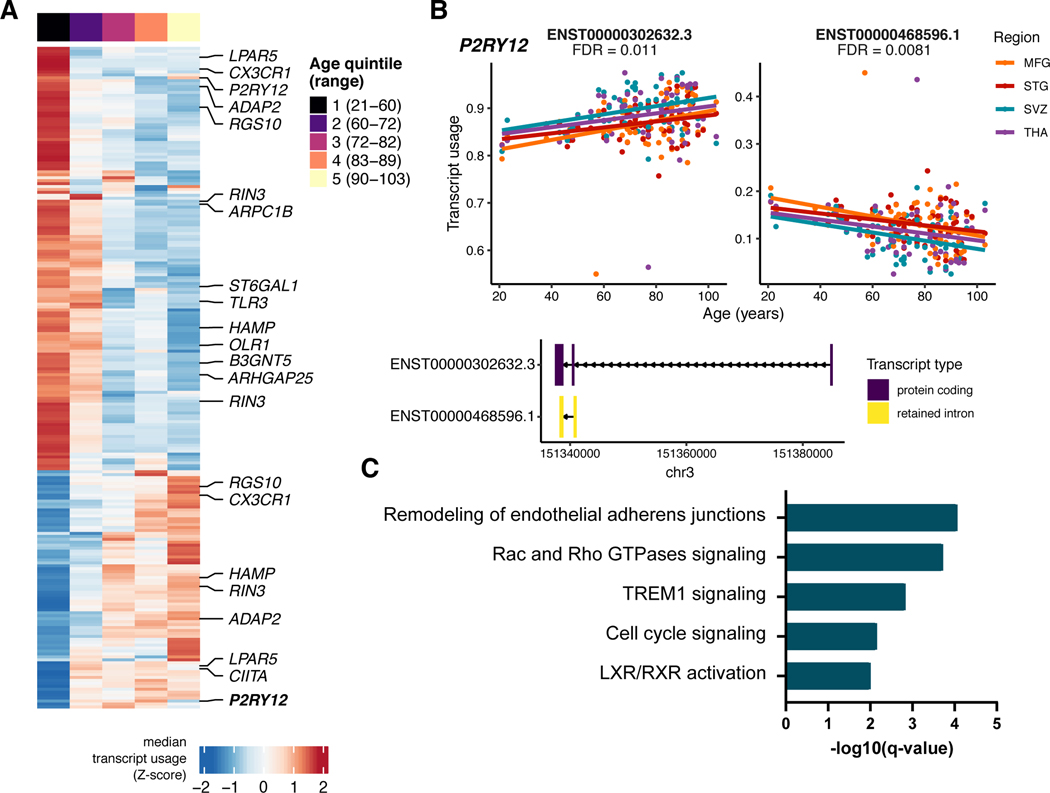
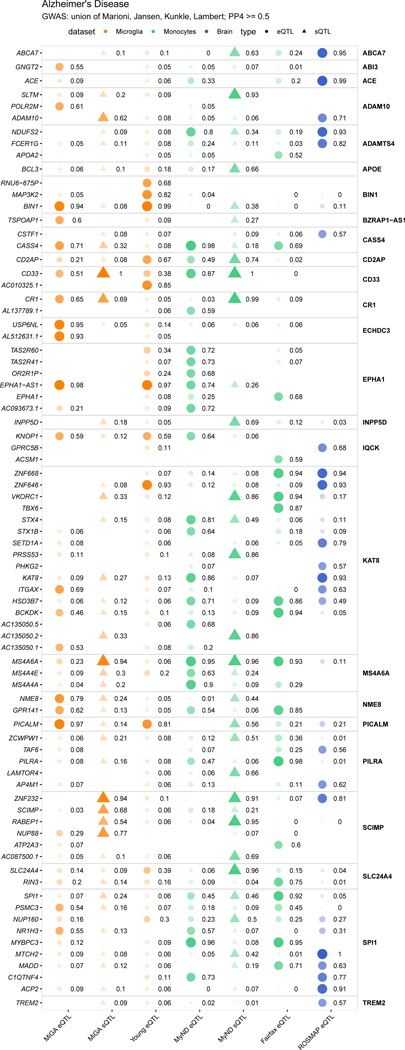
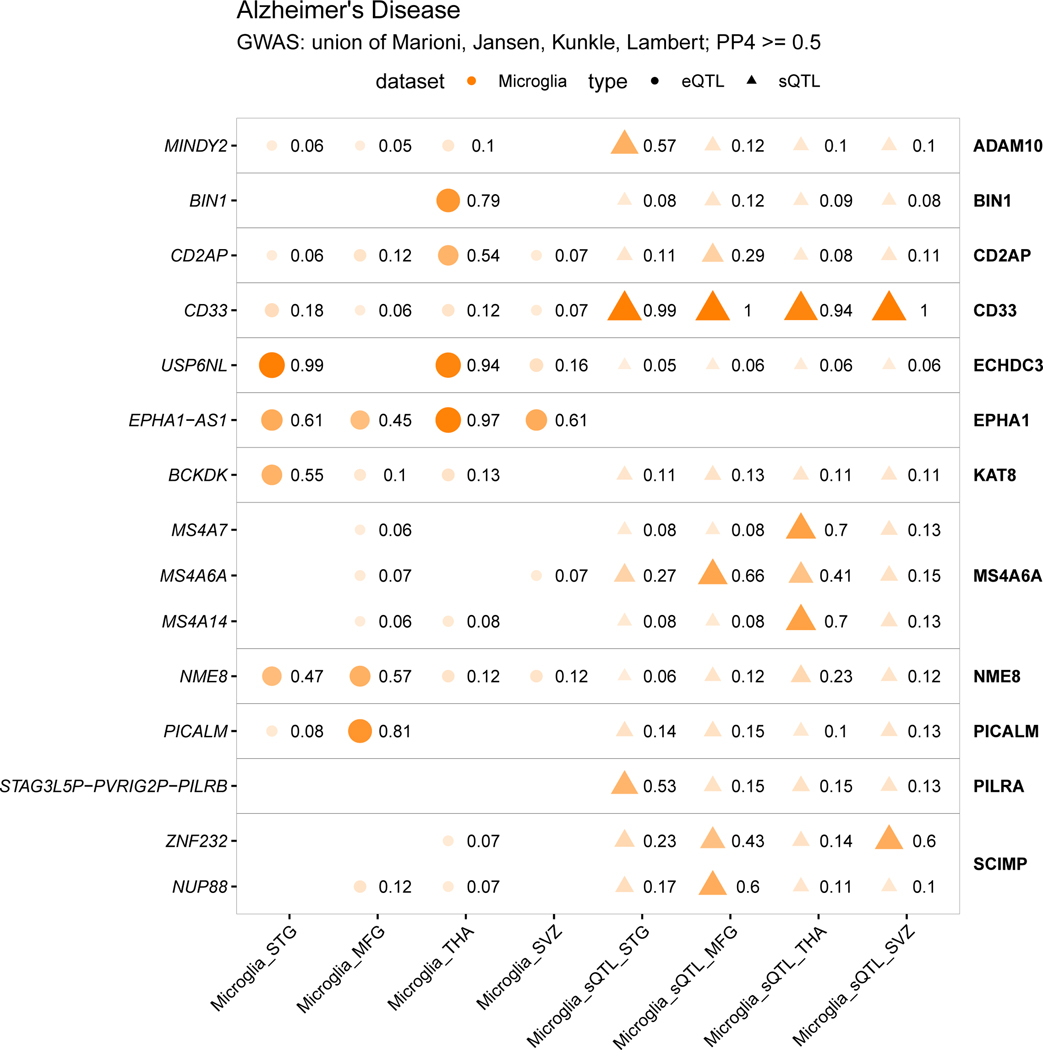
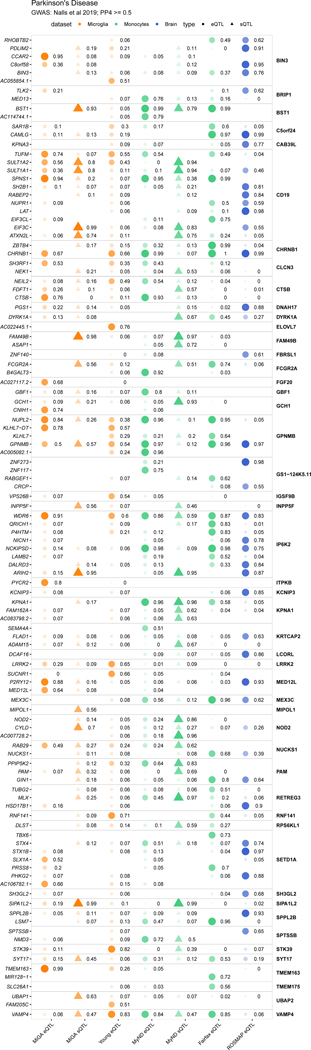
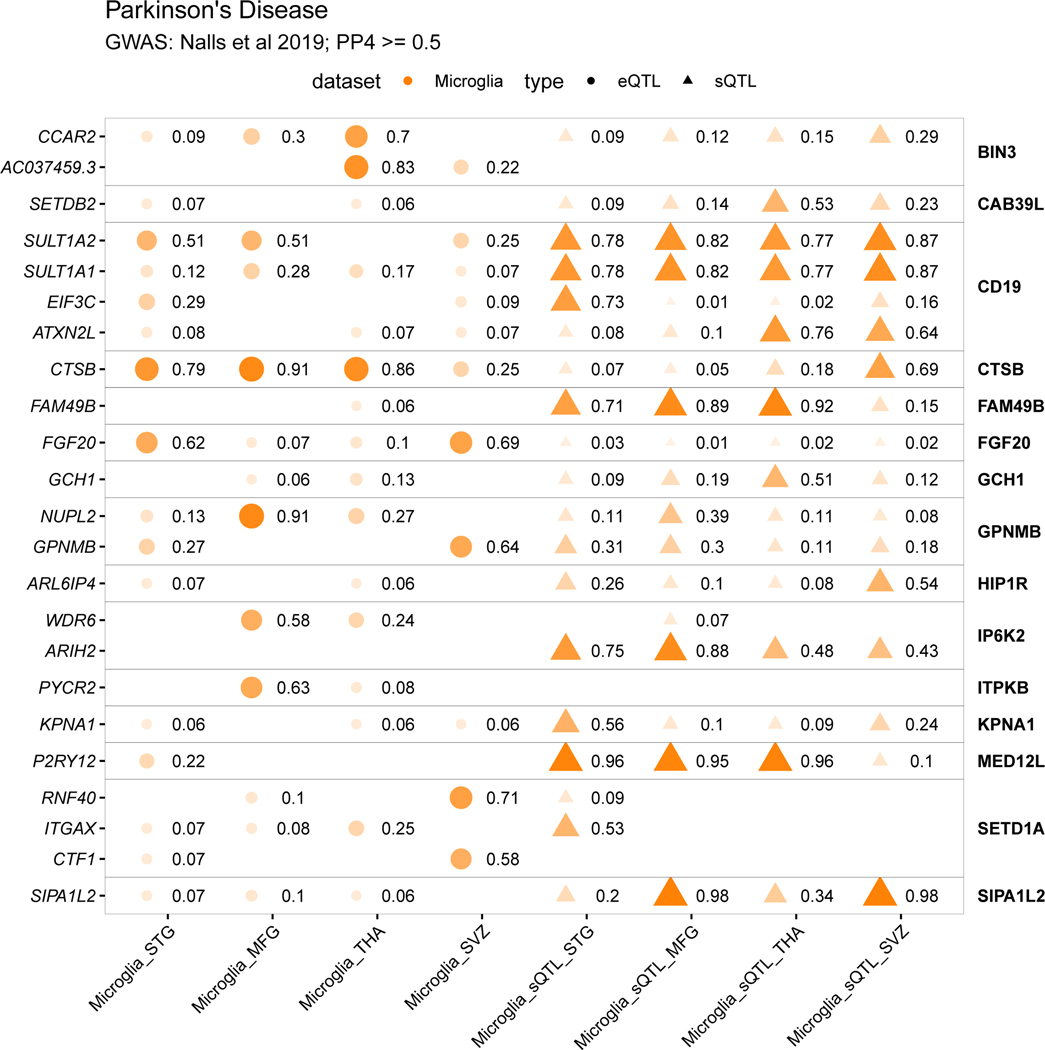
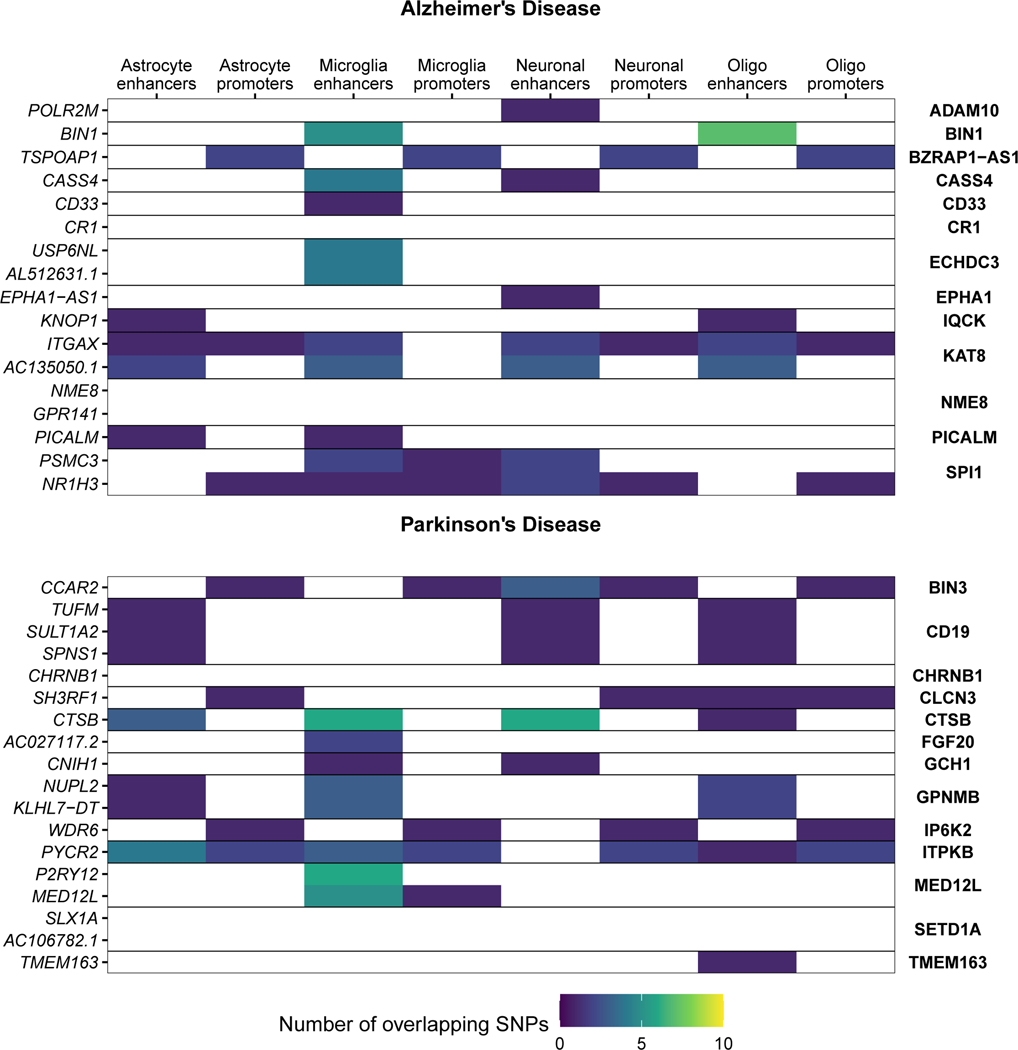
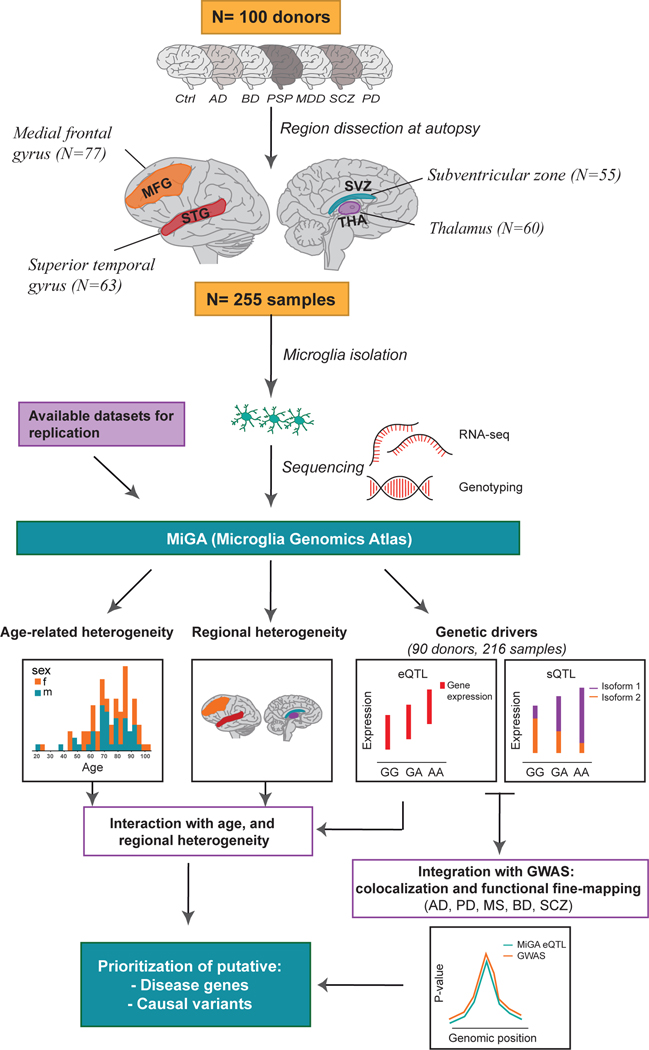
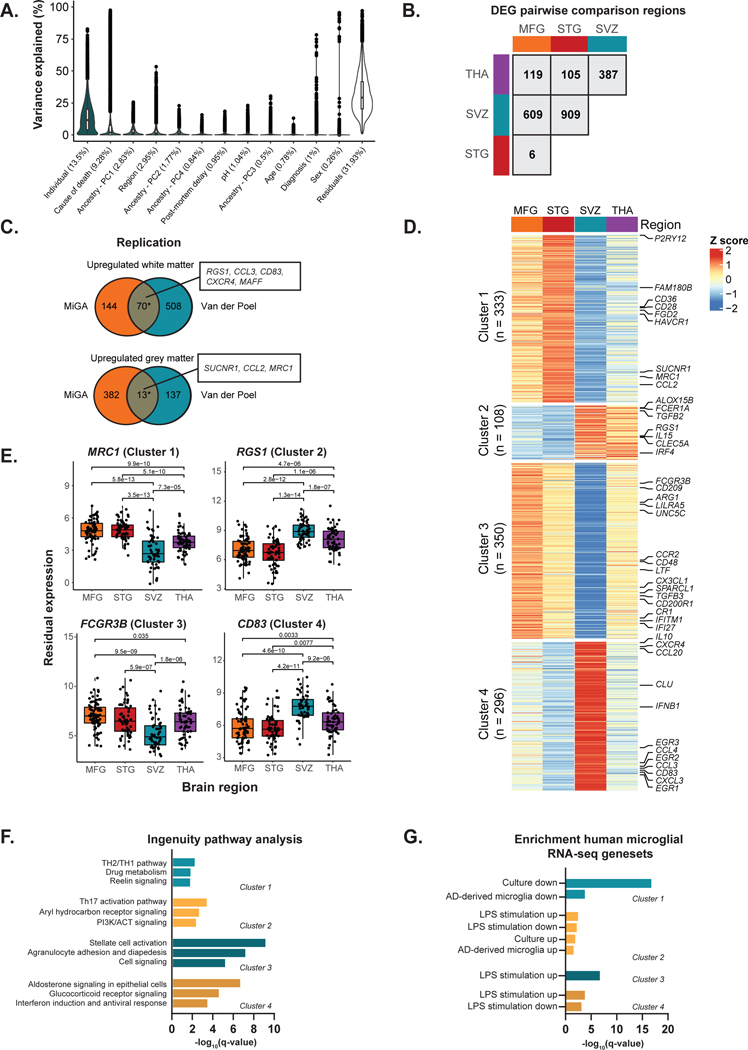
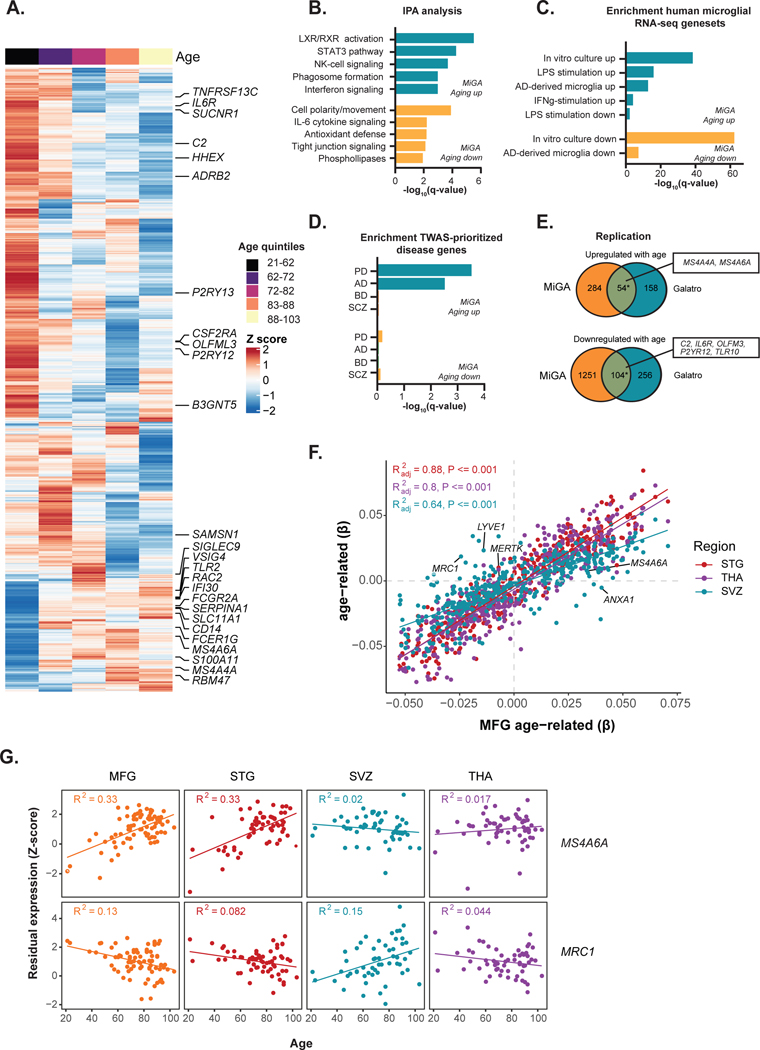
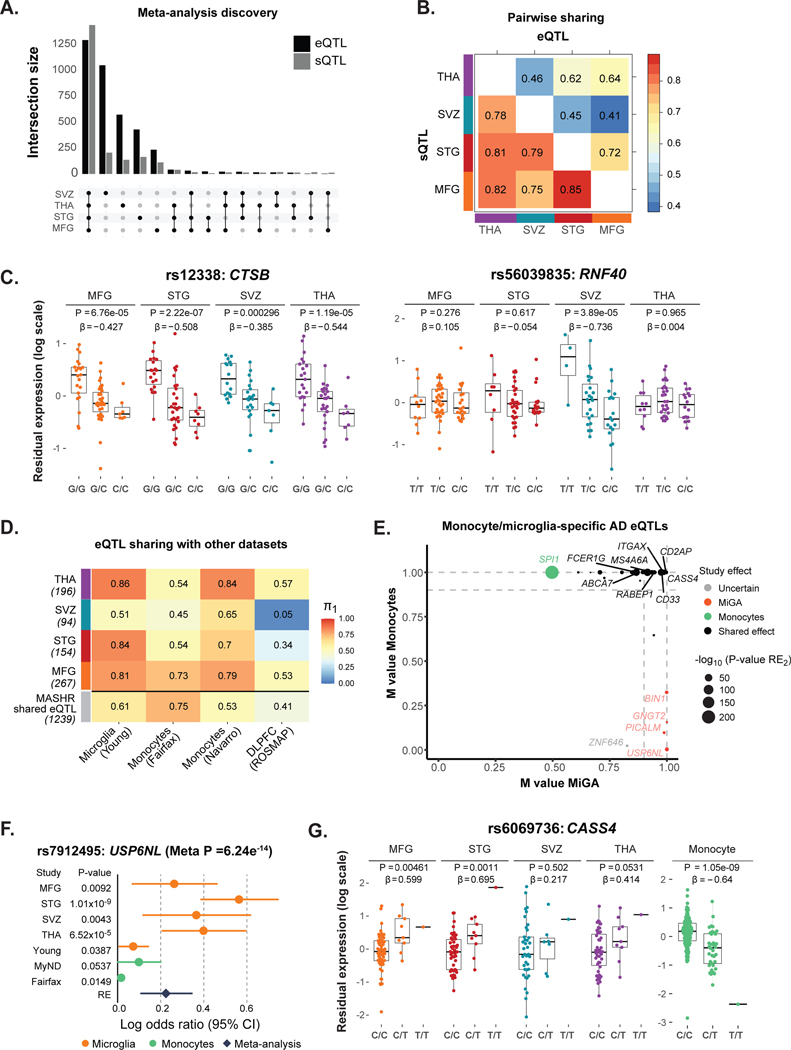
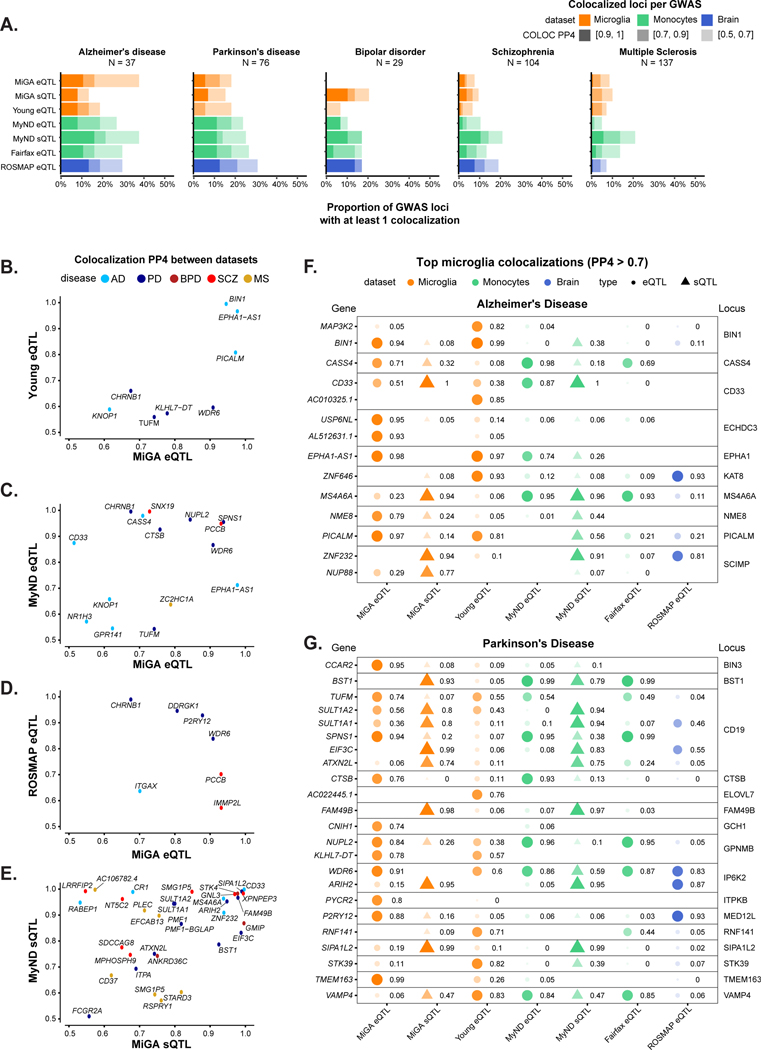
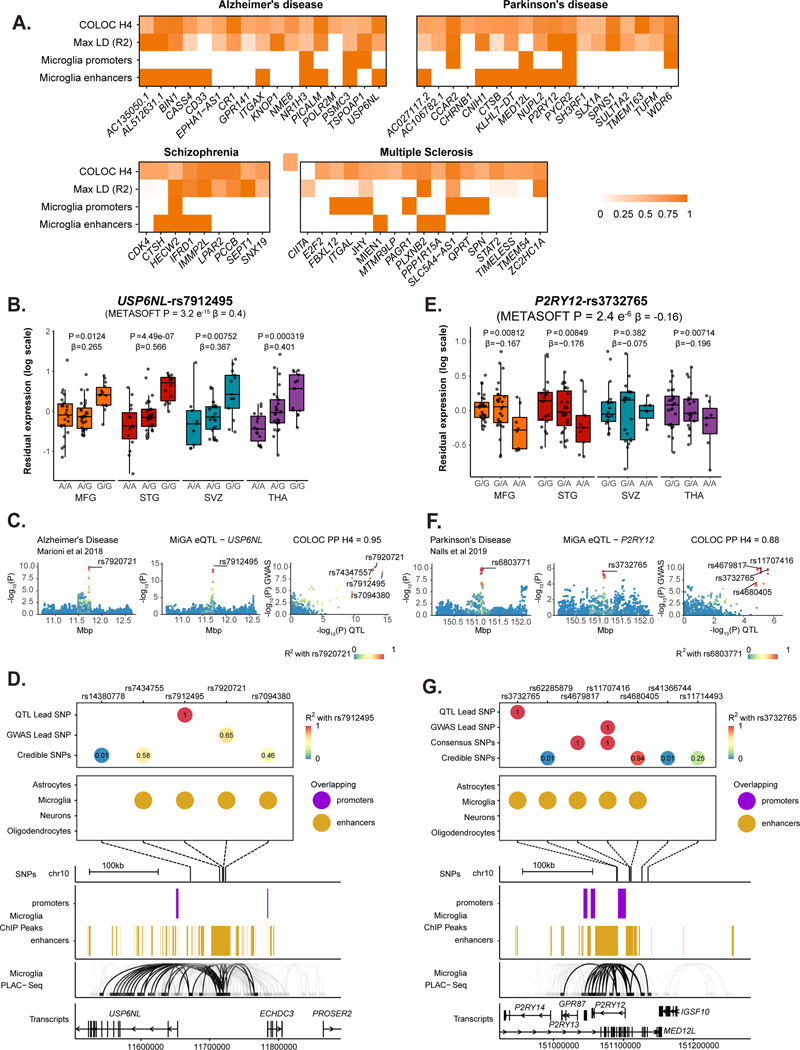
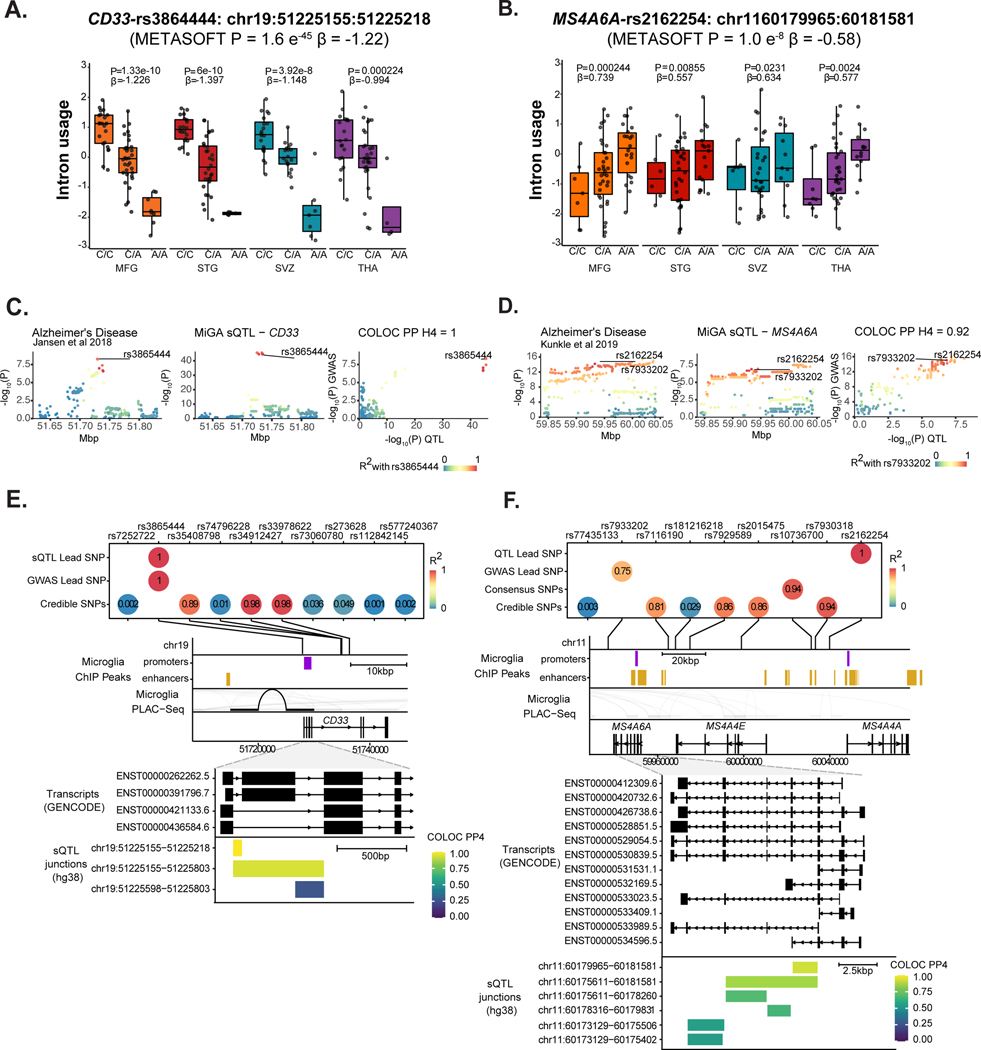
Microglia have emerged as important players in brain aging and pathology. To understand how genetic risk for neurological and psychiatric disorders is related to microglial function, large transcriptome studies are essential. Here we describe the transcriptome analysis of 255 primary human microglial samples isolated at autopsy from multiple brain regions of 100 individuals. We performed systematic analyses to investigate various aspects of microglial heterogeneities, including brain region and aging. We mapped expression and splicing quantitative trait loci and showed that many neurological disease susceptibility loci are mediated through gene expression or splicing in microglia. Fine-mapping of these loci nominated candidate causal variants that are within microglia-specific enhancers, finding associations with microglial expression of USP6NL for Alzheimer's disease and P2RY12 for Parkinson's disease. We have built the most comprehensive catalog to date of genetic effects on the microglial transcriptome and propose candidate functional variants in neurological and psychiatric disorders.


Figures

Extended Data Fig. 1
Extended Data Fig. 1. Regional heterogeneity analysis for transcript usage
A) Heatmap of relative transcript usage between regions using all 176 transcripts from pairwise comparisons of differential transcript usage (DTU; empirical FDR < 0.1), plotted as row-scaled z-scores of mean transcript usage per region; red and blue indicates high and low relative transcript usage, respectively. Transcripts form 2 k-means clusters, n refers to the number of transcripts in each cluster. Core microglia genes from Patir et al. highlighted. B) Transcript usage plots for the gene RGS1. The two most abundant transcripts are bolded. The DTU signal is driven by a reduction of the intron retention transcript ENST00000498352.1 and a corresponding increase in the protein-coding transcript ENST00000367459.8 in the SVZ compared to the other regions. Boxplots show the median with the first and third quartiles of the distribution. C) Functional Enrichment Analysis of all 132 genes with regional DTU using Ingenuity Pathway Analysis (IPA). Significantly enriched terms shown (q-value < 0.05).
Extended Data Fig. 2
Extended Data Fig. 2. Age-related analysis for transcript usage
A) Heatmap of the 225 transcripts associated with age (empirical FDR < 0.1). Each row plotted as Z-score of median expression averaged first by donor (across multiple regions) and then by age quintiles with 20 donors each. Transcripts are ordered by Ward’s hierarchical clustering. Core microglia genes from Patir et al. highlighted. B) Example transcript usage for P2RY12. The association is caused by an increase in the long protein-coding transcript ENST00000302632.3 and a corresponding decrease in the short intron retention transcript ENST00000468596.1 during aging. C) Functional Enrichment Analysis of all 150 genes with DTU in aging using Ingenuity Pathway Analysis (IPA). Only significantly enriched terms shown (q-value < 0.05).
Extended Data Fig. 3
Extended Data Fig. 3. Full colocalization results in Alzheimer’s Disease
Colocalization PP4 displayed for each GWAS locus (right text) and gene (left text) for each QTL dataset. An empty value means no QTL was present for testing for that gene in that dataset.
Extended Data Fig. 4
Extended Data Fig. 4. Colocalization results for each regional microglia dataset in Alzheimer’s Disease
Colocalization PP4 displayed for each GWAS locus (right text) and gene (left text) for each QTL dataset. An empty value means no QTL was present for testing for that gene in that dataset.
Extended Data Fig. 5
Extended Data Fig. 5. Full colocalization results in Parkinson’s Disease
Colocalization PP4 displayed for each GWAS locus (right text) and gene (left text) for each QTL dataset. An empty value means no QTL was present for testing for that gene in that dataset.
Extended Data Fig. 6
Extended Data Fig. 6. Colocalization results for each regional microglia dataset in Parkinson’s Disease
Colocalization PP4 displayed for each GWAS locus (right text) and gene (left text) for each QTL dataset. An empty value means no QTL was present for testing for that gene in that dataset.
Extended Data Fig. 7
Extended Data Fig. 7. Overlap of colocalized microglia eQTLs with epigenomic features in AD and PD.
Cell-type specific promoters and enhancers were overlapped with SNP sets for each colocalizing microglia QTL - GWAS locus. SNP sets consisted of the lead GWAS SNP, the lead QTL SNP and any fine-mapped consensus or credible SNPs. Results are summarized here by the number of SNPs in the set that overlap with a particular feature type.
Figure 1.
Figure 1.. Overview of the Microglia Genomic Atlas (MiGA).
Primary human CD11b+ microglia were isolated at autopsy from 100 donors with neurological and psychiatric diseases, as well as unaffected subjects (controls) generating a total of 255 samples from four brain regions: medial frontal gyrus (MFG), superior temporal gyrus (STG), subventricular zone (SVZ) and thalamus (THA). Samples were isolated from two brain banks: the Netherlands Brain Bank (NBB) and the Neuropathology Brain Bank and Research CoRE at Mount Sinai Hospital. RNA was isolated and sequenced. Genome-wide genotyping was performed using DNA isolated from all donors. The following analysis were performed with the MiGA dataset: (i) age-related analysis; (ii) regional heterogeneity analysis by looking at the differentially expressed genes among the brain regions; (iii) expression quantitative trait loci (eQTL) analysis; (iv) splicing quantitative trait loci (sQTL) analysis; (v) colocalization and functional fine-mapping integrating the eQTL results with the most recent GWAS from five diseases: Alzheimer’s disease (AD), Parkinson’s disease (PD), Multiple sclerosis (MS), Bipolar disorder (BD) and Schizophrenia (SCZ).
Figure 2.
Figure 2.. Regional heterogeneity analysis.
A) Distributions of variance explained per gene for the non-technical factors. Mean variance explained by each factor is in brackets. Data are presented as a percentage (%) of total variance explained. Box plots show median, box spans first to third quartiles, and whiskers extends 1.5 times the interquartile range (IQR) from the box. B) Number of differentially expressed genes by pairwise region comparison (FDR < 0.05 and | logFC | >1). C) Replication analysis between the medial frontal gyrus (MFG) vs subventricular zone (SVZ) differentially expressed genes and a published dataset of microglia samples isolated from white (n = 5) and grey matter (n = 11) of controls. Asterisk indicates significant enrichment by a one-sided Fisher’s exact test (upregulated OR = 18.4; P < 1 × 10⁻¹⁶, downregulated OR = 4.83; P = 9 × 10⁻⁶). Selected genes in overlap are highlighted. D) Heatmap of K-means clustering of 1,087 differentially expressed genes from the pairwise comparison. K-means was performed on z-scored values of the median per region of voom transformed expression. The colors represent row scaled z-score levels: red and blue indicate high and low relative region expression, respectively. n refers to the number of differentially expressed genes in each cluster. E) Examples of differentially expressed genes in each region. P-values (two-sided) are FDR-adjusted from the linear mixed model of the differential expression analysis. Box plots show median, box spans first to third quartiles, and whiskers extend 1.5 times the interquartile range (IQR) from the box. F) Functional Enrichment Analysis of each K-means cluster using Ingenuity Pathway Analysis (IPA). Only significantly enriched terms shown (q-value < 0.05). G) Enrichment analysis with curated human microglia RNA-seq gene sets, using one-sided Fisher’s exact test at Bonferroni adjusted P < 0.05.
Figure 3.
Figure 3.. Age-related analysis.
A) Heatmap of 1,693 genes associated with age (FDR < 0.05). Each gene (row) plotted as a Z-score of median expression averaged first by donor (across multiple regions) and then by age quintiles with 20 donors each. Genes are ordered by Ward’s hierarchical clustering. B) Ingenuity Pathway Analysis of age-related genes. Only significantly enriched terms shown (q-value < 0.05). C) Enrichment analysis with curated human microglia RNA-seq gene sets, using a one sided Fisher’s exact test at Bonferroni-adjusted P < 0.05. D) Genes associated with age show overrepresentation for TWAS prioritized genes for Alzheimer’s (AD) or Parkinson’s disease (PD), but not for genes in Schizophrenia or Bipolar disorder. P-value based on one-sided Fisher’s exact test. E) Replication analysis with an independent dataset of human microglia samples, 49 healthy controls with ages between 31 and 102 years old. Asterisk indicates significant enrichment by a one-sided Fisher’s exact test (upregulated genes OR = 23.4; P < 1 × 10⁻¹⁶, downregulated genes OR = 5.97; P < 1 × 10⁻¹⁶). Selected overlapping genes are highlighted. F) Scatter plot showing the size correlation of the age-related genes by brain region. Only the genes that are significant (FDR < 0.05) in at least one region are shown. The x-axis shows the beta values in the MFG and the y-axis shows the betas in other brain regions (STG, SVZ and THA). G) Scatter plot showing the Z-score transformed residual expression for selected genes (MRC1 and MS4A6A) by age and brain region.
Figure 4.
Figure 4.. Genetic regulatory effects in microglia.
A) Number of genes with a cis-eQTL (eGenes) and cis-sQTL (sGenes) at local false sign rate (lfsr) < 0.05, from a meta-analysis across all four brain regions using mashR. B) Pairwise shared eQTLs (upper triangle) and sQTLs (lower triangle) across the four brain regions. Numbers represent the proportion of significant effects (lfsr < 0.05) that are shared in magnitude (i.e. effect estimates that are in the same direction and within a factor of 2 in size). C) Examples of shared (CTSB gene, rs12338) and region-specific effect (RNF40, rs56039835). eQTL boxplots with residual gene expression (PEER adjusted) per individual stratified by genotype. The eQTL nominal P-value and effect size from the linear regression model are listed on top. Box plots show median, box spans first to third quartiles, and whiskers extend 1.5 times the interquartile range (IQR) from the box. D) Replication of MiGA eQTLs effects (region-by-region analysis q-value < 0.10 and mashR results at lfsr < 0.05) compared to four external eQTL datasets: microglia, monocytes,, and dorsolateral prefrontal cortex (ROSMAP). The proportion of replication is measured by Storey’s π1. E) Meta-analysis results for colocalized eGenes in AD loci. The m-values represent the posterior probability that the effect exists in each study (i.e. MiGA for microglia, or Navarro and Fairfax for monocytes), as reported by METASOFT. Small m-values (< 0.1) suggest that the gene and the SNP do not have an association in the study; large m-values (> 0.9) suggest that the gene and the SNP have a strong association. Otherwise, the prediction is uncertain. The x-axis shows the maximum m-values among the four brain regions in MiGA, and the y-axis shows maximum m-values for monocytes,. Colors indicate cell type: orange for the genes with strong effect in MiGA only, green for monocytes and black for the shared effects between microglia and monocytes. F) Example of microglia-specific eQTL found only in MiGA. The gene USP6NL (rs7912495) has significant effect in all four brain regions from MiGA but does not have an effect in other datasets (MiGA dataset includes MFG, STG, SVZ and THA: N = 216 samples; Young: N = 93 samples; MyND: N = 180 samples; Fairfax: N = 300 samples). Error bars indicate the log odds ratio (95% confidence interval). G) Example of discordant eQTL effects for CASS4 (rs6069736) between microglia and monocytes. The nominal P-values are from the linear regression model in the region-by-region eQTL analysis. Box plots show median, box spans first to third quartiles, and whiskers extend 1.5 times the interquartile range (IQR) from the box.
Figure 5.
Figure 5.. Summary of colocalization analyses.
A) The proportion of GWAS loci that have at least one colocalized gene in each QTL dataset. Fill opacity used to represent numbers of loci at different stringency levels for colocalization posterior probability H4 (PP4): 0.5–0.7 (lightest), 0.7–0.9 (medium); 0.9–1 (darkest). Bars are colored by the cell or tissue type of the QTLs: microglia (orange), monocytes (green), or dorsolateral prefrontal cortex (DLPFC; blue). N refers to the number of GWAS loci. B-E) Pairwise comparison of the coloc PP4 for genes between QTL datasets. Points are colored by disease. B), C), D) compare the MiGA microglia eQTLs to the Young et al. microglia eQTLs, MyND monocyte eQTLs, and ROSMAP DLPFC eQTLs, respectively. E) Comparison of the MiGA splicing QTLs and the MyND monocyte splicing QTLs. F) All genes in the AD GWAS that have a PP4 > 0.7 in one of the three microglia QTL datasets. Shape opacity and size scaled to the magnitude of PP4. Circles represent colocalizations with expression QTLs and triangles represent those with splicing QTLs. G) The same for Parkinson’s Disease.
Figure 6.
Figure 6.. Enhancer-promoter interaction data links GWAS variants to microglia-specific regulatory regions.
A) Overview of fine-mapping and epigenomic overlap analyses for all eQTL genes with PP4 > 0.5 in each disease. Max linkage disequilibrium (LD) refers to the highest LD coefficient between the lead eQTL SNP and any of the lead GWAS SNP or fine-mapped SNPs. Microglia enhancers and promoters refer to whether any of the SNPs for that eGene overlap a microglia enhancer or promoter, as defined by Nott et al. B-D) Analysis of the USP6NL gene. B) USP6NL expression is associated with the rs7912495 genotype in all four microglia regions. The nominal P-value from the linear regression model in the region-by-region eQTL analysis is indicated on top of the boxplots. The beta and P-value from the meta-analysis are also indicated on top of the Figure. Box plots show median, box spans first to third quartiles, and whiskers extend 1.5 times the interquartile range (IQR) from the box. C) The meta-analyzed USP6NL eQTL colocalizes with the ECHDC3 Alzheimer’s disease risk locus (PP4 = 0.95). D) Fine-mapping of the ECHDC3 locus and combining with the lead QTL and lead GWAS SNPs. SNPs are colored by the LD with the lead QTL SNP. 4 out of 5 of the SNPs overlap a microglia-specific enhancer element as defined by ChIP-seq. Genomic plots (hg19) of the fine-mapped SNPs and the epigenomic data from microglia ChIP-seq, and PLAC-seq junctions. Junctions that overlap the fine-mapped SNPs are emphasized. E-G) Analysis of the P2RY12 gene. E) P2RY12 expression is associated with the rs3732765 genotype. The nominal P-value from the linear regression model in the region-by-region eQTL analysis is indicated on top of the boxplots. The beta and P-value from the meta-analysis are also indicated on top of the Figure. Box plots show median, box spans first to third quartiles, and whiskers extends 1.5 times the interquartile range (IQR) from the box. F) The P2RY12 eQTL colocalizes with the MED12L Parkinson’s Disease locus. G) Fine-mapping of the MED12L locus discovers SNPs that in strong LD with the eQTL lead SNP that overlap microglia-specific enhancer regions. Genomic plots show that the microglia enhancer connects with the P2RY12 promoter.
Figure 7.
Figure 7.. Splicing QTLs in CD33 and MS4A6A colocalize with Alzheimer’s Disease risk loci.
A-E) Analysis of CD33. A) Intron usage in CD33 is associated with rs3865444 in all four microglia regions. The nominal P-value from the linear regression model in the region-by-region sQTL analysis is indicated on top of the boxplots. The beta and P-value from the meta-analysis are also indicated on top of the Figure. Box plots show median, box spans first to third quartiles, and whiskers extends 1.5 times the interquartile range (IQR) from the box. B) The meta-analyzed sQTL colocalizes with an AD risk locus, PP4 =1. C) The lead GWAS SNP and lead sQTL SNP are the same causal variant rs3865444. Three other SNPs prioritized by fine-mapping are in high LD. D) The lead SNP falls near the CD33 promoter overlapping a PLAC-seq junction. E) Overlaying CD33 protein-coding transcripts (GENCODE v30) with the sQTL introns, colored by strength of colocalization probability (PP4). Introns with highest PP4 all connect CD33 exon 2 splicing to the AD risk locus. F-J) Analysis of MS4A6A. F) MS4A6A intron usage is associated with rs2162254 across all four regions. Box plots show median, box spans first to third quartiles, and whiskers extend 1.5 times the interquartile range (IQR) from the box. G) The sQTL locus strongly colocalizes with an AD risk locus. H) The lead QTL and lead GWAS SNPs are in moderate LD (R2 = 0.75), as are multiple SNPs prioritized by fine-mapping. I) The MS4A locus contains multiple genes and putative enhancer regions. No SNP overlaps PLAC-seq peaks. J) All protein-coding MS4A6A transcripts (GENCODE v30) with sQTL introns overlaid, coloured by COLOC PP4. A complex cluster of introns all colocalize with the AD risk locus.

Comment in

References

    1. Priller J. & Prinz M. Targeting microglia in brain disorders. Science 365, 32–33 (2019). - PubMed
    1. Ransohoff RM & El Khoury J. Microglia in health and disease. Cold Spring Harb. Perspect. Biol 8, a020560 (2015). - PMC - PubMed
    1. Prinz M, Jung S. & Priller J. Microglia biology: One century of evolving concepts. Cell 179, 292–311 (2019). - PubMed
    1. Tan Y-L, Yuan Y. & Tian L. Microglial regional heterogeneity and its role in the brain. Mol. Psychiatry 25, 351–367 (2020). - PMC - PubMed
    1. van der Poel M. et al. Transcriptional profiling of human microglia reveals grey-white matter heterogeneity and multiple sclerosis-associated changes. Nat. Commun 10, 1139 (2019). - PMC - PubMed

Publication types