. 2022 Jan;6(1):76-93.
doi: 10.1038/s41551-021-00819-5. Epub 2022 Jan 6.

Amelioration of Alzheimer's disease pathology by mitophagy inducers identified via machine learning and a cross-species workflow

Affiliations

Amelioration of Alzheimer's disease pathology by mitophagy inducers identified via machine learning and a cross-species workflow

Chenglong Xie et al. Nat Biomed Eng. 2022 Jan.

Abstract

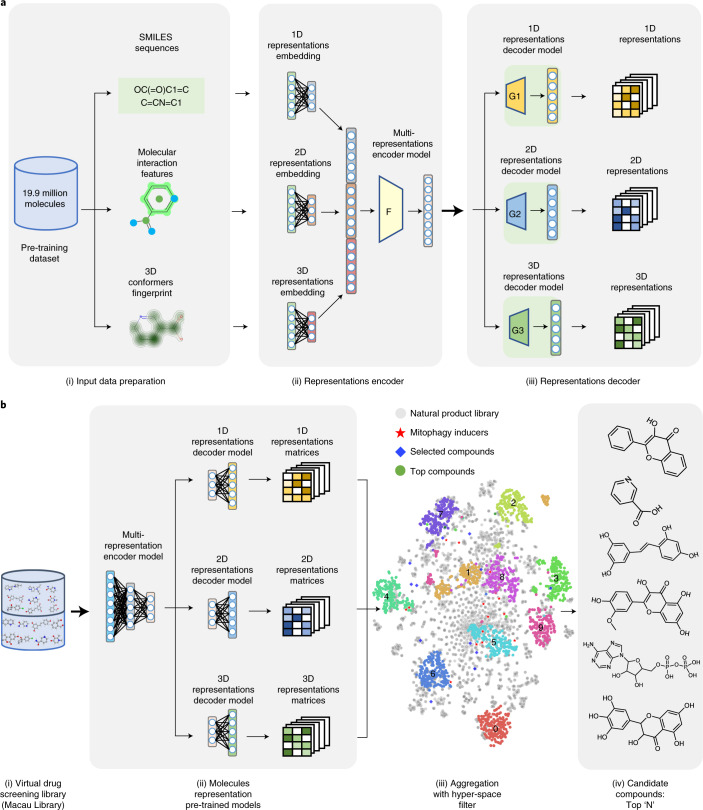
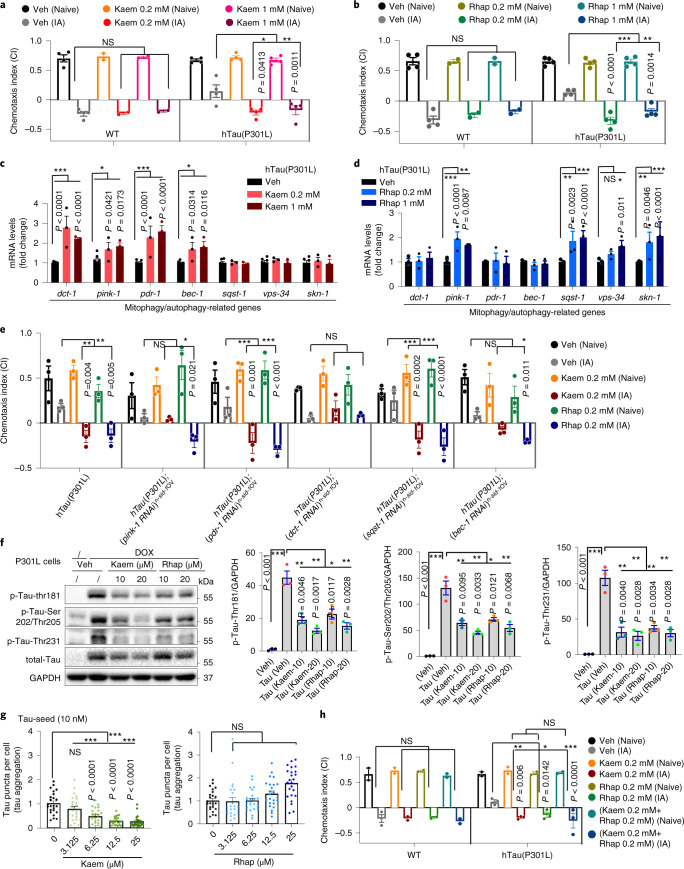
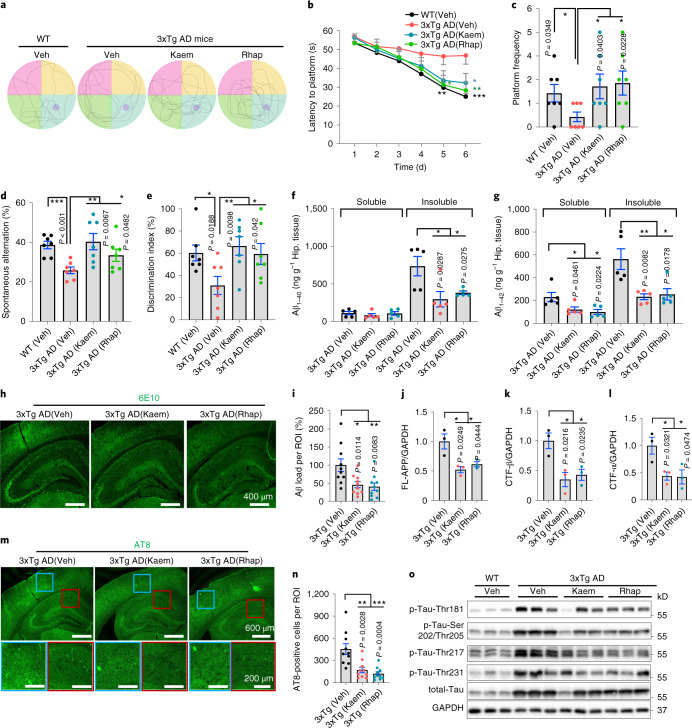
A reduced removal of dysfunctional mitochondria is common to aging and age-related neurodegenerative pathologies such as Alzheimer's disease (AD). Strategies for treating such impaired mitophagy would benefit from the identification of mitophagy modulators. Here we report the combined use of unsupervised machine learning (involving vector representations of molecular structures, pharmacophore fingerprinting and conformer fingerprinting) and a cross-species approach for the screening and experimental validation of new mitophagy-inducing compounds. From a library of naturally occurring compounds, the workflow allowed us to identify 18 small molecules, and among them two potent mitophagy inducers (Kaempferol and Rhapontigenin). In nematode and rodent models of AD, we show that both mitophagy inducers increased the survival and functionality of glutamatergic and cholinergic neurons, abrogated amyloid-β and tau pathologies, and improved the animals' memory. Our findings suggest the existence of a conserved mechanism of memory loss across the AD models, this mechanism being mediated by defective mitophagy. The computational-experimental screening and validation workflow might help uncover potent mitophagy modulators that stimulate neuronal health and brain homeostasis.


Conflict of interest statement

E.F.F. and H.N. have a cooperative research and development agreement with ChromaDex. E.F.F., G.Y. and H.N. are consultants to Aladdin Healthcare Technologies. E.F.F. is a consultant to the Vancouver Dementia Prevention Centre and Intellectual Labs. During the execution of this work, S.Z. was a paid part-time employee of MindRank Al Ltd. Z.N., Y.J. and X.X. are full-time employees of MindRank Al Ltd. E.F.F., J.-H.L, Z.N., C.X. and X.-X.Z. have filed a patent on the use of mitophagy inducers to treat Alzheimer’s disease. The other authors declare no competing interests.

Figures

Fig. 1
Fig. 1. The use of combined machine learning strategies to identify novel mitophagy inducers.
a, The workflow for model pre-training: (i) Molecules within the pre-training dataset were transferred into SMILES sequences, molecular interaction features and 3D conformers fingerprint in the data preparation stage; (ii) Three encoders (for 1D, 2D and 3D representations) were then designed to embed the input data, and these representational embeddings were aggregated into the encoder model of the multi-representation; (iii) The multi-representational embeddings were then passed to the representation decoder to pre-train the multi-representation molecule model. ‘F’ and ‘G’ stand for ‘Functional encoder’ and ‘Generator’ respectively. b, The workflow for the virtual screening process: (i) The virtual screening library contained 3,274 molecules from a traditional Chinese medicine dataset, named Macau Library; (ii) The 1D, 2D and 3D molecular representations for each compound were generated on the basis of the pre-trained molecule representation models; (iii) The representations were then aggregated and clustered, and a hyper-space filter was applied to the representations to filter out outliers; (iv) The similarity scores for each compound were calculated to generate the top N candidate compounds. Source data
Fig. 2
Fig. 2. Evaluation of mitophagy stimulation capacity of the AI top-scored molecules in vitro (mt-Keima) and in animals (mt-Rosella).
a, A schematic representation showing mechanisms of how the mt-Keima protein can be used as a mitophagy reporter. For confocal microscopy, dual-excitation ratio imaging was carried out with two sequential excitation lasers (458 nm and 561 nm). Representative confocal images are of HeLa cells expressing mt-Keima treated with vehicle (DMSO) or Carbonyl cyanide m-chlorophenyl hydrazone (CCCP) (15 μM, 3 h). b,c, Effects of Quercetin, Tacrolimus, Ascomycin, Isorhamnetin, Pinostilbene, Kaem and Rhap (from 0.1 μM to 100 μM, 24 h) on mitophagy induction. d, Effects of in vitro-positive mitophagy inducers on the induction of neuronal mitophagy in worms expressing mt-Rosella reporter. Rotenone (5 μM and 10 μM, 4 h) was used as positive control. Data were pooled from 2 biological replicates (total n = 20–35 nematodes per group), with results shown as mean ± s.e.m. Two-way ANOVA followed by Tukey’s multiple comparisons test; NS, no significance; *P < 0.05, **P < 0.01, ***P < 0.001. A set of representative images of cellular positive (related to Fig. 2b,c) and negative mitophagy inducers (with quantifications) is included in Supplementary Fig. 2. Mechanisms of the mt-Rosella sensor as well as a set of representative images (related to Fig. 2d) are shown in Supplementary Fig. 4. Source data
Fig. 3
Fig. 3. Kaem and Rhap induce mitophagy in cells, C. elegans neurons and mouse brain.
a, Effects of Kaem and Rhap on the protein levels of mitofusin2 (MFN2), YFP-Parkin and Tim23 in HeLa cells stably overexpressing YFP-Parkin. bd, Semi-quantification of a (n = 3 biological replicates). e, Effects of Kaem and Rhap on the protein levels of MFN2, YFP-Parkin and Tim23 in HeLa cells stably overexpressing Mito-GFP and mCherry-Parkin. fh, Semi-quantification of e (n = 3 biological replicates). For a and e, CCCP was used as positive control. i, Images showing co-localization of mitochondria (Mito-GFP) and lysosomes (LAMP1 antibody) under Kaem and Rhap (20 uM, 24 h) administration in GFP-mito-mCherry-Parkin HeLa cells. White arrows indicate mitophagy events. j, Quantification of i with data from 3 biological repeats with around 5–7 images per biological repeat. k, Transgenic nematodes were treated with Kaem and Rhap (both with 0.01, 0.05, 0.1 and 0.2 mM), with mitophagy events calculated by the co-localization between the autophagic marker DsRed::LGG-1 and the mitophagy receptor DCT-1::GFP in neurons. n = 18–20 neurons from 2 biological repeats. While the left panel shows one representative set of images, quantitative data are shown in the right panel. l, Effects of Kaem and Rhap on the induction of neuronal mitophagy in worms with mt-Rosella reporter. Data were pooled from 2 biological replicates (total n = 20–35 nematodes per group), with the results shown as mean ± s.e.m. m,n, Data of quantified electron microscopic images showing effects of Kaem and Rhap on mitochondrial morphology and mitophagy-like events in mt-Keima HeLa cells (m) (20 µM for 24 h) and mouse hippocampal brain tissues (n) (100 mg kg−1 d−1 via oral gavage from 12 months for 7 consecutive days; n = 3 mice per group, with 4 random hippocampal neuronal images per mouse). Representative images are shown in Extended Data Fig. 1a,b. All quantitative data are shown as mean ± s.e.m. One-way ANOVA followed by Šidák’s multiple comparisons test; **P 0.01, ***P 0.001. Original unprocessed western blot gel data are in Source Data Fig. 4. Source data
Fig. 4
Fig. 4. Mitophagy stimulation restores memory deficit and abrogates pathologies in AD-like Aβ worms, and regulates cellular Aβ production in mouse neuroblastoma cells.
a, Effects of Kaem and Rhap on associative memory in adult day 1 WT and hAβ1–42 (CL2355) worms. Data were pooled from at least 4 biological replicates. b, Effects of Kaem and Rhap on designated gene expression in day 1 adult worms. Data are from 1 representative biological repeat (3 technical repeats) from a total of 3 biological replicates. c, Left: effects of pink-1, pdr-1, dct-1, sqst-1 and bec-1 on Kaem- and Rhap-dependent memory improvement in the hAβ1–42 (CL2355) worms. Right: effects of Kaem and Rhap on associative memory in adult day 1 hAβ1–42Glu;hApoE3Glu (UA353) and hAβ1–42Glu;hApoE4Glu (UA355) worms. ‘Glu’ denotes that either hAβ1–42 or hApoEs were expressed only in the glutamatergic neurons. Data were pooled from at least 4 biological replicates. d, Effect of Kaem or Rhap on glutamatergic neuroprotection in the hAβ1–42Glu;ApoE4 worms and other worm strains. Left: distribution of worms with different numbers of 5 designated tail neurons (n = 80–100 from 2 biological replicates). Right: the fluorescent intensity of PVR neurons (n = 15 from 2 biological replicates). e, Effects of Kaem and Rhap on acetylcholinesterase inhibitor aldicarb-induced paralysis. VC223 (a strain hypersensitive to aldicarb-induced paralysis) and NM204 (a strain resistant to aldicarb-induced paralysis) were used as controls. All quantitative data are shown as mean ± s.e.m. Two-way ANOVA followed by Tukey’s multiple comparisons test (ae); NS, no significance; *P < 0.05, **P < 0.01, ***P < 0.001. Effects of Kaem and Rhap on Aβ generation in mouse neuroblastoma cells are shown in Extended Data Fig. 1c–f. Additional data related to e are in Supplementary Fig. 6. Source data
Fig. 5
Fig. 5. Mitophagy stimulation restores memory deficit in the AD-like hTau(P301L) C. elegans model and inhibits Tau pathologies in mammalian cells.
a,b, Effects of Kaem (a) or Rhap (b) on associative memory in transgenic nematodes expressing hTau(P301L) (CK12). Data were pooled from 4 biological replicates. c,d, Effects of Kaem (c) and Rhap (d) on designated gene expressions in adult day 1 worms. Data are from a total of 3 biological replicates. e, Effects of pink-1, pdr-1, dct-1, sqst-1 and bec-1 on Kaem- and Rhap-dependent memory improvement in the hTau(P301L) worms. f, Western blot data with semi-quantifications showing changes in designated phosphorylated Tau sites in the HEK 293 cells expressing pTRE3G-mcherry-BI promoter-EGFP Tau P301L (HEK 293 3G-EGFP-Tau P301L/mCherry) with 24 h treatment of Kaem or Rhap. g, Effects of Kaem and Rhap on seeded Tau-induced endogenous Tau aggregation in the HEK293 cells expressing 0N4R P301S Tau-Venus. Data are from 3 biological replicates. h, Evaluation of any synergistic effects of Kaem and Rhap on associative memory in hTau(P301L) (CK12) worms. Data were pooled from 3 biological replicates. All quantitative data are shown as mean ± s.e.m. Two-way ANOVA followed by Tukey’s multiple comparisons test (ah). NS, no significance; *P < 0.05, **P < 0.01, ***P < 0.001. Additional Tau seeding data are included in Extended Data Fig. 3h–k. Original western blot gels for f are included in Source Data Fig. 2.
Fig. 6
Fig. 6. Mitophagy stimulation forestalls memory loss and ameliorates both Aβ and Tau pathologies in 3xTg AD mice.
The 3xTg AD mice were treated with Kaem or Rhap (100 mg kg−1 d−1) via oral gavage for 2 months starting from 12.5 months of age. a, Representative images of the swimming tracks of mice at day 7 in the Morris water maze test (n = 6 mice per group). b, Latency to the platform of mice from days 1 to 6. c, Platform frequency of mice in the probe trial at day 7. d,e, Effects of Kaem and Rhap on spontaneous alternation (d) (Y maze) and novel object recognition/NOR (e). f,g, Soluble and insoluble Aβ1–40 and Aβ1–42 levels in hippocampal tissues. n = 5 mice in all groups. h, Immunohistochemical analysis of Aβ load in 3xTg AD mice hippocampi and cortices under Kaem or Rhap treatment. Experiments were repeated twice independently, with similar results. i, Quantification of Aβ load per ROI in images from h. n = 10 random areas in the ROIs from 3 mice per group. jl, Semi-quantification of western blot data showing effects of Kaem and Rhap on the levels of full-length APP (FL-APP), CTF-β and CTF-α in hippocampal tissues from the 3xTg AD mice (n = 3 biologically independent samples). m, Representative immunofluorescence staining of AT8-positive cells in the cortex and hippocampus of 3xTg AD mouse brains. Experiments were repeated twice independently, with similar results. The blue and red squares denote designated brain regions were magnified. n, Quantified data of m (n = 10 random areas in the ROIs from 3 mice in each group). o, Effects of Kaem and Rhap on the expression levels of different p-Tau sites (Thr181, Ser202/Thr205, Thr217 and Thr231) in hippocampal tissues from the 3xTg AD mice (n = 3 mice per group). All quantitative data are shown as mean ± s.e.m. Two-way ANOVA followed by Tukey’s multiple comparisons test (bg, il, n). NS, no significance; *P < 0.05, **P < 0.01, ***P < 0.001. Additional data on the mechanisms of mitophagy induction by Kaem and Rhap in mice are shown in Extended Data Fig. 4. Original western blot gels for o are included in Source Data Fig. 3.
Extended Data Fig. 1
Extended Data Fig. 1. Kaem and Rhap induce mitophagy, abrogate disease pathologies, and improve healthspan and lifespan in cells, worm, or mouse models of AD.
a, b, electron microscopic images showing effects of Kaem and Rhap on mitochondrial morphology and mitophagy-like events in mt-Keima HeLa cells (a, 20 µM for 24 h) and mouse hippocampal brain tissues (b, 100 mg/kg/d via oral gavage from 12 months for 7 consecutive days; n = 3 mice per group with 4 random hippocampal neuronal images per mouse), treated with Kaem and Rhap. Blue arrows indicate mitophagosome-like events, while red arrows point to damaged mitochondria. Quantitative data of a and b are shown in Fig. 3m and Fig. 3n, respectively. cf, Effects of Kaem and Rhap on the expression of designated proteins involved in Aβ production. N2a and N2S (N2a stably transfected with human Swedish mutant APP695) cells were used. One set of western blot data is shown (c), with semi-quantifications from three biological replicates (df). All quantitative data were shown in mean ± S.E.M. One-way ANOVA followed by Šidák’s multiple comparisons test (d-f) were used for data analysis. NS, no significance, *p < 0.05, **p < 0.01, ***p < 0.001. Original western blot gels for (c) are included in Source Data Fig. 2. gi, Effects of Kaem and Rhap on lifespan of the N2 and hTau[P301L] (CK12) worms. Data shown are from one set of experiments from a total of two biological replicates (quantitative values in Supplementary Table 4). 90–120 worms were used for each group/biological repeat. All quantitative data were shown in mean ± S.E.M. Log-rank test was used for the statistics of lifespan data (gi). NS, no significance, *p < 0.05, **p < 0.01, ***p < 0.001. jl, Quantification of phosphorylated Tau sites (Thr181, Ser202/Thr205, Thr217) in hippocampal tissues from the 3xTg AD mice (n = 3 biological replicates). The western blotting gel data are shown in Fig. 6o. mo, Effects of PINK1 knockdown on p-Tau inhibition by Kaem and Rhap in HEK 293 3G-EGFP-Tau P301L/mCherry cells. While one biological set of blot data are shown (m), quantifications (n, o) were from 3 biological replicates. All quantitative data were shown in mean ± S.E.M. Two-way ANOVA followed by Tukey’s multiple comparisons test (j, k. l) and one-way ANOVA followed by Šidák’s multiple comparisons test (n, o) were used for data analysis. NS, no significance, *p < 0.05, **p < 0.01, ***p < 0.001. Original western blot gels for (m) were included in Source Data Fig. 2.
Extended Data Fig. 2
Extended Data Fig. 2. Kaem and Rhap induce expression of a broad spectrum of autophagy/mitophagy proteins.
a, A representative set of western blot images for designated proteins upon Veh., Kaem (20, 50, 100 μM) or Rhap (20, 50, 100 μM) administration for 24 h. Arrow head in the right panel pointed to ‘FUNDC1’, with bands upper and lower were likely unknown or non-specific bands. b, c, Semi-quantification of a from three biological replicates with data shown in mean ± S.E.M. One-way ANOVA followed by Šidák’s multiple comparisons test was used for data analysis, with *p < 0.05, **p < 0.01, ***p < 0.001. Original western blot gels for (a) were included in Source Data Fig. 1.
Extended Data Fig. 3
Extended Data Fig. 3. Mitophagy stimulation restores memory deficit and improves healthspan in the AD-like hTau[F3ΔK280] C. elegans model.
a, Effects of Kaem and Rhap on associative memory in transgenic animals expressing hTau[F3ΔK280]. b, mRNA levels of genes affected by Kaem and Rhap in the hTau[F3ΔK280] worms. c, Effects of pink-1, pdr-1, dct-1, sqst-1, and bec-1 on Kaem- and Rhap-induced associative memory in the hTau[F3ΔK280] worms. d, A summary of mitophagy genes involved in Kaem and Rhap-induced memory improvement in the hTau[F3ΔK280] worms. e, Memory assay of worms maintained on UV-killed OP50 treated with 0.2 mM Kaem, 0.2 mM Rhap or Veh. f, Pharyngeal pumping rates at days 1, 5 and 9 of adulthood in worms treated with 0.2 mM Kaem, 0.2 mM Rhap or Veh (n = 15). g, Mobility of hTau[P301L] worms treated with Kaem (n = 50–100 worms) or Rhap (n = 50–100 worms). Adult Day-1 worms were used. One set of data are shown from a total of two biological replicates. hk, Effects of Kaem and Rhap on reduction of aggregated Tau in the HEK293 P301S Tau-Venus cells. Exogenous recombinant heparin-assembled P301S Tau (Tau seeds) induces conversion of endogenous Tau Venus from a dispersed distribution to bright foci (h, i). Tests to determine the mechanism of the effect of drugs affecting the degradation of aggregated Tau were performed (j, k). One image/well was taken, with a total of 8 technical repeats per biological replicate. Data were analysed using ImageJ with images from 3 biological replicates. l, Toxicity evaluation of Kaem or Rhap on PC12 cells using MTT. All quantitative data are shown in mean ± S.E.M. Two-way ANOVA followed by Tukey’s multiple comparisons test (ac, eg), one-way ANOVA followed by Šidák’s multiple comparisons test (jl), and student t-test (i) were used for data analysis. NS, no significance, *p < 0.05, **p < 0.01, ***p < 0.001.
Extended Data Fig. 4
Extended Data Fig. 4. Kaem and Rhap inhibit Aβ production, increase microglial phagocytosis, and induce mitophagy and autophagy.
a, Effects of Kaem and Rhap on protein levels of full-length APP (FL-APP), CTF-α and CTF-β in hippocampal tissues from 3xTg AD mice (n = 3 per group). b, c, Quantification of phosphorylated Tau sites (Thr231) and total Tau/GAPDH in hippocampal tissues from 3xTg AD mice (n = 3 biologically independent samples). d, e, Effects of Kaem and Rhap on microglial phagocytosis of Aβ plaques in hippocampal tissues from 3xTg AD mice. Data were quantified from 3 random images/mouse from a total of 3 mice (d). Aβ plaques are shown in green (6E10 antibody) and microglia (anti-Iba1 antibody) are in red (e). f, Western blot results showing the effects of Kaem and Rhap on the levels of proteins involved in mitophagy (PINK1, Parkin, OPTN, p-ULK1-Ser555 and ULK1) and substrates of autophagy (p62 and LC3-II/I) in the hippocampal tissues of the mice (n = 3 mice per group). gl, Quantification of Western blot data in (f), n = 3 biologically independent samples. se: short-exposure; le: long-exposure. m, Western blot results showing the effects of Kaem and Rhap on the levels of proteins involved in OXPHOS in the hippocampal tissues of the mice (n = 3 mice per group). n, Effects of Kaem and Rhap on autophagy induction using a HeLa cell line stably expressing GFP-LC3 following Kaem (10 μM) or Rhap (10 μM) treatment for 12 h before imaging. o, p, Western blot data (o) with semi-quantification (p) showing the effects of Kaem and Rhap on levels of LC3-II/I in the HEK293 cells (n = 3 biologically independent samples). All quantitative data shown in mean ± S.E.M. One-way ANOVA followed by Šidák’s multiple comparisons test (bd, gl, p) was used for data analysis. NS, no significance, *p < 0.05, **p < 0.01, ***p < 0.001. Original unprocessed western blots for a, f, m, o are available in Source Data Figs. 2–4.
Extended Data Fig. 5
Extended Data Fig. 5. Kaem and Rhap are toxicologically safe to nematodes up to 1 mM and they do not show memory retention activity until reaching to 0.2 mM.
Toxicological effects of Kaem or Rhap (0.01, 0.05, 0.1, 0.2 mM from egg hatching onwards) on fecundity (3-h egg-lay) (a), egg hatching (b), development to L4 (c), and time to reach adulthood (d). e, Effects of different doses of Kaem and Rhap (0.01, 0.05, 0.1, 0.2 mM from egg hatching onwards) on associative memory in transgenic animals expressing hTau[301 L]. All quantitative data are shown in mean ± S.E.M. from three biological repeats. Two-way ANOVA followed by Tukey’s multiple comparisons test was used for data analysis. NS, no significance, ***p < 0.001.

Comment in

References

    1. Lou G, et al. Mitophagy and neuroprotection. Trends Mol. Med. 2019;26:8–20. - PubMed
    1. Kerr JS, et al. Mitophagy and Alzheimer’s disease: cellular and molecular mechanisms. Trends Neurosci. 2017;40:151–166. - PMC - PubMed
    1. Yuan J, et al. Two conserved epigenetic regulators prevent healthy ageing. Nature. 2020;579:118–122. - PubMed
    1. Kobro-Flatmoen A, et al. Re-emphasizing early Alzheimer’s disease pathology starting in select entorhinal neurons, with a special focus on mitophagy. Ageing Res. Rev. 2021;67:101307. - PubMed
    1. Lautrup S, Sinclair DA, Mattson MP, Fang EF. NAD(+) in brain aging and neurodegenerative disorders. Cell Metab. 2019;30:630–655. - PMC - PubMed

Publication types

Substances