. 2021 Dec 24:16:3513-3524.
doi: 10.2147/COPD.S339243. eCollection 2021.

Serum Creatinine/Cystatin C Ratio Associated with Cross-Sectional Area of Erector Spinae Muscles and Pulmonary Function in Patients with Chronic Obstructive Pulmonary Disease

Affiliations

Serum Creatinine/Cystatin C Ratio Associated with Cross-Sectional Area of Erector Spinae Muscles and Pulmonary Function in Patients with Chronic Obstructive Pulmonary Disease

Kazuaki Nishiki et al. Int J Chron Obstruct Pulmon Dis. .

Abstract

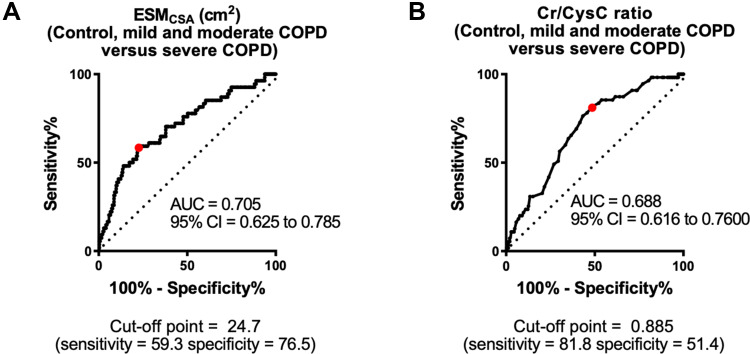
Purpose: Muscle atrophy is a major clinical feature of chronic obstructive pulmonary disease (COPD) and is considered a predictor of mortality in COPD patients. Recently, the cross-sectional area (CSA) of the erector spinae muscles measured by chest computed tomography (CT) scans (ESMCSA) has been reported as a clinical parameter reflecting disease severity and future prognosis in patients with COPD. In addition, the serum creatinine (Cr)/cystatin C (CysC) ratio has been considered a quantitative marker of residual muscle mass, because serum Cr levels are affected by muscle mass, and correction by CysC counteracts the effect of renal function on serum Cr levels. The purpose of this study was to assess whether the serum Cr level corrected by serum CysC can be used as a predictive marker of pulmonary function and disease severity in patients with COPD.

Patients and methods: A total of 99 patients without COPD and 201 patients with COPD, with a smoking history of more than 10 pack-years were enrolled in this study, and serum Cr and CysC levels were measured. On chest high-resolution CT images, %low attenuation area (LAA%) (≤960 Hounsfield units (HU)) and ESMCSA at the Th12 level were identified.

Results: There was a significant correlation between the ESMCSA and the Cr/CysC ratio. The Cr/CysC ratio was significantly associated with forced vital capacity (FVC) and forced expiratory volume in 1 second (FEV1) values, especially in former smokers.

Conclusion: The serum Cr/CysC ratio could be a convenient substitute for the measurement of muscle atrophy and pulmonary function testing in patients with COPD.

Keywords: low attenuation area; muscle atrophy; sarcopenia; smoking status.


Conflict of interest statement

The authors report no conflicts of interest in this work.

Figures

Figure 1
Figure 1
Representative chest computed tomography (CT) image used to measure the cross-sectional area of erector spinae muscles (ESMCSA). The manually selected area (yellow) is used to measure ESMCSA using the computer software, Image J.
Figure 2
Figure 2
The cross-sectional area of the ESMCSA measured from chest CT (A) and the serum creatinine/cystatin C (Cr/CysC) ratio (B) of smoker control patients (control) and patients with mild, moderate, and severe chronic obstructive pulmonary disease (COPD). Both ESMCSA and the Cr/CysC ratio are significantly lower in severe COPD patients than in other groups. Data are expressed as means ± standard deviation.
Figure 3
Figure 3
The figures show the correlation analyses between serum Cr levels and ESMCSA measured from chest CT in the total patient sample (A) and in patients with normal serum CysC levels (B), and the correlation analysis between the serum Cr/CysC ratio and ESMCSA (C). The Cr levels in patients with normal CysC levels and the Cr/CysC ratio are significantly correlated with ESMCSA.
Figure 4
Figure 4
Receiver operating characteristic (ROC) curves and areas under the ROC curves (AUCs) of Cr/CysC and ESMCSA. The ROC curve and AUC of ESMCSA for severe COPD. The cut-off point of ESMCSA for severe COPD is 24.65 (AUC 0.705 (95% confidence interval [CI] 0.625–0.785), sensitivity = 59.3%, specificity = 76.3%) (A). The ROC curve and AUC of Cr/CysC for severe COPD. The cut-off point of Cr/CysC for severe COPD is 0.865 (AUC 0.688 (95% CI 0.616–0.760), sensitivity = 76.4%, specificity = 56.7%) (B).
Figure 5
Figure 5
The figures show the correlation analyses between the serum Cr/CysC ratio and age (A), BMI (B), low attenuation area (LAA%) (C), forced expiratory volume in 1 second (FEV1) (D), FEV1/forced vital capacity (FVC) (FEV1%) (E), FEV1% predicted (%FEV1) (F), FVC (G), and FVC % predicted (%FVC) (H). Age, FEV1, FVC, and %FVC are significantly correlated with the serum Cr/CysC ratio.
Figure 6
Figure 6
The figures show the correlation analyses between the serum Cr/CysC ratio and age (A), BMI (B), low attenuation area (LAA%) (C), forced expiratory volume in 1 second (FEV1) (D), FEV1/forced vital capacity (FVC) (FEV1%) (E), FEV1% predicted (%FEV1) (F), FVC (G), and FVC % predicted (%FVC) (H).
Figure 7
Figure 7
The figures show the correlation analyses between the serum Cr/CysC ratio and FEV1, %FEV1, FVC, and %FVC. Comparing the group 65 years and older (A) with the group younger than 65 years (B), the pulmonary functions are better correlated with the Cr/CysC ratio in the group younger than 65 years. Age, FEV1, and FVC are weakly correlated with the serum Cr/CysC ratio.
Figure 8
Figure 8
The figures show the correlation analyses between serum CysC levels and both serum CRP levels (A) and LAA% (B). The CRP level is weakly correlated with the CysC level, and there is no significant correlation between LAA% and the serum CysC level.
Figure 9
Figure 9
The upper figures show correlation analyses between the serum Cr/CysC ratio and ESMCSA in current smokers (A) and former smokers (B). The lower figures show the correlation analyses between the serum Cr/CysC ratio and the FEV1 value in current smokers (C) and former smokers (D). There are stronger correlations between the Cr/CysC ratio and both ESMCSA and the FEV1 value in former smokers than in current smokers.

References

    1. Landbo C, Prescott E, Lange P, et al. Prognostic value of nutritional status in chronic obstructive pulmonary disease. Am J Respir Crit Care Med. 1999;160(6):1856–1861. doi:10.1164/ajrccm.160.6.9902115 - DOI - PubMed
    1. Schols AMWJ, Broekhuizen R, Weling-Scheepers CA, et al. Body composition and mortality in chronic obstructive pulmonary disease. Am J Clin Nutr. 2005;82(1):53–59. - PubMed
    1. Ischaki E, Papatheodorou G, Gaki E, et al. Body mass and fat-free mass indices in COPD: relation with variables expressing disease severity. Chest. 2007;132(1):164–169. doi:10.1378/chest.06-2789 - DOI - PubMed
    1. Cruz-Jentoft AJ, Baeyens JP, Bauer JM, et al. Sarcopenia: European consensus on definition and diagnosis: report of the European Working Group on Sarcopenia in Older People. Age Ageing. 2010;39(4):412–423. doi:10.1093/ageing/afq034 - DOI - PMC - PubMed
    1. Chen L-K, Liu L-K, Woo J, et al. Sarcopenia in Asia: consensus report of the Asian Working Group for Sarcopenia. J Am Med Dir Assoc. 2014;15(2):95–101. doi:10.1016/j.jamda.2013.11.025 - DOI - PubMed

MeSH terms