. 2020 Mar;14(1):74-93.
doi: 10.1214/19-AOAS1278.

Efficient Real-Time Monitoring of an Emerging Influenza Pandemic: How Feasible?

Affiliations

Efficient Real-Time Monitoring of an Emerging Influenza Pandemic: How Feasible?

Paul J Birrell et al. Ann Appl Stat. 2020 Mar.

Abstract

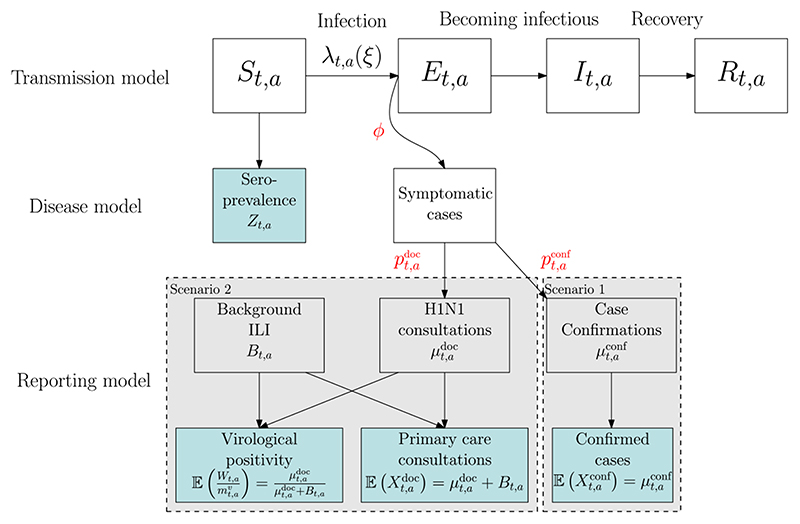
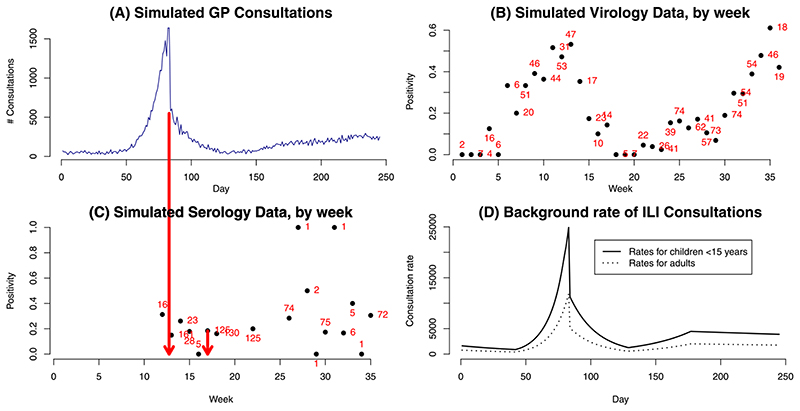
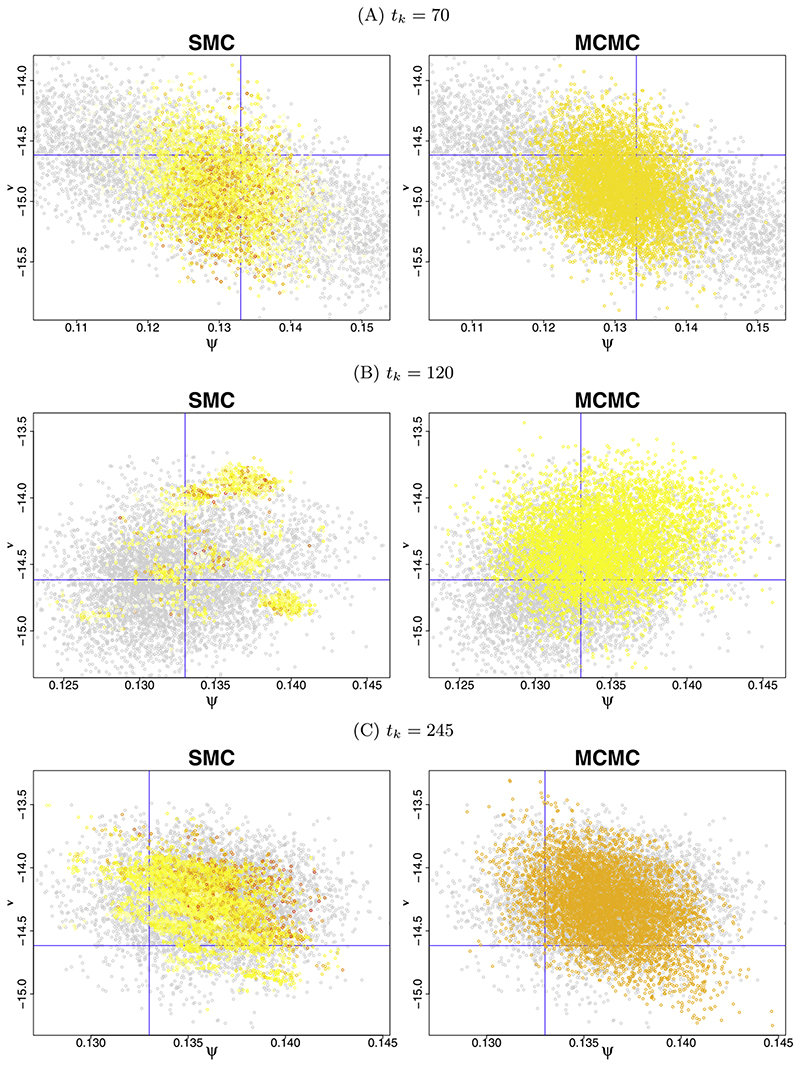
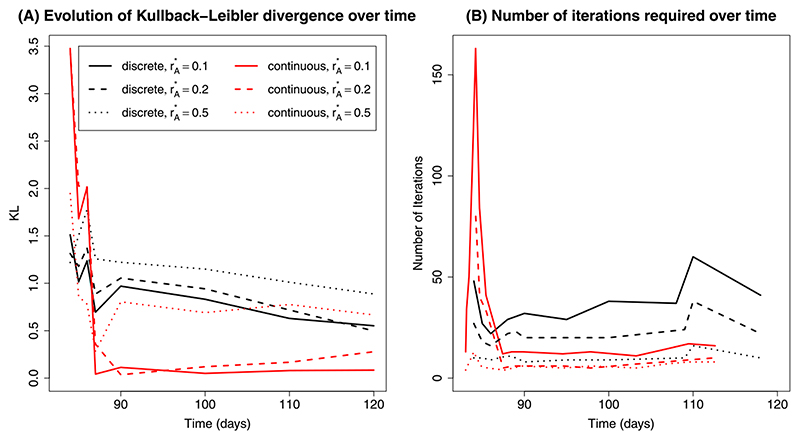
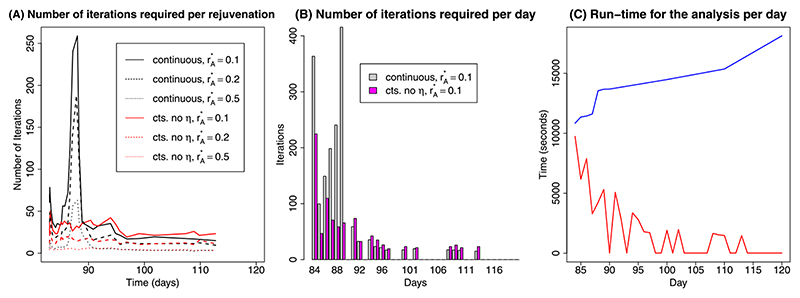
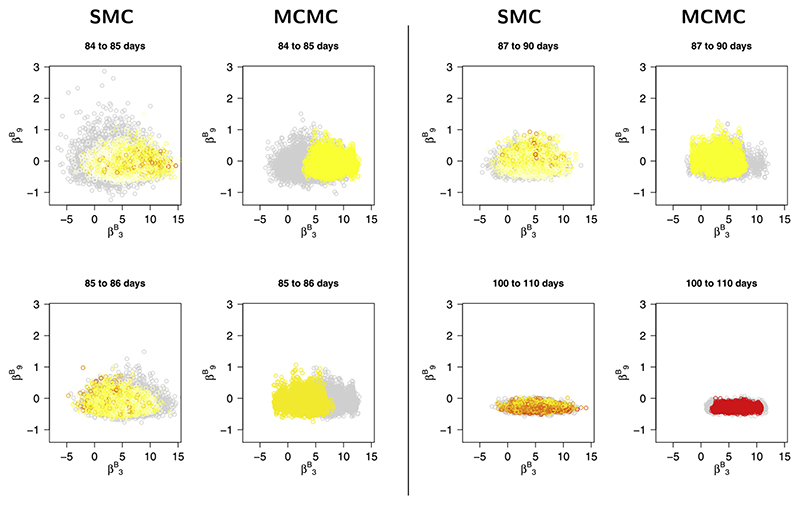
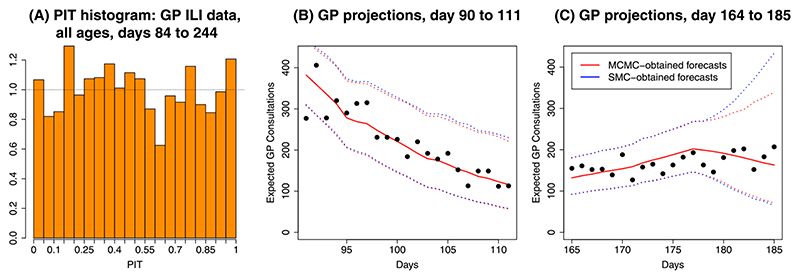
A prompt public health response to a new epidemic relies on the ability to monitor and predict its evolution in real time as data accumulate. The 2009 A/H1N1 outbreak in the UK revealed pandemic data as noisy, contaminated, potentially biased and originating from multiple sources. This seriously challenges the capacity for real-time monitoring. Here, we assess the feasibility of real-time inference based on such data by constructing an analytic tool combining an age-stratified SEIR transmission model with various observation models describing the data generation mechanisms. As batches of data become available, a sequential Monte Carlo (SMC) algorithm is developed to synthesise multiple imperfect data streams, iterate epidemic inferences and assess model adequacy amidst a rapidly evolving epidemic environment, substantially reducing computation time in comparison to standard MCMC, to ensure timely delivery of real-time epidemic assessments. In application to simulated data designed to mimic the 2009 A/H1N1 epidemic, SMC is shown to have additional benefits in terms of assessing predictive performance and coping with parameter nonidentifiability.

Keywords: SEIR transmission model; Sequential Monte Carlo; pandemic influenza; real-time inference; resample-move.


Figures

Fig. 1
Fig. 1
Schematic diagram showing multiple epidemics surveillance sources linking to an SEIR epidemic model via an observation and reporting model. The shaded blue boxes represent observed data streams.
Fig. 2
Fig. 2
Top row: (A) Number of doctor consultations Xtk,adoc; (B) swab positivity data (Wtk,a) with numbers representing the size of the weekly denominator. Bottom row: (C) serological data (Ztk,a); (D) pattern of background consultation rates by age. Arrows between (A) and (C) highlight the timing of some key, informative observations.
Fig. 3
Fig. 3
Comparison of SMC-obtained posteriors and MCMC-obtained posteriors at tk= 70 (A), tk= 120 (B) and tk= 245 (C) days via scatter plots for the parameters ψ and ν. The grey points in both the left and the right panels represent the MCMC-obtained sample at the beginning of the interval, with the overlaid coloured points representing the SMC or MCMC-obtained samples at the end of the interval. In the SMC-obtained samples, the colour of the plotted points represents the weight attached to the particle, with the red particles being those of heaviest weight.
Fig. 4
Fig. 4. (A) Kullback–Leibler divergence over time; (B) Number of proposals required at each rejuvenation time by algorithm.
Fig. 5
Fig. 5
(A) Number of MH-steps required by the continuous-time SMC algorithms per rejuvenation over time; (B) Total number of MH-steps required by the continuous-time SMC algorithms per time interval; (C) The computation time required for model runs on each day using MCMC (blue line) and SMC (red line).
Fig. 6
Fig. 6
The evolution over time of the marginal joint posterior for two components of the parameter vector βB. Comparison between SMC-obtained and MCMC-obtained posterior distributions. Grey points indicate the distribution at the start of the interval.
Fig. 7
Fig. 7
(A) PIT histograms for the one-step-ahead predictions of GP ILI consultation data, calculated over 162 × 7 time and strata combinations. (B) and (C) Comparison of the observed GP data with posterior predictive distributions obtained using the SMC and MCMC algorithms at day 90 and 164, respectively. Solid lines give posterior medians of the distributions, and the dotted lines give 95% credible intervals for the data.

References

    1. Ahrens H. Multivariate variance-covariance components (MVCC) and generalized intraclass correlation coefficient (GICC) Biom J. 1976;18:527–533.
    1. Banterle M, Grazian C, Lee A, Robert CP. Accelerating Metropolis–Hastings algorithms by Delayed Acceptance. Foundations of Data Science. 2019;1:103–128.
    1. Bettencourt LMA, Ribeiro RM. Real time Bayesian estimation of the epidemic potential of emerging infectious diseases. PLoS ONE. 2008;3:e2185. doi: 10.1371/journal.pone.0002185. - DOI - PMC - PubMed
    1. Bierkens J, Fearnhead P, Roberts G. The Zig-Zag process and super-efficient sampling for Bayesian analysis of big data. Ann Stat. 2019;47:1288–1320.
    1. Birrell PJ, Ketsetzis G, Gay NG, Cooper BS, Presanis AM, Harris RJ, Charlett A, Zhang X-S, White P, et al. Bayesian modelling to unmask and predict the influenza A/H1N1pdm dynamics in London. Proc Natn Acad Sci USA. 2011;108:18238–18243. - PMC - PubMed

LinkOut - more resources