. 2021 Mar;2(3):327-339.
doi: 10.1038/s43018-021-00179-8. Epub 2021 Mar 11.

Bone marrow NG2+/Nestin+ mesenchymal stem cells drive DTC dormancy via TGFβ2

Affiliations

Bone marrow NG2+/Nestin+ mesenchymal stem cells drive DTC dormancy via TGFβ2

Ana Rita Nobre et al. Nat Cancer. 2021 Mar.

Abstract

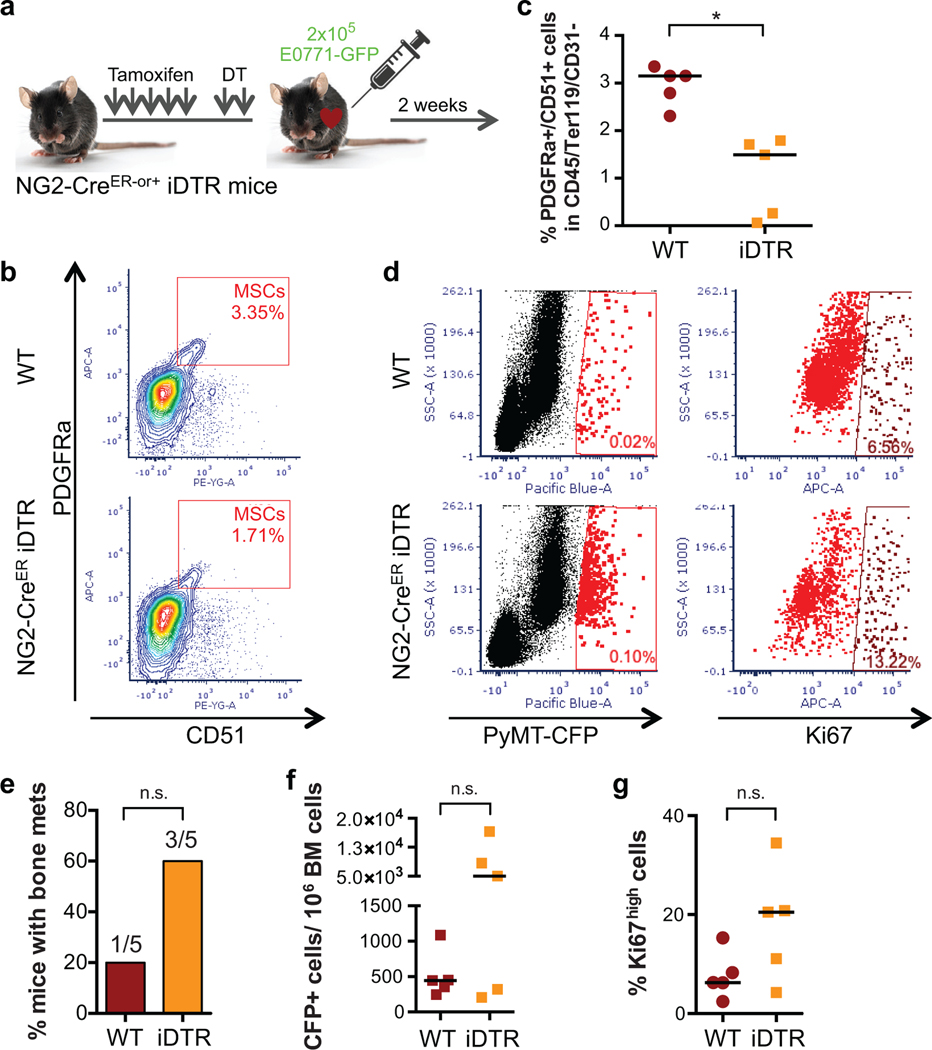
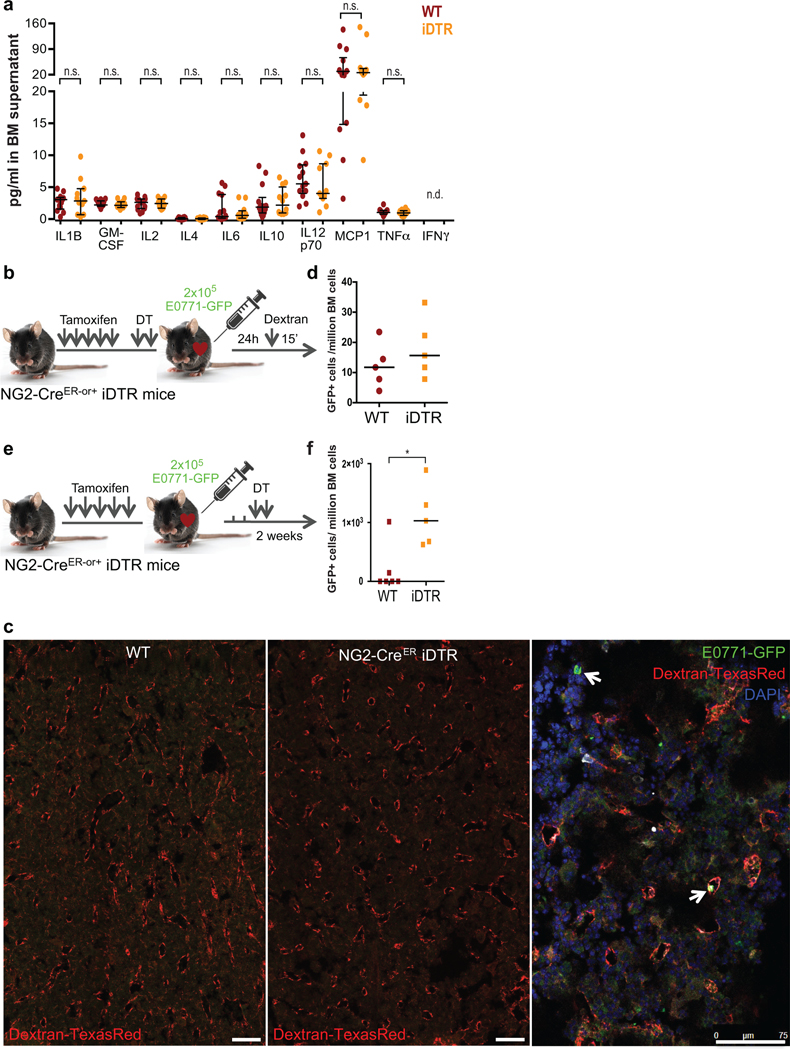
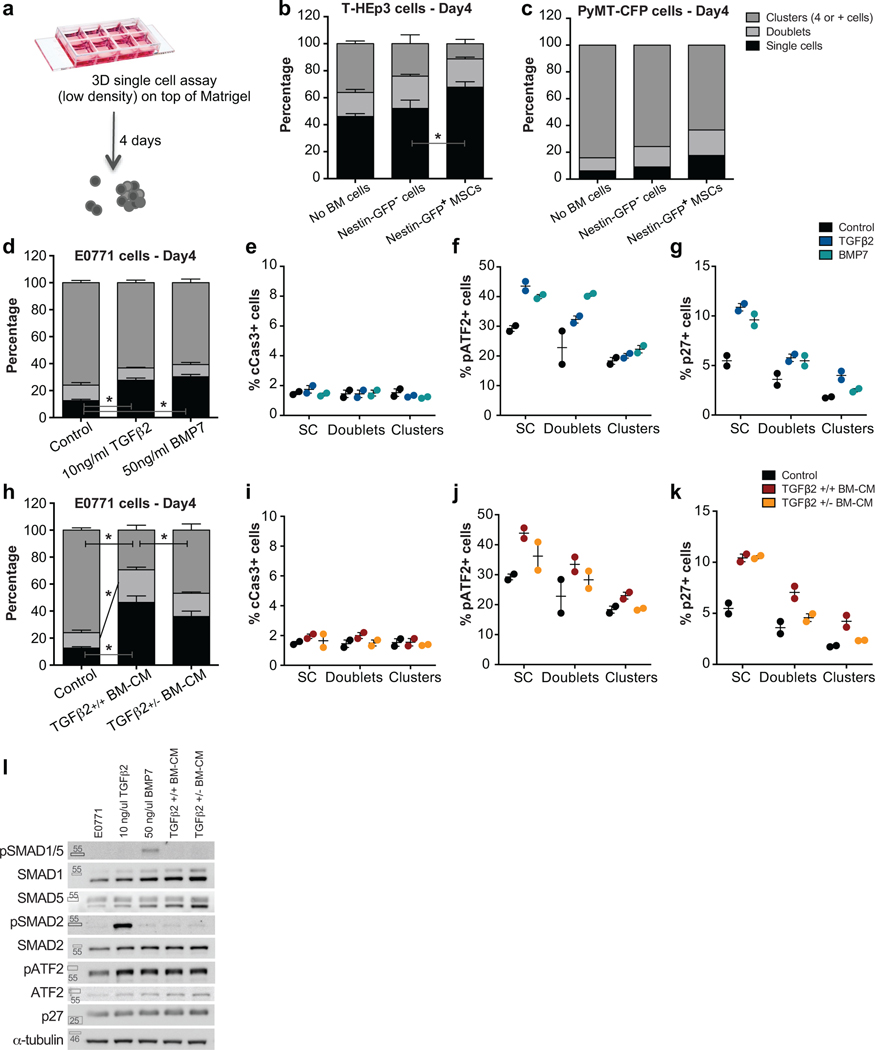
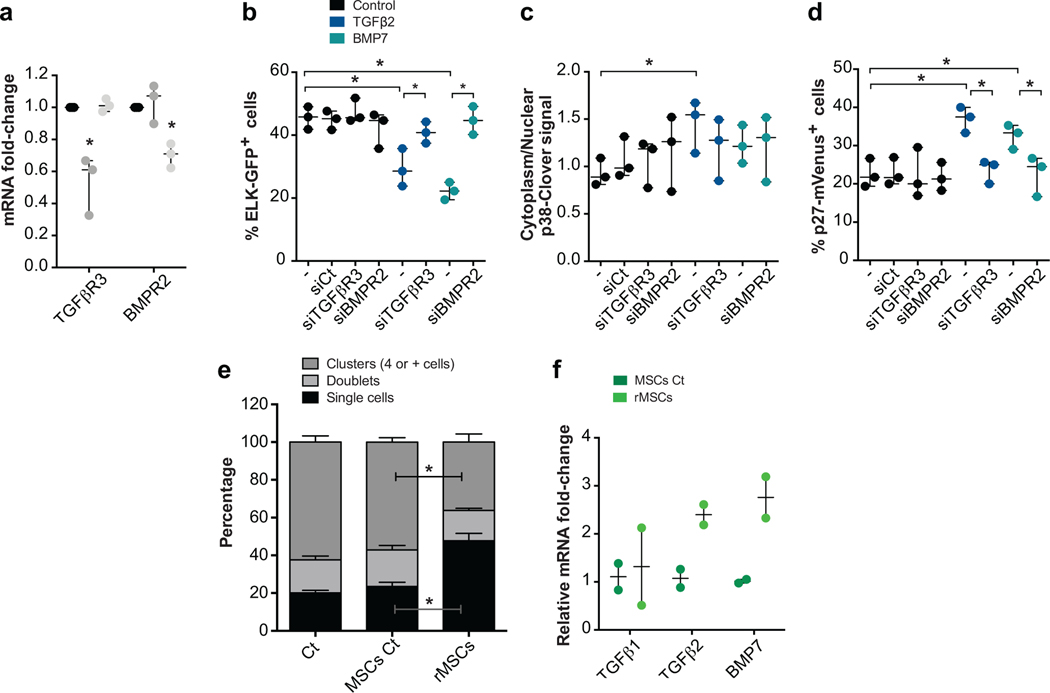
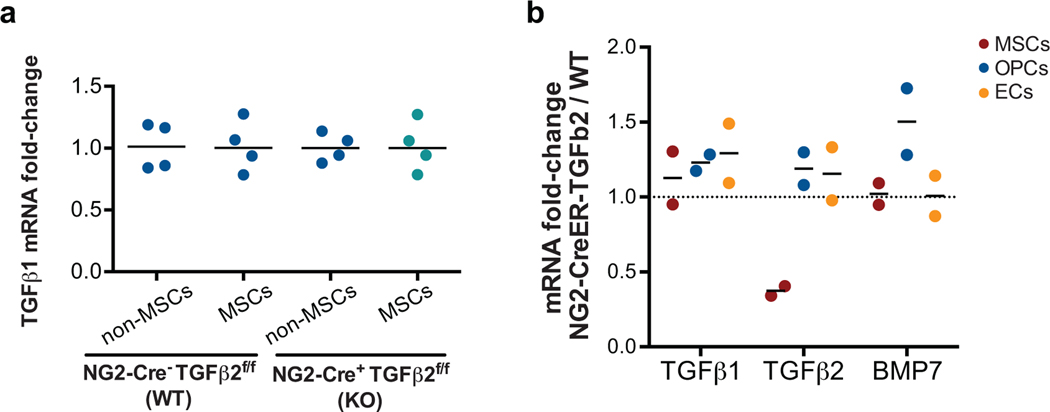
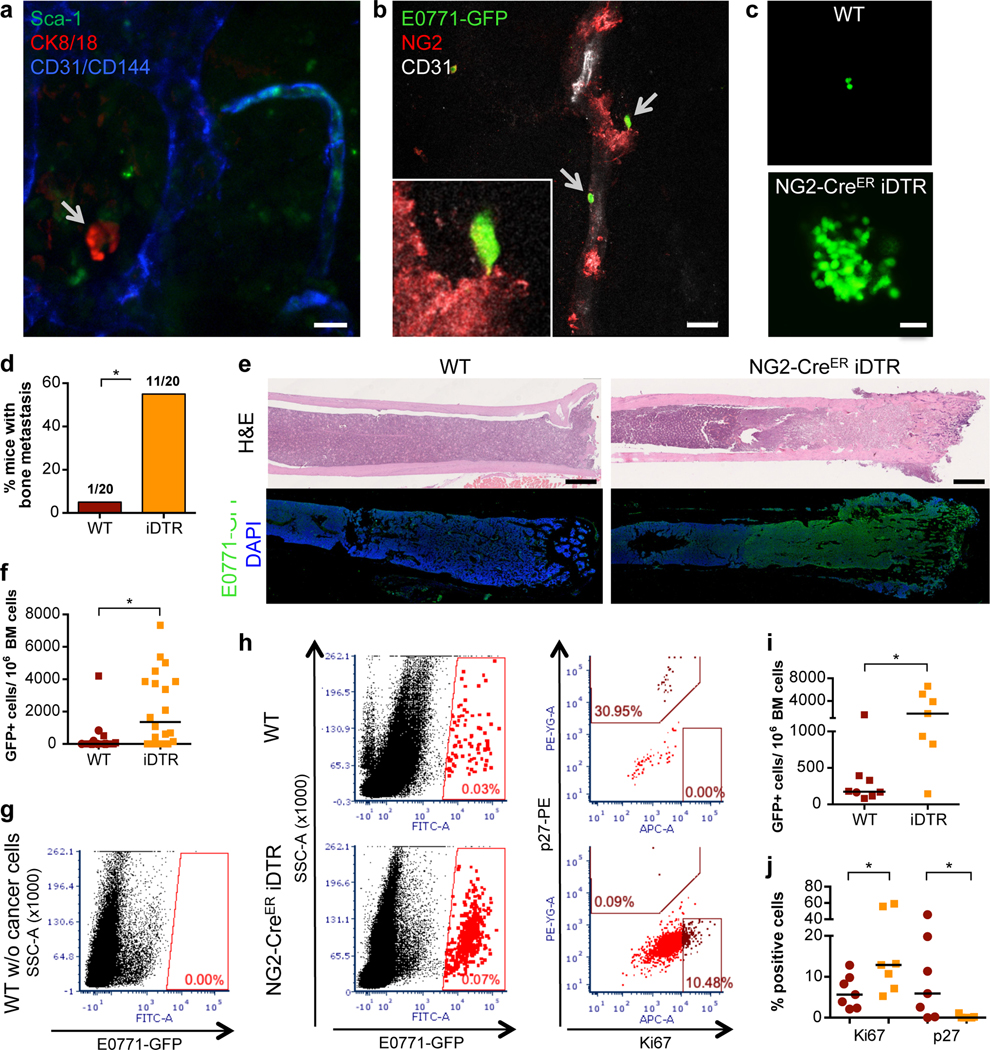
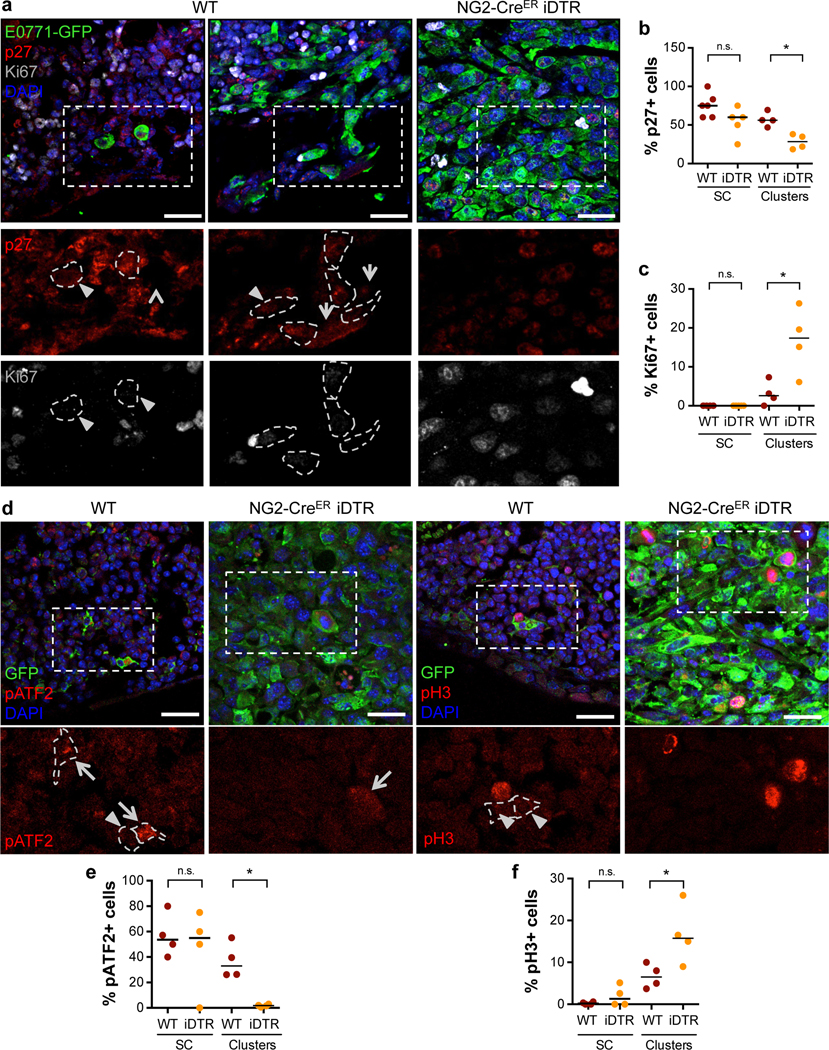
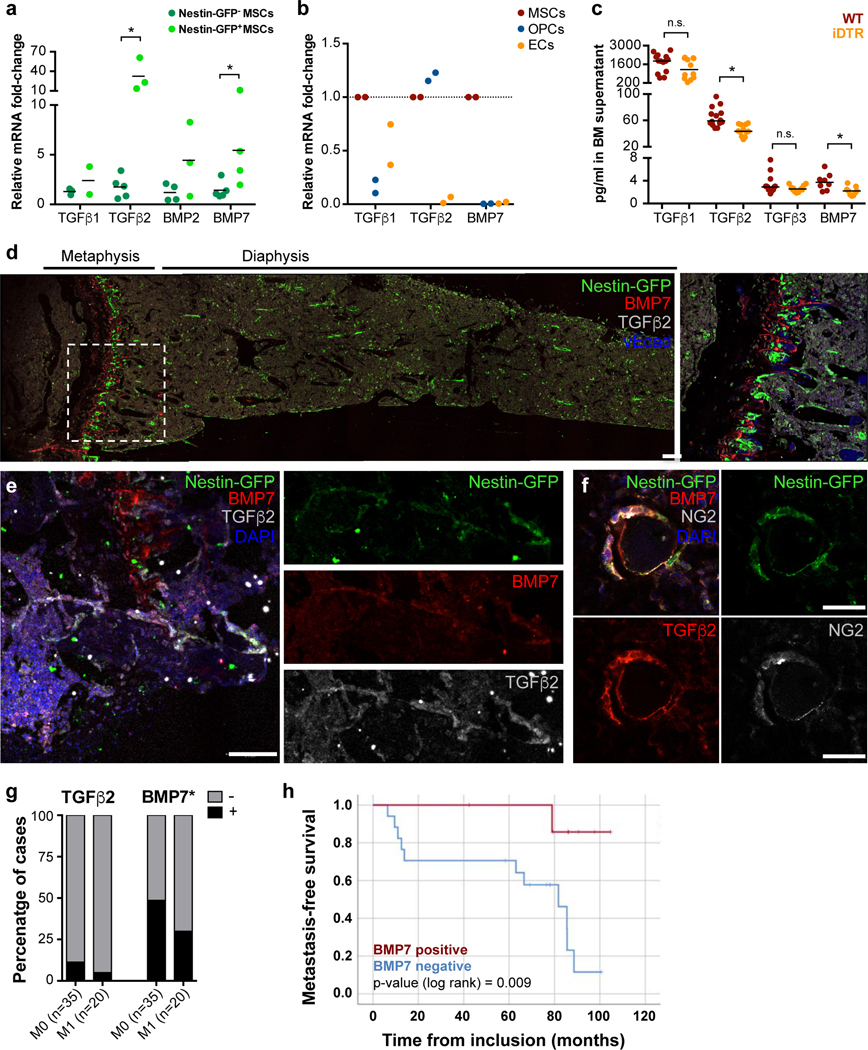
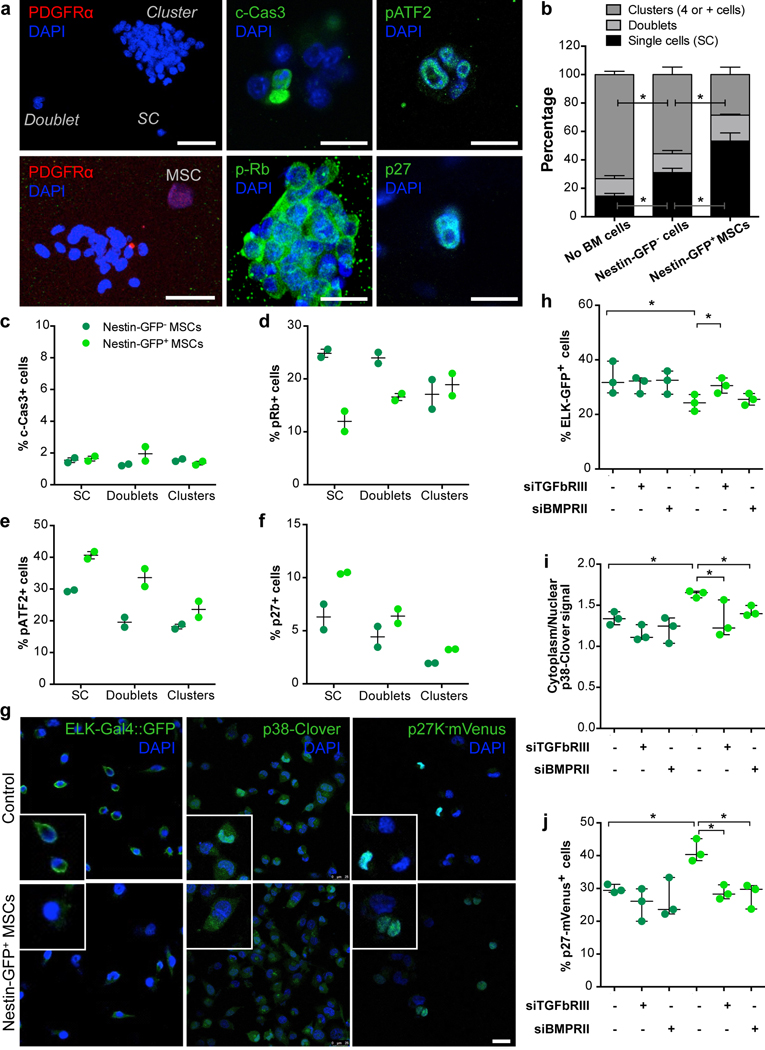
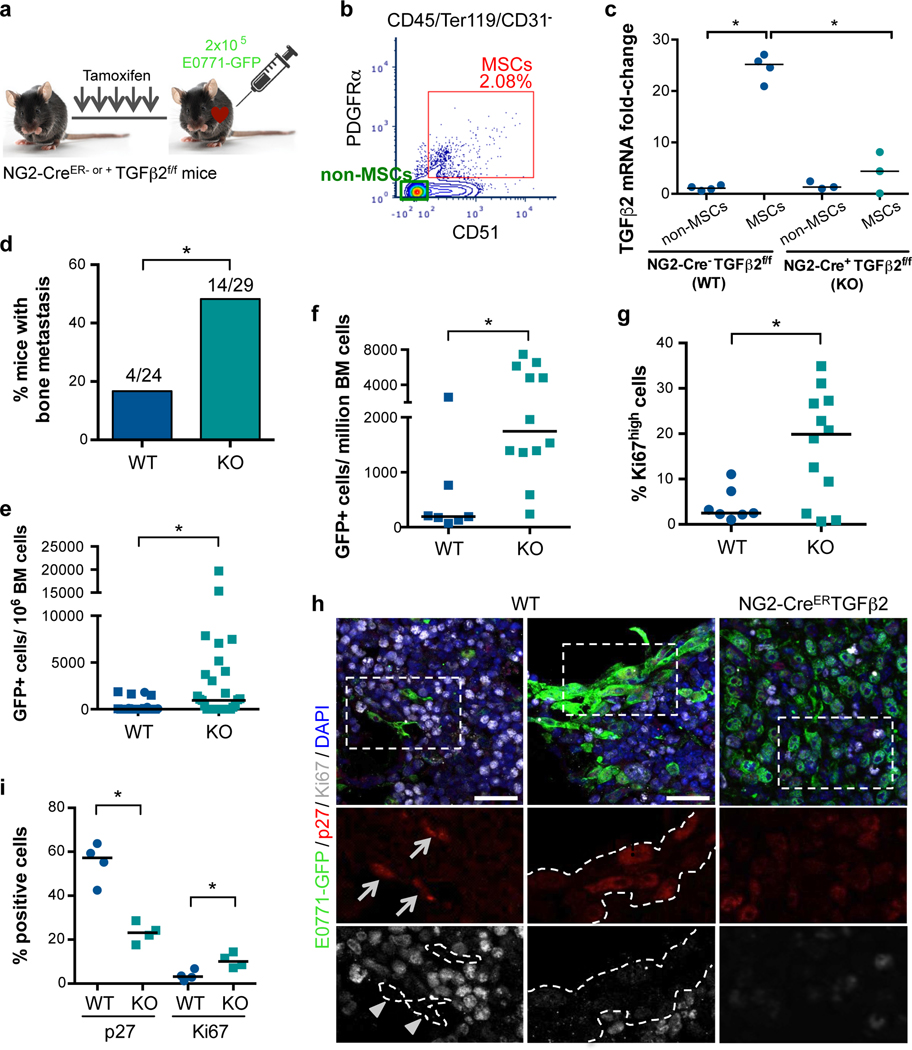
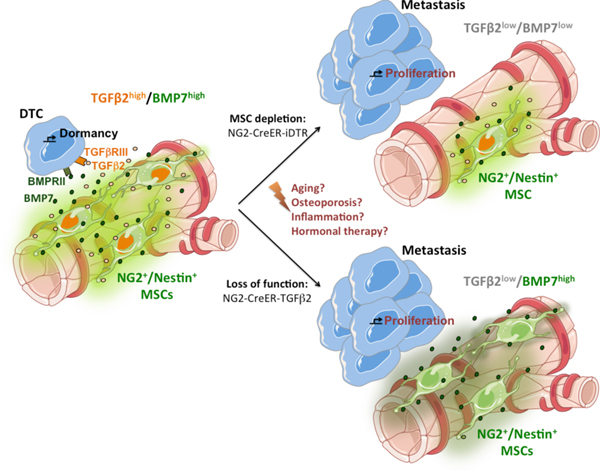
In the bone marrow (BM) microenvironment, where breast cancer (BC) disseminated tumour cells (DTCs) can remain dormant for decades, NG2+/Nestin+ mesenchymal stem cells (MSCs) promote hematopoietic stem cell quiescence. Here, we reveal that periarteriolar BM-resident NG2+/Nestin+ MSCs can also instruct BC DTCs to enter dormancy. NG2+/Nestin+ MSCs produce TGFβ2 and BMP7 and activate a quiescence pathway dependent on TGFBRIII and BMPRII, which via p38-kinase result in p27 induction. Genetic depletion of MSCs or conditional knock-out of TGFβ2 in MSCs using an NG2-CreER driver led to bone metastatic outgrowth of otherwise dormant p27+/Ki67- DTCs. Also ER+ BC patients without systemic recurrence displayed higher frequency of TGFβ2 and BMP7 detection in the BM. Our results provide a direct proof that HSC dormancy niches control BC DTC dormancy and suggest that aging or extrinsic factors that affect the NG2+/Nestin+ MSC niche homeostasis may result in a break from dormancy and BC bone relapse.


Figures

Extended Data 1
Extended Data 1. Control of depletion of NG2+/Nestin+ MSCs and awakening of dormant PyMT-CFP DTCs in the BM.
a. 7-week old NG2-CreERiDTR mice (NG2-CreER- or +) were daily injected with tamoxifen for 5 days, followed by 1-day rest and 2 days with diphtheria toxin (DT). 24 hours later 2×10⁵ E0771-GFP cells were intra-cardiac injected and 2 weeks later mice were euthanized. b-c. FACS plots (b) and quantifications (c) confirming the depletion of NG2+/Nestin+ MSCs (CD45-Ter119-CD31-PDGFRα+CD51+) in NG2-CreERiDTR mice upon TAM and DT treatments compared with WT mice (n=5 WT and 5 iDTR mice, median, 2-tailed Mann–Whitney U-test, p=0.008). d-g. Detection and characterization of MMTV-PyMT-CFP cells in BM flushes by FACS (n=5 WT and 5 iDTR mice). e. Incidence of bone metastasis (>1000 GFP+ DTCs/106 BM cells) 2 weeks after cancer cell injections (2-tailed Fisher’s exact test). f. Number of MMTV-PyMT-CFP cancer cells per million BM cells (median, 2-tailed Mann–Whitney U-test). g. Percentage of Ki67high E0771-GFP cancer cells (median, 2-tailed Mann–Whitney U-test). *p≤0.05 (p-values indicated above). n.s. not significant.
Extended Data 2
Extended Data 2. Pro-inflammatory cytokine status, vessel permeability and BM DTC seeding in NG2+/Nestin+ MSCs-depleted mice.
a. Levels of pro-inflammatory cytokines in BM supernatant of WT and NG2-CreERiDTR mice (n=13 WT and 11 iDTR mice, from 2 independent experiments, median and interquartile range, 2-tailed Mann–Whitney tests, *p≤0.05, n.s. not significant, n.d. not detected). b-d. NG2-CreERiDTR mice (NG2-CreER- or +) were daily i.p. injected with tamoxifen for 5 days followed by a rest day and 2 i.p. injections of DT. E0771-GFP cells were intra-cardiac injected and 24 hours after 70K Dextran-TexasRed was injected 15 minutes prior euthanasia. c. Representative images of Dextran extravasation in perfused bones. Arrows, E0771-GFP cells. d. Number of E0771-GFP cells detected after 1 week of in vitro expansion of the BM aspirates collected 24 hours after injection into mice (n=5 WT and 5 iDTR mice, median). e-f. NG2-CreERiDTR mice (NG2-CreER- or +) were daily i.p. injected with TAM for 5 days, followed by intra-cardiac injection of E0771-GFP cancer cells. Cells were allowed to disseminate and extravasate for 72 hours followed by 2 i.p. injections of DT. f. Number of E0771-GFP cells/million BM cells (n=5 WT and 5 iDTR mice, median and 2-tailed Mann–Whitney tests, p=0.015). *p≤0.05 (p-values indicated above), n.s. not significant.
Extended Data 3
Extended Data 3. Effect of NG2+/Nestin+ MSCs, TGFβ2 and BMP7 on signalling pathways and growth cancer cells.
a. 3D Matrigel assay used to track solitary cell to cluster growth. Single cells were plated on top of Matrigel in low density and the percentage of single cells, doublets and clusters was quantified 4 days after. b-c. Co-culture of human HNSCC PDX-derived T-HEp3 (b, n=4 independent experiments, 4 wells per condition, mean and SEM, 2-tailed Mann–Whitney tests p=0.04) and mouse BC MMTV-PyMT (c, n=2 independent experiments, 4 wells per condition, mean) cells with sorted Nestin-GFP- and Nestin-GFP+ MSCs for 4 days. d-k. E0771 cells were treated every day for 4 days with TGFβ2, BMP7 or bone marrow conditioned media (BM-CM) of TGFβ2+/+ or TGFβ2+/− mice. d and h. Percentage of cancer cells in a single cell, doublet or cluster state with the indicated treatments (d, n=5 independent experiments, 4 wells per condition each, mean and SEM, 2-tailed Mann–Whitney tests, p=0.03 and 0.005; h, n=4 independent experiments, 4 wells per condition each, mean and SEM, 2-tailed Mann–Whitney tests, p=0.000005, 0.0001, 0.002 (Ct vs. TGFβ2+/+: CS, doublets and clusters respectively) and 0.02 (TGFβ2+/+ vs. TGFβ2+/− clusters)). e-g and i-k. Percentage of positive cells for c-Cas-3, p-ATF2 and p27 upon the indicated treatments (n=2 independent experiments, 4 wells per condition each, mean, minimum and maximum). l. Western blots for the indicated antigens detected in E0771 cells treated for 24 hours with the TGFβ2, BMP7 and different BM-CM preparations. Molecular weight markers in kDa. *p≤0.05, p-values indicated above.
Extended Data 4
Extended Data 4. Effect of TGFβ2 and BMP7 on signalling pathways (using ELK, p38 and p27 sensors) and MSCs in E0771 cancer cell growth.
a-d. T-HEp3 cells with ERK, p38 and p27 activity biosensors were reversed transfected with control siRNA or siRNAs for TGFBRIII and BMPRII followed by 24-hour treatments with TGFβ2 and BMP7. a. TGFBRIII and BMPRII mRNA levels 48 hours after transfection with the indicated siRNAs (n=3 independent experiments, mean, minimum and maximum, 2-tailed Mann–Whitney tests, p=0.01 (TGFbR3) and 0.002 (BMPR2)). b-d. Quantification of the T-HEp3-biosensors activity (n=3 independent experiments each, mean, minimum and maximum, 2-tailed Mann–Whitney tests, p=0.05). e. Percentage of E0771 cells in a single cell (p=0.002), doublet or cluster (p=0.005) state after co-culture with Control (passaged) or revitalized (r) MSCs (n=4 independent experiments, 4 wells per condition per experiment, mean and SEM, 2-tailed Mann–Whitney tests). f. qPCR of TGFβ1, TGFβ2 and BMP7 from Control and rMSCs (n=2). *p≤0.05, p-values indicated above.
Extended Data 5
Extended Data 5. NG2-CreERTGFβ2 mouse model controls.
a. TGFβ1 mRNA levels in NG2+/Nestin+ MSCs (sorted using CD45-Ter119-CD31-PDGFRα+CD51+ markers) in NG2-CreERTGFβ2 mice upon TAM treatments compared with WT mice (n=4 independent experiments). b. TGFβ1, TGFβ2 and BMP7 mRNA levels in MSCs (CD45-CD31-Ter119-PDGFRα+CD51+), osteo-progenitor (CD45-Ter119-CD31-ALCAM+, OPCs) and endothelial (CD45-Ter119-CD31+vEcad+, ECs) cells from NG2-CreERTGFβ2 mice upon TAM treatments compared with WT mice (n=2 independent experiments). *p≤0.05, p-values indicated above.
Figure 1.
Figure 1.. Depletion of NG2+/Nestin+ MSCs awakens dormant DTCs in the BM.
a-b. Whole bone imaging of MMTV-Neu (GEM model, CK8/18+ cancer cells, representative image of 2 independent experiments) and E0771-GFP (intra-cardiac injected) BC cells (representative image of 5 independent experiments). Scale bars: 10μm (a), 20μm (b). c-f. Effect of NG2+/Nestin+ MSC depletion prior to BM seeding by DTCs (n=20 mice per condition from 3 independent experiments. Experimental design in ED Fig1a). c. Representative images of E0771-GFP+ DTC clusters in BM flushes from wild type (WT) and NG2+/Nestin+ MSC depleted mice (NG2-CreERiDTR). Scale bar 50μm. d. Incidence of bone metastasis (>1000 GFP+ DTCs/106 BM cells) 2 weeks after cancer cell injections (2-tailed Fisher’s exact test, p=0.001). e. H&E and GFP staining of WT and NG2-CreERiDTR bones. Scale bars, 500μm. f. Number of E0771-GFP cells per million of BM cells after BM flushing, counted manually (median, 2-tailed Mann–Whitney U-test, p=0.0004). g-h. Representative plots and gates used in FACS for detection and characterization of E0771-GFP cells in BM flushes. i. Number of E0771-GFP cancer cells per million of BM cells, counted by FACS (n=15 mice, median, 2-tailed Mann–Whitney U-test, p=0.021). j. Percentage of E0771-GFP cells Ki67high and p27+ (FACS) (n=14, median, 2-tailed Mann–Whitney U-test, p=0.038 and 0.05). *p≤0.05 (p-values indicated above).
Figure 2.
Figure 2.. Dormant to proliferative shift of BM E0771-GFP cancer cells upon depletion of NG2+/Nestin+ MSCs.
a. Representative images of p27 and Ki67 in E0771-GFP cells in WT and NG2-CreERiDTR bones. Single cells and small clusters are shown in WT mice and a metastasis in NG2-CreERiDTR. Scale bars 25μm; arrows, positive cells; arrowheads, negative cells; dotted lines, GFP+ cells border. b-c. Percentage of p27+ (b) and Ki67+ (c) E0771-GFP cells detected by immunofluorescence (n=6 WT and 5 iDTR mice, median, 2-tailed Mann–Whitney U-test, p=0.029 (b) and 0.05 (c)). d-f. Representative images (d, Scale bars 25μm; arrows, positive cells; arrowheads, negative cells) and quantification of pATF2+ (e) and pH3+ (f) E0771-GFP DTCs in WT and NG2-CreERiDTR bones (n=4 WT and 4 iDTR mice, 2-tailed Mann–Whitney U-test, p=0.03 (e) and 0.05 (f)). *p≤0.05 (p-values indicated above), n.s. not significant.
Figure 3.
Figure 3.. NG2+/Nestin+ MSCs are as a source of pro-dormancy factors TGFβ2 and BMP7 in the BM.
a. mRNA levels of sorted CD45-CD31-Nestin-GFP- and Nestin-GFPbright MSCs from Nestin-GFP mice (n=4 independent experiments, median, 2-tailed Mann–Whitney U-tests, p=0.027 (TGFβ2) and 0.031 (BMP7)). b. mRNA levels of sorted MSCs, OPCs and ECs (MSC population was used as reference, n=2 independent experiments, one-way ANOVA with Geissen-Greenhouse correction, p=0.034 (TGFb2) and 0.005 (BMP7)) c. TGFβ1, 2 and 3 and BMP7 levels in BM supernatant of WT and NG2-CreERiDTR mice 2 weeks after TAM and DT treatments (n=24 mice from 2 independent experiments, median, 2-tailed Mann–Whitney U-tests, p<0.0001 (TGFb2), and 0.011 (BMP7)). d-f. Imaging of Nestin-GFP+ MSCs in Nestin-GFP mice using IF. Dormancy factors TGFβ2 (white, d-e; red, f) and BMP7 (red, d-e) are expressed near MSCs (Nestin-GFP: green d-f; NG2: white, f; representative images of 3 independent experiments). Scale bars: 100μm (d-e) and 25uμm (f). Dotted rectangles (d), high-magnification insert. g-h. Analysis of n=55 ER+ BC patients with (M1) or without (M0) evidence of systemic recurrence (data from SATT clinical study. g. TGFβ2 and BMP7 levels from BM plasma samples from (2-tailed Fisher’s exact test, p=0.009). h. Metastasis-free survival analysis of patients who did not receive any secondary chemotherapy, excluding treatment-related interpretation bias, separated by detectable BMP7 levels compared to patients with no BMP7. *p≤0.05 (p-values indicated above), n.s. not significant.
Figure 4.
Figure 4.. NG2+/Nestin+ MSCs activate TGFβ2 and BMP7 growth inhibitory signalling in cancer cells.
a. Representative images of 3D co-cultures of E0771 cells with sorted Nestin-GFP- or + MSCs for 4 days. Top left: a single cell, a doublet and cluster of cancer cells. Scale bar 50μm; Bottom left: A NG2+/Nestin+ MSC (PDGFRα+, red) near a cancer cell cluster. Scale bar 50μm; Centre and right: Representative images of positive cells for cleaved caspase-3 (apoptotic cells), pRb (proliferative cells), p-ATF2 (p38-pathway activation) and p27 (quiescent cells) markers. Scale bars 10μm (representative images of 3 independent experiments). b. Percentage of E0771 cells in a single cell (p=0.01 and 0.03), doublet or cell cluster (p=0.04 and 0.02) states in the indicated co-cultures (n=3 independent experiments, mean and SEM, 2-tailed Mann–Whitney tests). c-f. Percentage of E0771 cancer cells positive for cleaved Caspase 3 (c-Cas-3), phospho-Rb, phospho-ATF2 and p27 in co-culture with Nestin-GFP- (dark green) or Nestin-GFP+ MSCs (bright green) (n=2 independent experiments, 4 wells per condition, mean, minimum and maximum). g-j. T-HEp3 cells with different bio-sensors were reversed transfected with siRNA for TGFBRIII and BMPRII followed by co-culture in trans-wells with sorted Nestin-GFP- or + cells. g. Representative images of T-HEp3 cells with ELK-Gal4::GFP (GFP+ when ERK1/2 pathway is active), p38-Clover (when p38 is active cytoplasmic signal predominates) and p27K-mVenus (mVenus signal indicates cell cycle arrest) bio-sensors (representative images of 3 independent experiments). Scale bar 25μm. h-j. Quantification of the T-HEp3 bio-sensor cell lines after transfection followed by 24-hour co-culture using trans-wells (n=3 independent experiments each, mean, minimum and maximum, 2-tailed Mann–Whitney tests, p=0.05). *p≤0.05, p-values indicated above.
Figure 5.
Figure 5.. Conditional knock out of TGFβ2 in NG2+/Nestin+ MSCs awakens dormant DTCs in the BM.
a. 7-week old NG2-CreER- or + TGFβ2f/f mice were i.p. treated daily with tamoxifen (TAM) for 5 days followed by intra-cardiac injection of 2×10⁵ E0771-GFP cells. Mice were euthanized and the organs collected 2 weeks after . b-c. Sorting strategy (b) and TGFβ2 mRNA levels (c) confirming the efficiency of TGFβ2 knockout in NG2+/Nestin+ MSCs (sorted using CD45-Ter119-CD31-PDGFRa+CD51+ markers) in NG2-CreERTGFβ2 mice upon TAM treatments compared with WT mice (n=4 independent experiments, median, 2-tailed Mann–Whitney U-tests, p=0.014 and 0.029). d. Incidence of bone metastasis (>1000 GFP+ DTCs/106 BM cells) 2 weeks after cancer cell injections (n=24 WT and 25 KO mice from 4 independent experiments, 2-tailed Fisher’s exact test, p=0.021). e. Number of E0771-GFP cancer cells per million of BM cells after BM flushing of WT and NG2-CreERTGFβ2 mice, counted manually (n=24 WT and 25 KO mice from 4 independent experiments, median, 2-tailed Mann–Whitney U-tests, p=0.016). f. Number of E0771-GFP cancer cells per million of BM cells after BM flushing, counted by FACS (n=7 WT and 12 KO mice, median, 2-tailed Mann–Whitney U-tests, p=0.004). g. Percentage of Ki67high E0771-GFP cancer cells (FACS, n=7 and 12 mice per condition, median, 2-tailed Mann–Whitney U-tests, p=0.05). h. Representative images of single cells and small clusters in WT and a metastasis in NG2-CreERiDTR. Scale bars 25μm; arrows, positive cells; arrowheads, negative cells; dotted lines, GFP+ cells border. i. Percentage of E0771-GFP cancer cells p27+ (p=0.029) and Ki67+ (p=0.029) detected by immunofluorescence (n=4 WT and 4 KO mice, median, 2-tailed Mann–Whitney U-tests). *p≤0.05, p-values indicated above.
Figure 6.
Figure 6.. Schematic representation of the model by which HSC niches induce dormancy of breast cancer DTCs in the BM.
We propose that niches that control HSC dormancy, such as NG2+/Nestin+ MSCs, are responsible for producing TGFβ2 and BMP7 and inducing breast cancer DTCs dormancy in the BM (left). Upon a reduction in the number of NG2+/Nestin+ MSCs (upper right) or in the production of TGFβ2 by MSCs (lower right), the homeostatic control is lost, dormancy interrupted and metastatic growth ensues. We hypothesize that perturbations of this niche caused by aging, osteoporosis or other alterations (center), may cause the niche to reduce its homeostatic control and allow for awakening of dormant DTCs in the BM. Individual elements of this original scheme were adapted from https://smart.servier.com following the terms of use and copyright license which authorize the use of their images.

References

    1. Chaffer CL & Weinberg RA A perspective on cancer cell metastasis. Science vol. 331 1559–1564 (2011). - PubMed
    1. Sherry MM, Greco FA, Johnson DH & Hainsworth JD Metastatic breast cancer confined to the skeletal system. An indolent disease. Am. J. Med. 81, 381–386 (1986). - PubMed
    1. Engel J et al. The process of metastasisation for breast cancer. Eur. J. Cancer 39, 1794–1806 (2003). - PubMed
    1. H??semann Y. et al. Systemic Spread Is an Early Step in Breast Cancer. Cancer Cell 13, 58–68 (2008). - PubMed
    1. Sanger N. et al. Disseminated tumor cells in the bone marrow of patients with ductal carcinoma in situ. Int. J. Cancer (2011) doi:10.1002/ijc.25895. - DOI - PubMed

Publication types