. 2022 Dec 31;17(1):2021664.
doi: 10.1080/15592324.2021.2021664. Epub 2022 Jan 7.

Effect of extremely low-frequency magnetic fields on light-induced electric reactions in wheat

Affiliations

Effect of extremely low-frequency magnetic fields on light-induced electric reactions in wheat

Marina Grinberg et al. Plant Signal Behav. .

Abstract

Magnetic field oscillations resulting from atmospheric events could have an effect on growth and development of plants and on the responsive reactions of plants to other environmental factors. In the current work, extremely low-frequency magnetic field (14.3 Hz) was shown to modulate light-induced electric reactions of wheat (Triticum aestivum L.). Blue light-induced electric reaction in wheat leaf comprises depolarization and two waves of hyperpolarization resulting in an increase of the potential to a higher level compared to the dark one. Fluorescent and inhibitory analysis demonstrate a key role of calcium ions and calcium-dependent H+-ATPase of the plasma membrane in the development of the reaction. Activation of H+-ATPase by the increased calcium influx is suggested as a mechanism of the influence of magnetic field on light-induced electric reaction.

Keywords: Schumann resonance; calcium; extremely low frequency magnetic field; light-induced electric reactions; wheat.


Conflict of interest statement

No potential conflict of interest was reported by the author(s).

Figures
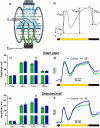
Figure 1.
Figure 1.
Effect of extremely low-frequency MF on the parameters of light-induced electric reaction of the wheat seedlings. The control is green, the MF is blue. a – Scheme of the experimental setup. Em, measuring electrodes; Eref, reference electrode. b – Light-induced electric reaction with key stages denoted. LIDp, light-induced depolarization; LIHp1, the first light-induced hyperpolarization; LIHp2, the second light-induced hyperpolarization; DIDp, dark-induced depolarization; c – amplitudes of the key phases and d – averaged curves of light-induced reactions in control and under MF action in whole plants; e – amplitudes of key phases and f – Averaged curves of light-induced reactions in control and under MF action in detached leaves. * – р < 0.05.
Figure 2.
Figure 2.
A typical blue light-induced reaction registered by microelectrode recording system from a wheat leaf mesophyll cell. The measurement scheme is presented on the left. Em – measuring electrodes; Eref – reference electrode.
Figure 3.
Figure 3.
A typical record of [Ca2+]cyt concentration dynamics accompanying blue light-induced electric reaction. Red line, dynamics of ΔF/F0; gray line, dynamics of electric potential recorded from the same leaf.
Figure 4.
Figure 4.
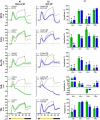
Effect of extremely low-frequency MF on the parameters of light-induced electric reaction of wheat seedlings in presence of inhibitors. The control is green, the MF is blue. a – Averaged records of the reactions in absence of the field compared to control without inhibitors. b – Averaged records of the reactions under MF compared to control without inhibitors. c – Diagrams of amplitude of the key phases of light-induced reactions as percentage of control amplitude. The dotted lines indicate the on and off of the light. # – Significant difference from inhibitor-free control, p < 0,05. * – Significant difference between groups in absence and in presence of MF, р < 0,05.
Figure 5.
Figure 5.
The suggested dependence of H+-ATPase activity on intracellular calcium concentration and levels of intracellular calcium in different conditions. C, control Ca2+ concentration (0.5 mM) in the solution; ↓Ca, decreased Ca2+ concentration provided by calcium chelator EDTA; ↑Ca, elevated Ca2+ concentration provided by excessive calcium content (5 mM) in the solution.

References

    1. Heckman SJ, Williams E, Boldi B.. Total global lightning inferred from Schumann resonance measurements. Journal of Geophysical Research: Atmospheres. 1998;103(D24):31775–9. doi:10.1029/98JD02648. - DOI
    1. Price C, Williams E, Elhalel G, Sentman D.. Natural ELF fields in the atmosphere and in living organisms. Int J Biometeorol. 2020;65(1):85–92. doi:10.1007/s00484-020-01864-6. - DOI - PubMed
    1. Price C, Melnikov A. Diurnal, seasonal and inter-annual variations in the Schumann resonance parameters. J Atmos Sol Terr Phys. 2004;66(13–14):1179–1185. doi:10.1016/j.jastp.2004.05.004. - DOI
    1. Greenberg E, Price C. Diurnal variations of ELF transients and background noise in the Schumann resonance band. Radio Science. 2007;42(2):1–14. doi:10.1029/2006RS003477. - DOI
    1. Maffei ME. Magnetic field effects on plant growth, development, and evolution. Front Plant Sci. 2014;5:445. doi:10.3389/fpls.2014.00445. - DOI - PMC - PubMed

Publication types

LinkOut - more resources